Related Plugins and Tags

QGIS Planet

QGIS 2.2 has landed in OSGeo4W

QGIS 2.2 is now available for Windows through OSGeo4W installer. Packages for other systems are being prepared by the package maintainers.

The Windows packages are currently marked experimental, so you have to use the advanced install in OSGeo4W and check the ‘Exp’ radio button on the top to install them.

osgeo4w_qgis22

As release manager Jürgen Fischer announced:

Please test and report problems, so that I can soon promote them to ‘curr’ent.
Once that has happend, I’ll proceed with turning them into standalone
installers.


AGIT 2013: QGIS Cloud - Karten einfach ins Netz

Noch nie war es so einfach individuelle Web Map Services mit ansprechenden Karten, Geodatenbank und Web Client zu erstellen, wie mit QGIS Cloud. Der am 5. Juli an der AGIT 2013 in Salzburg präsentierte Vortrag kann hier herunter geladen werden.

Präsentation

Multithreaded rendering with QGIS

Nowadays, most computers have several processor cores. However, most computer programs are still designed to only use one processing unit. As a convenient and portable way of writing software using all the available processing power, Qt provides the excellent QtConcurrent framework.

In 2010, a Google Summer of Code project examined the suitabilty of using Qt concurrent for rendering the map image in QGIS using several processor cores. Following that approach, each layer renders its image in a separate thread. Once all layer threads are finished, the layer images are composited into one map image and the labels are drawn on top of it. Despite providing good results, that code was unfortunately never merged into the main development branch.

QGIS Enterprise 13.05 will provide the capability of multithreaded rendering. A screencast of the new functionality shows that not only the render time is shorter using multiple cores. More important is to have the possibility to cancel the render progress and the labeling any time, thus achieving a much more responsive user interface when navigating maps.

NTv2 transformations with QGIS

Datum transformations with grid shift files are used in several countries to convert coordinates between different datums. In Switzerland, datum transformation using the NTv2 method is important because of the upcoming conversion between the LV03 system and the new LV95 system. Up to now, doing coordinate transformations with grid shift files was possible in QGIS, but unconvenient.

To use an NTv2 transformation in QGIS, the grid shift file needs to be placed in a directory where proj4 can find it (usually /usr/share/proj on Linux and OSGeo4W\share\proj on Windows). Alternatively, the environment variable PROJ_LIB can be set to point to the directory with the grid shift file(s). Then we have to enable the setting Options->CRS->’Ask for datum transformation when no default is defined’.

The next time we use a coordinate transformation which involves a datum transformation, a dialog shows up and presents the available options.

Now it is possible to select the NTv2 transformation file ‘chenyx06a.gsb’ to convert between LV03 and LV95. It is also possible to select the datum transformation as default to avoid being asked again. Default transformation settings can be changed / added / delted in the options tab (or set during installation by an administrator).

To use an NTv2 based transformation which is not yet in the projection database of QGIS, a new entry has to be added to the datum transformation table in srs.db. If you add a transformation which is widely used in your country, please send the changes back to the project so that those entries can be included by default.

The new datum transformation handling will be available in the upcoming QGIS 2.2 and QGIS Enterprise 13.05. The development has been funded by the Swiss cantons Basel-Landschaft and Solothurn. I also want to thank Fabio Di Pietro, Stefan Ziegler and Frank Warmerdam for answering all my questions about datums, coordinate transformations and proj4.

Just one more day until QGIS 2.2

QGIS 2.2 will be released tomorrow, February 21st. Following the release of 2.0, the QGIS project decided to move to a time-based release plan with releases every four months. This provides a clear framework for developers, translators and documenters which makes it possible to plan ahead and know when tasks have to be finished to be included in a release version.

Similar to the 2.0 release, the project has invested considerable resources to make 2.2 “Valmiera” a successful release. I have already blogged about some of the great new features. Thanks to the project donors and sponsors it was also possible to fund developer time for many important bug fixes.

One of the greatest resources of the QGIS project are its users. One group that deserves our special thanks is the Swiss QGIS User Group. They collect a modest annual membership fee which provides a steady and growing crowd-funding that can be used to positively influence the QGIS project. For example, they invested in bug fixing for 2.0 and they are co-funding work on multi-threaded rendering for QGIS 2.4.

With the rise of new QGIS user groups “QUGs” all around the world, e.g. in Australia, the UK, and the US, I hope these groups will find ways to bring users together and to positively influence the development of QGIS towards the next releases.


Using MetaSearch plugin to search and load (meta)data from your National Georegister

We (mostly Tom Kralidis, Angelos Tzotsos with some additions by me) just released the MetaSearch Catalogue Client plugin for QGIS. The new plugin is an update of the CSWClient plugin from NextGIS. This new MetaSearch plugin makes searching metadata and using the services peanuts! A Catalog Service for the Web (CSW), for example provided by […]

Sourcepole Kursprogramm Frühling 2014

Im Mai 2014 bietet Sourcepole wieder sein kompetentes Kursprogramm rund um alle GDI Komponenten an. Zu allen Kursen gehört umfangreiches Kursmaterial, Mittagessen und Kaffepausen. Bei Buchung eines Grundkurses und den darauf folgenden Aufbaukurs erhalten die Teilnehmer Rabatt auf den Kurspreis.

Geo-Datenbank:

  • PostgreSQL / PostGIS Einführung (5. - 6. Mai 2014)
  • PostgreSQL / PostGIS für Fortgeschrittene (7. Mai 2014)

Desktop GIS

  • QGIS 2.0 / Enterprise Desktop Grundkurs (12. - 13. Mai 2014)
  • QGIS 2.0 / Enterprise Desktop für Power User (14. Mai 2014)

Web GIS / OWS-Services

  • QGIS 2.0 / Enterprise Server und QGIS Web Client (22.Mai 2014)

QGIS Programmierung

  • QGIS 2.0 / Enterprise Plugin Entwicklung mit PyQt4 und PyQGIS (19. - 20. Mai 2014)

Informationen zu den Kursen und die Online Anmeldung finden Sie im Kursprogramm

Wir freuen uns darauf Sie in Zürich begrüssen zu können.

Finger Tired From Digitising? Try AutoTrace

My first brush with GIS was back in 2004. I was just getting into building river models and spent a considerable amount of time digitising model inputs. These would often include tens and sometimes hundreds of kilometres of river banks. Many of the input features (e.g. flood embankments) would be traced to snap exactly to existing polygon features.

This was not a big issue at the time as MapInfo had a really nice autotrace feature which made these tasks a doddle. However, when I moved to QGIS I could not find such a feature.

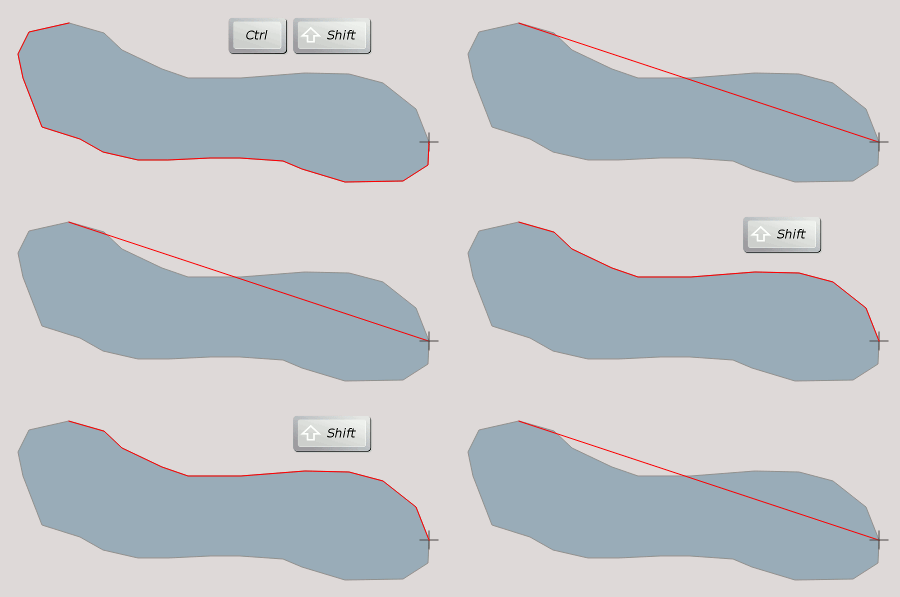
AutoTrace in Action

The image above shows AutoTrace in action. Please see the AutoTrace project page for full documentation and a list of co-funders.

Origins of AutoTrace Development

The idea to develop a plugin to do MapInfo-style tracing was born at the QGIS developer conference (AKA Hackfest) in Lisbon in early 2011. It was there that Paolo Cavalini pointed me towards the traceDigitize plugin already developed by Cédric Möri. traceDigitize already supported tracing but required the user to move the cursor along the edge of the feature being traced. I still had my heart set on achieving that MapInfo-style tracing.

Rather than re-inventing the wheel, traceDigitize was modified to add MapInfo-style tracing as an optional component. This was my development focus for the HF (and the flight back). At this stage the basic functionality was in-place but the plugin had many bugs and was not reliable to use. Unfortunately the plugin was mothballed until recently.

Release of AutoTrace

It was at the first QGIS UK User Group that I met Matt Travis (GIS Officer at Dartmoor NPA) and we got talking about AutoTrace. It transpired that there were a number of local government organisations interested in getting this auto-tracing functionality into QGIS. We soon had commitment from a number of organisations (including and organised by Kevin Williams at Neath Port Talbot Council) to fund the work required to release a stable version of the tool.

Future Plans

There's talk of extending the functionality of AutoTrace to also implement some of he more complex tracing techniques seen in ArcGIS. If this is something you'd be interested in then please let us know.

Many thanks to all those who have supported us in this project.

You may also like...

Mergin Maps, a field data collection app based on QGIS. Mergin Maps makes field work easy with its simple interface and cloud-based sync. Available on Android, iOS and Windows. Screenshots of the Mergin Maps mobile app for Field Data Collection
Get it on Google Play Get it on Apple store

Atlas previews in QGIS 2.2

QGIS 2.2 includes some great additions to the map composer’s “Atlas” feature. If you’re not familiar with atlas prints they are QGIS’ equivalent of ArcGIS’s “data driven pages”, or something like a map based version of Microsoft Word’s “mail merge”. In an atlas composition you can select one of your map layers to use as a “coverage layer“, and QGIS will automatically generate multiple pages from the composition with each page highlighting a different feature from this coverage layer.

Atlas Previews

Thanks to funding from SIGE, I’ve added some useful new features to QGIS’ atlas abilities for 2.2. The first of these is the ability to preview atlas compositions before printing them. In QGIS 2.0, atlas generation took a bit of guess work. You’d set up the parameters for the atlas, then export the whole atlas in one shot and just hope you’d got the settings right. If not, you’d have to tweak the settings and export the whole lot again to see the result. But not any more! Now, in QGIS 2.2, you can switch on a live atlas preview mode by clicking “Preview Atlas” in the new atlas preview toolbar:

The new atlas preview toolbar

The new atlas preview toolbar

The composer window will switch to showing you a preview of exactly how the atlas will look when exported. You can tweak the appearance of any layout item, adjust the atlas and map parameters, or experiment with the new options for atlas feature styling to see instantly what the final export will look like.
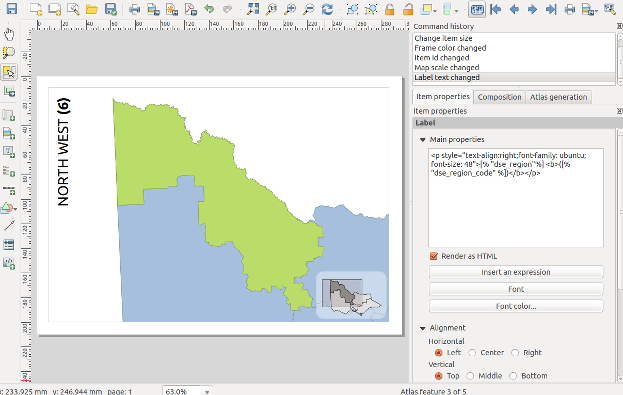
The composer window in atlas preview mode

The composer window in atlas preview mode (complete with gratuitous use of label rotation and rounded rectangles…) 

When this Atlas Preview mode is enabled, you navigate through all the features in the coverage layer by clicking any of the navigation buttons in the atlas preview toolbar:

Navigating the atlas preview

Navigating the atlas preview

While previewing you can export individual pages from the atlas. So, if just one or two pages in your atlas need to be individually tweaked you can do that as you step through the features. A neat thing with this is that you can make temporary tweaks to the extent and scale of the map items as you go, without affecting how the rest of the atlas maps look.

(Oh, by the way, I should mention that as an added bonus QGIS 2.2 lets you control more than one map with an atlas print!)

Selecting the current atlas feature

The second part of the work funded by SIGE was creation of shortcut actions for selecting the current atlas feature. If your atlas coverage layer has many records it may not be practical to step through the atlas previews one at a time until you find a specific feature. That’s where these new shortcut actions come in handy!

There’s a few ways of jumping directly to a specific atlas feature. The first is to open a browser window for your coverage layer, then right click a row and choose “Set as atlas feature for …“:

Setting the atlas feature from the browser window

Setting the atlas feature from the browser window

Selecting this menu item will cause the composer to immediately jump to the matching atlas row. Another way of selecting the current atlas feature is to use the “Set as atlas feature” map action. You activate this by first selecting your coverage layer in the layers panel, then clicking the “Run Feature Action” tool button and selecting “Set as atlas feature…“:

The set atlas feature map action

The set atlas feature map action

The mouse cursor will change to a cross-hair, and clicking any matching feature in the map window will cause the composer atlas preview to jump straight to that feature. Lastly, you can also activate the “Set as atlas feature” action directly from the identify results window.

That’s just a small taste of some of the new atlas creation features which will be available in QGIS 2.2, coming your way by the end of February 2014!

(One last note – as mentioned, this work was kindly sponsored by SIGE. If there’s a specific composer based feature or bug you’d like me to work on, I’m available for further sponsored work. Just contact me directly for details.)

podcast.qgis.org

This weekend, I had the pleasure to join Tim Sutton for the second edition of the QGIS Podcast. Every episode, the podcast aims to summarize the latest mailing list discussions and greatest new features.
This episode’s topics include: new CAD tools, usability and the new UX mailing list, new QGIS user groups (QUGs), point cloud support plans, and QGIS design.

If you would like to ask a question or suggest a topic, you can write to [email protected].


FOSS4G 2014 is taking off

If you want to become an active part of this year’s FOSS4G, it’s now time to start thinking about your contributions!

FOSS4G 2014 will be taking place in Portland, Oregon, USA from Sept 8th-12th. Like last year in Nottingham, there will be a regular track for presentations as well as an academic track and a series of workshops.

logo_horiz_500x231

If you are looking for inspiration, you might want the check out last year’s programme or read about the interesting story behind this years conference logo.


QGIS – Two neat features in 2.2

Here’s a quick run-down on two nice new styling options which I’ve recently added to QGIS 2.2.

Map styling for compositions

This little feature was suggested by Mathieu Pellerin, who is always pushing the boundaries of QGIS’ cartographic tools and coming up with great ideas for new styling features (you can check out some of his work via Flickr). Mathieu’s idea was for a new ‘$map‘ variable for the expression builder. This variable holds the id of the map item which is drawing the map, and allows for some nice tweaking of maps in the composer.

The $map variable is most useful when you have more than one map in your composition. The example below shows $map being used to change the styling of a single layer from the main map to the smaller inset map:

Using $map to style two maps with different colours

Using $map to style a single layer in two maps with different colours

In this example the composition has two maps, the larger has an id of “main_map” and the smaller has “inset_map“. The boundary layer has been styled using the rule based renderer, with one rule for $map=’main_map’ and one for $map=’inset_map’, as shown below:

Rule based rendering using the $map variable

Rule based rendering using the $map variable

The end result is that the layer will be rendered using the two different styles depending on which composer map item it is being drawn into. This trick can also be used to tweak labelling rules between the maps. In the example above I’ve restricted the labelling to only show in the main map. This is achieved by setting an expression for the data defined “Show label” property. I’ve used the expression “$map=’main_map’” so that labels are only shown in the main map and not the smaller inset map.

Tweaking label settings using the $map variable

Tweaking label settings using the $map variable

This small addition to QGIS 2.2 allows for some rather powerful improvements to multi-map compositions!

Drawing polygon borders only inside the polygon

The second new feature I wanted to highlight is a new option for polygon outlines which causes the outline to be drawn only on the inside of a polygon feature. The usual behaviour is for outlines to be drawn directly over the centre of the feature boundary, so that half of the outline is drawn inside the feature and half on the outside.

Simple Line Fill before

This means that the outline in a simple line symbol layer overlaps into the neighbouring polygons, and the result is that outlines from these features blend together:

Shaded borders pre QGIS 2.2

Shaded borders pre QGIS 2.2 – see how the colours bleed into the neighbouring features and overlap

This looks like a big muddy mess. A feature I’ve wanted for a long time is the ability to restrict these outlines so that they are only drawn inside the feature. This effect is commonly seen in world atlases and National Geographic maps, where each neighbouring country is shaded with it’s own unique outline colour. Now it’s possible to do this in QGIS just by ticking a single box!

The new "Draw line only inside polygon" option

The new “Draw line only inside polygon” option

As you can see in the above image, the simple line outline style has a new checkbox, “Draw line only inside polygon“. Ticking this box will clip the outline so that only the portion of it which falls inside the feature is rendered. Here’s the result:

Shaded borders with "Draw line only inside polygon" checked

Shaded borders with “Draw line only inside polygon” checked

So much nicer then the earlier output – now none of the borders overlap into their neighbouring regions! Ok, so it is possible to achieve a similar result by creating a specially crafted layer consisting of negatively buffered polygons subtracted from the original polygons, but this takes a lot of fiddling around. It also has the major disadvantage in that the result is scale dependant, and zooming in or out of the map will alter the size of the polygon outlines. But using this wonderful new checkbox in QGIS, we get proper scale-independent borders, and zooming in or out of the map keeps a consistent border width!

Zooming in keeps a consistent border width...

Zooming in keeps a consistent border width…

So there we go – two small new features added in QGIS 2.2 which have huge potential for your cartographic outputs! As per usual, if you come up with some fancy way of utilising these, don’t forget to add your maps to the QGIS Showcase on Flickr.

A QGIS 2.2 preview

With the major release of version 2.0, QGIS is once more returning to a fast release cycle. You can find the project road map on qgis.org. The QGIS 2.2 release is scheduled for Feb, 21st and we are already in feature freeze. This means that now is the time to get the nightly version, do some testing and report possible bugs before the new version is being shipped.

Like for version 2.0, the QGIS team has prepared a great visual change log listing many new features. For me, one of the feature highlights is the possibility to export maps with world files from Print Composer because it means that we can finally create high-resolution, georeferenced images comfortably from within the application.

Another feature which will help save a lot of time is the ability to invert color ramps. So far, we had to recreate the color ramp or use work-arounds involving expression-based color settings to achieve the same effect.

invertcolorramp

These are just my personal favorites. If you haven’t checked out the change log yet, I certainly encourage you to have a look and decide for yourself. Also, if you find the time, please help by testing and reporting any issues you encounter. This way, we can all help to make 2.2 another successful release.


Function editor for QGIS expressions

A new feature for QGIS 2.8 is a function editor for expressions. Being able to define your own custom functions has be possible for a while now, over a year, I even have a plugin (Expressions+) that adds some extra ones, however it wasn’t easy for new users and required you to create files that lived on python path while also editing the startup.py file for QGIS so that functions got registed at start up. Way too much effort for my liking.

This feature is now exposed via the expression builder on the Function Editor tab. The function editor will create new Python files in qgis2\python\expressions and will auto load all functions defined when starting QGIS. I remember Sean Gillies saying that Python support in a field calculator should be a gateway to full Python programming, can’t get any more Python then full Python modules.

The best way to show this feature is a quick video so here it is

The play button in the editor will run the current editor file in the QGIS session and register any functions it finds, it will also save the file in the expressions folder.

You can make a new file by pressing the new file button which will add the basic function template, changing the name in the combobox and hitting save will save the file.

The function editor allows you have to define reuseable functions for your QGIS. If you want to share a function you simply share the .py file from the expressions folder and give it to another user. In future versions of QGIS we might have a way to download other users functions.

Auto expanding values

You can also use the args="auto" keyword in place of the number of args which will let QGIS work it out and expand the arguments for you.

Here is an example

@qgsfunction(args="auto", group='Custom')
def myfunc(value1, value2 feature, parent):
    pass

and can be used like this:

myfunc('test1', 'test2')

QGIS will workout how many arguments your function takes based on what you have defined. Note: The last arguments should always be feature, parent, these are not included in the count.

Raising errors

If you need to report a error from a function simply use the raise method like normal in QGIS and raise an exception.

@qgsfunction(args="auto", group='Custom')
def myfunc(value1, value2 feature, parent):
    raise Expection("Hahah Nope!")

The function wrapper will catch the exception and raise it though the expression engine.

A couple of things to note

  • New functions are only saved in the expressions folder and not in the project file. If you have a project that uses one of your custom functions you will need to also share the .py file in the expressions folder.
  • The editor doesn’t unregister any functions. If you define a function called test, hit play, change the name to test_2, hit play, both functions will exist until you reload QGIS.

Filed under: Open Source

Waiting for QGIS 2.2 – Composer Improvements (part 3)

Following on from parts 1 and 2, here’s some more composer changes which are coming in QGIS 2.2

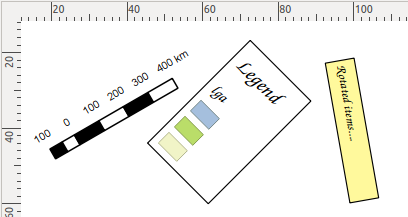
  • Rotation support for all composer item types. Now anything you draw in a composer can be rotated, including scale bars, legends, attribute tables and html frames! Rotation of text labels has also been improved by making the border and background of labels respect the rotation of the label.
Every composer item can now be rotated...

Every composer item can now be rotated…

  • Resizing of rotated items has been improved. Now it’s possible to easily resize rotated items while keeping their correct shape. (There’s still one missing ingredient for complete support here – shear/perspective transforms. Unfortunately this will probably have to wait till 2.4).
Better resizing of rotated items

Better resizing of rotated items

  • Rulers can be shown or hidden in compositions
  • The ruler appearance has been tweaked, adding smaller divisions and better text placement
The ruler appearance has been tweaked

New tweaked appearance for rulers

  • A zoom to actual size button and short cut (Ctrl + 1) have been added
Zoom to 100%

New Zom to 100% button

  • Lastly, the status bar has a new zoom combo box, which shows the current zoom level and allows for quick zoom to several predefined levels. You can also enter an exact zoom level in the box for precise control.
New zoom levels combo box in the status bar

New zoom levels combo box in the status bar

As you can see, the print composer in QGIS 2.2 just keeps getting better! There’s a few other really exciting new additions which have landed recently too, but they deserve their own blog posts. Stay tuned…

PyQGIS Programmer's Guide Available

The preview release of the PyQGIS Programmer’s Guide is now available for purchase from Locate Press.

  • <<
  • Page 80 of 142 ( 2821 posts )
  • >>

Back to Top

Sustaining Members