Related Plugins and Tags

QGIS Planet

Rendering a brain CT scan in 3D with GRASS GIS 7

brainscan1Last year (2013) I “enjoyed” a brain CT scan in order to identify a post-surgery issue – luckily nothing found. Being in Italy, like all patients I received a CD-ROM with the scan data on it: so, something to play with! In this article I’ll show how to easily turn 2D scan data into a volumetric (voxel) visualization.

The CT scan data come in a DICOM format which ImageMagick is able to read and convert. Knowing that, we furthermore need the open source software packages GRASS GIS 7 and Paraview to get the job done.

First of all, we create a new XY (unprojected) GRASS location to import the data into:

# create a new, empty location (or use the Location wizard):
grass70 -c ~/grassdata/brain_ct

We now start GRASS GIS 7 with that location. After mounting the CD-ROM we navigate into the image directory therein. The directory name depends on the type of CT scanner which was used in the hospital. The file name suffix may be .IMA.

Now we count the number of images, convert and import them into GRASS GIS:

# list and count
LIST=`ls -1 *.IMA`
MAX=`echo $LIST | wc -w`

# import into XY location:
curr=1
for i in $LIST ; do

# pretty print the numbers to 000X for easier looping:
curr=`echo $curr | awk ‘{printf “%04d\n”, $1}’`
convert “$i” brain.$curr.png
r.in.gdal in=brain.$curr.png out=brain.$curr
r.null brain.$curr setnull=0
rm -f brain.$curr.png
curr=`expr $curr + 1`

done

At this point all CT slices are imported in an ordered way. For extra fun, we can animate the 2D slices in g.gui.animation:

Animation of brain scan slices
(click to enlarge)

# enter in one line:
g.gui.animation rast=`g.mlist -e rast separator=comma pattern=”brain*”`

The tool allows to export as animated GIF or AVI:

Animation of brain scan slices (click to enlarge)

Now it is time to generate a volume:

# first count number of available layers
g.mlist rast pat=”brain*” | wc -l

# now set 3D region to number of available layers (as number of depths)
g.region rast=brain.0003 b=1 t=$MAX -p3

At this point the computational region is properly defined to our 3D raster space. Time to convert the 2D slices into voxels by stacking them on top of each other:

# convert 2D slices to 3D slices:
r.to.rast3 `g.mlist rast pat=”brain*” sep=,` out=brain_vol

We can now look at the volume with GRASS GIS’ wxNVIZ or preferably the extremely powerful Paraview. The latter requires an export of the volume to VTK format:

# fetch some environment variables
eval `g.gisenv -s`
# export GRASS voxels to VTK 3D as 3D points, with scaled z values:
SCALE=2
g.message “Exporting to VTK format, scale factor: $SCALE”
r3.out.vtk brain_vol dp=2 elevscale=$SCALE \
output=${PREFIX}_${MAPSET}_brain_vol_scaled${SCALE}.vtk -p

Eventually we can open this new VTK file in Paraview for visual exploration:

# show as volume
# In Paraview: Properties: Apply; Display Repres: volume; etc.
paraview –data=brain_s1_vol_scaled2.vtk

markus_brain_ct_scan3 markus_brain_ct_scan4 markus_brain_ct_scan2


Fairly easy!

BTW: I have a scan of my non-smoker lungs as well :-)

The post Rendering a brain CT scan in 3D with GRASS GIS 7 appeared first on GFOSS Blog | GRASS GIS Courses.

QGIS Layer Tree API (Part 2)

In part 1 we covered how to access the project’s layer tree and read its data. Now let’s focus on building and manipulating layer trees. We’ll also look at how to receive updates about changes within a layer tree.

Starting with an empty project, first we will get access to the layer tree and create some memory layers for testing:

root = QgsProject.instance().layerTreeRoot()

layer1 = QgsVectorLayer("Point", "Layer 1", "memory")
layer2 = QgsVectorLayer("Polygon", "Layer 2", "memory")

Adding Nodes

Now let’s add some layers to the project’s layer tree. There are two ways of doing that:

  1. Explicit addition. This is done with the addLayer() or insertLayer() call of the QgsLayerTreeGroup class. The former appends to the group node, while the latter allows you to specify the index at which the layer should be added.

    # step 1: add the layer to the registry, False indicates not to add to the layer tree
    QgsMapLayerRegistry.instance().addMapLayer(layer1, False)
    # step 2: append layer to the root group node
    node_layer1 = root.addLayer(layer1)
    
  2. Implicit addition. The project’s layer tree is connected to the layer registry and listens for the addition and removal of layers. When a layer is added to the registry, it will be automatically added to the layer tree. It is therefore enough to simply add a layer to the map layer registry (leaving the second argument of addMapLayer() with its default value of True):

    QgsMapLayerRegistry.instance().addMapLayer(layer1)
    

    This behaviour is facilitated by the QgsLayerTreeRegistryBridge class. By default it inserts layers at the first position of the root node. The insertion point for new layers can be changed - within the QGIS application the insertion point is updated whenever the current selection in the layer tree view changes.

Groups can be added using the addGroup() or insertGroup() calls of the QgsLayerTreeGroup class:

node_group1 = root.insertGroup(0, "Group 1")
# add another sub-group to group1
node_subgroup1 = node_group1.addGroup("Sub-group 1")

There are also the general addChildNode(), insertChildNode() and insertChildNodes() calls that allow the addition of existing nodes:

QgsMapLayerRegistry.instance().addMapLayer(layer2, False)

node_layer2 = QgsLayerTreeLayer(layer2)
root.insertChildNode(0, node_layer2)

node_group2 = QgsLayerTreeGroup("Group 2")
root.addChildNode(node_group2)

Nodes that are being added must not have any parent yet (i.e. being part of some layer tree). On the other hand, the nodes that get inserted may already have children, so it is possible to create a whole sub-tree and then add it in one operation to the project’s layer tree.

Removing Nodes

The removal of nodes from a layer tree is always done from the parent group node. For example, nodes displayed as top-level items need to be removed from the root node. There are several ways of removing them. The most general form is to use the removeChildren() method that takes two arguments: the index of the first child node to be removed and how many child nodes to remove. Removal of a group node will also remove all of its children.

There are several convenience methods for removal:

root.removeChildNode(node_group2)

root.removeLayer(layer1)

There is one more way to remove layers from the project’s layer tree:

QgsMapLayerRegistry.instance().addMapLayer(layer1)

The project’s layer tree is notified when any map layers are being removed from the map layer registry and the layer nodes representing affected layers will be automatically removed from the layer tree. This is handled by the QgsLayerTreeRegistryBridge class mentioned earlier.

Moving Nodes

When managing the layer tree, it is often necessary to move some nodes to a different position - within the same parent node or to a different parent node (group). Moving a node is done in three steps: 1. clone the existing node, 2. add the cloned node to the desired place in layer tree, 3. remove the original node. The following code assumes that the existing node we move is a child of the root node:

cloned_group1 = node_group1.clone()
root.insertChildNode(0, cloned_group1)
root.removeChildNode(node_group1)

Modifying Nodes

There are a number of operations one can do with nodes:

  1. Rename. Both group and layer nodes can be renamed. For layer nodes this will modify the name directly inside the map layers.

    node_group1.setName("Group X")
    node_layer2.setLayerName("Layer X")
    
  2. Change visibility. This is actually a check state (checked or unchecked, for group nodes also partially checked) that is associated with the node and normally related to the visibility of layers and groups in the map canvas. In the GUI, the layer tree view is capable of showing a check box for changing the state.

    print node_group1.isVisible()
    node_group1.setVisible(Qt.Checked)
    node_layer2.setVisible(Qt.Unchecked)
    
  3. Change expanded state. The boolean expanded/collapsed state refers to how the node should be shown in layer tree view in the GUI - whether its children should be shown or hidden.

    print node_group1.isExpanded()
    node_group1.setExpanded(False)
    
  4. Change custom properties. Each node may have some associated custom properties. The properties are key-value pairs, keys being strings, values being of variant type (QVariant). They can be used by other components of QGIS or plugins to store additional data. Custom properties are preserved when a layer tree is saved and loaded.

    Use the customProperties() call to get a list of keys of custom properties, then the customProperty() method for getting the value of a particular key. To modify properties, there is a setCustomProperty() method which sets a key-value pair and a removeCustomProperty() method to remove a pair.

    node_group1.setCustomProperty("test_key", "test_value")
    print node_group1.customProperties()
    print node_group1.customProperty("test_key")
    node_group1.removeCustomProperty("test_key")
    print node_group1.customProperties()
    

Signals from Nodes

There are various signals emitted by nodes which may be used by client code to follow changes to the layer tree. Signals from children are automatically propagated to their parent node, so it is enough to connect to the root node to listen for changes from any level of the tree.

Modification of the Layer Tree Structure

The addition of new nodes always emits a pair of signals - before and after the actual addition. Signals pass information about which node is the parent node and the range of child indices:

  • willAddChildren(node, indexFrom, indexTo)
  • addedChildren(node, indexFrom, indexTo)

In order to access the newly added nodes, it is necessary to use the addedChildren signal.

The following code sample illustrates how to connect to signals emitted from the layer tree. When the last line is executed, two lines from the newly defined methods should be printed to the console:

def onWillAddChildren(node, indexFrom, indexTo):
  print "WILL ADD", node, indexFrom, indexTo
def onAddedChildren(node, indexFrom, indexTo):
  print "ADDED", node, indexFrom, indexTo

root.willAddChildren.connect(onWillAddChildren)
root.addedChildren.connect(onAddedChildren)

g = root.addGroup("My Group")

Removal of nodes is handled in a very similar manner to the addition - there is also a pair of signals:

  • willRemoveChildren(node, indexFrom, indexTo)
  • removedChildren(node, indexFrom, indexTo)

This time in order to access nodes being removed it is necessary to connect to the willRemoveChildren signal.

Modification of Tree Nodes

There are a few more signals that allow monitoring of internal changes to nodes:

  • a node is checked or unchecked: visibilityChanged(node, state)
  • a node’s custom property is defined or removed: customPropertyChanged(node, key)
  • a node gets expanded or collapsed: expandedChanged(node, expanded)

Summary

We have covered how to make changes to a layer tree structure and how to listen for changes possibly made by other pieces of code. In a future post we look at GUI components for displaying and modifying the layer tree and the connection between map canvas and layer tree.

You may also like...

Mergin Maps, a field data collection app based on QGIS. Mergin Maps makes field work easy with its simple interface and cloud-based sync. Available on Android, iOS and Windows. Screenshots of the Mergin Maps mobile app for Field Data Collection
Get it on Google Play Get it on Apple store

Training courses calendar: QGIS (Desktop, Server and Web) and PostGIS

We just published our Training Courses calendar for the period September 2014 – January 2015. This includes training courses about QGIS (Desktop, Server and Web) and PostgreSQL/PostGIS in both Italy and Portugal. Training courses about QGIS python programming are available on demand. For details (locations, prices, discounts, etc.) about training courses in Portugal see: http://www.faunalia.eu/pt/training.html […]

Visualizing direction-dependent values

When mapping flows or other values which relate to a certain direction, styling these layers gets interesting. I faced the same challenge when mapping direction-dependent error values. Neighboring cell pairs were connected by two lines, one in each direction, with an associated error value. This is what I came up with:

srtm_errors_1200px

Each line is drawn with an offset to the right. The size of the offset depends on the width of the line which in turn depends on the size of the error. You can see the data-defined style properties here:

directed_error_style

To indicate the direction, I added a marker line with one > marker at the center. This marker line also got assigned the same offset to match the colored line bellow. I’m quite happy with how these turned out and would love to hear about your approaches to this issue.

srtm_errors_detail

These figures are part of a recent publication with my AIT colleagues: A. Graser, J. Asamer, M. Dragaschnig: “How to Reduce Range Anxiety? The Impact of Digital Elevation Model Quality on Energy Estimates for Electric Vehicles” (2014).


Installing PySAL for OSGeo4W

Today’s post is a summary of how to install PySAL on Windows for OSGeo4W Python.

The most important resource was https://trac.osgeo.org/osgeo4w/wiki/ExternalPythonPackages

In the OSGeo4W Shell run:

C:\Users\anita_000\Desktop>curl http://python-distribute.org/distribute_setup.py | python

Update: Note that python-distribute.org has gone down since I posted this. See http://www.gossamer-threads.com/lists/python/python/1158958 for more info.

Then download https://raw.githubusercontent.com/pypa/pip/master/contrib/get-pip.py to the Desktop and run:

C:\Users\anita_000\Desktop>python get-pip.py

When pip is ready, install PySAL:

C:\Users\anita_000\Desktop>pip install pysal

Test the installation:

C:\Users\anita_000\Desktop>python
Python 2.7.5 (default, May 15 2013, 22:44:16) [MSC v.1500 64 bit (AMD64)] on win 32
Type "help", "copyright", "credits" or "license" for more information.
>>> import pysal

OSM Toner style town labels explained

The point table of the Spatialite database created from OSM north-eastern Austria contains more than 500,000 points. This post shows how the style works which – when applied to the point layer – wil make sure that only towns and (when zoomed in) villages will be marked and labeled.

Screenshot 2014-07-12 12.30.21

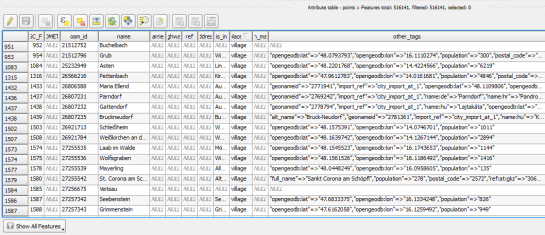
In the attribute table, we can see that there are two tags which provide context for populated places: the place and the population tag. The place tag has it’s own column created by ogr2ogr when converting from OSM to Spatialite. The population tag on the other hand is listed in the other_tags column.

Screenshot 2014-07-12 13.00.15

for example

"opengeodb:lat"=>"47.5000237","opengeodb:lon"=>"16.0334769","population"=>"623"

Overview maps would be much too crowded if we simply labeled all cities and towns. Therefore, it is necessary to filter towns based on their population and only label the bigger ones. I used limits of 5,000 and 10,000 inhabitants depending on the scale.

Screenshot 2014-07-12 12.56.33

At the core of these rules is an expression which extracts the population value from the other_tags attribute: The strpos() function is used to locate the text "population"=>" within the string attribute value. The population value is then extracted using the left() function to get the characters between "population"=>" and the next occurrence of ". This value can ten be cast to integer using toint() and then compared to the population limit:

5000 < toint( 
   left (
      substr(
         "other_tags",
         strpos("other_tags" ,'"population"=>"')+16,
         8
      ),
      strpos(
         substr(
            "other_tags",
            strpos("other_tags" ,'"population"=>"')+16,
            8
         ),
        '"'
      )
   )
) 

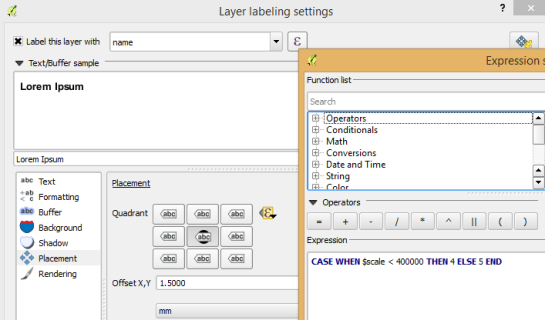
There is also one additional detail concerning label placement in this style: When zoomed in closer than 1:400,000 the labels are placed on top of the points but when zoomed out further, the labels are put right of the point symbol. This is controlled using a scale-based expression in the label placement:

Screenshot 2014-07-12 13.32.47

As usual, you can find the style on Github: https://github.com/anitagraser/QGIS-resources/blob/master/qgis2/osm_spatialite/osm_spatialite_tonerlite_point.qml


Multiple map grids in the QGIS print composer

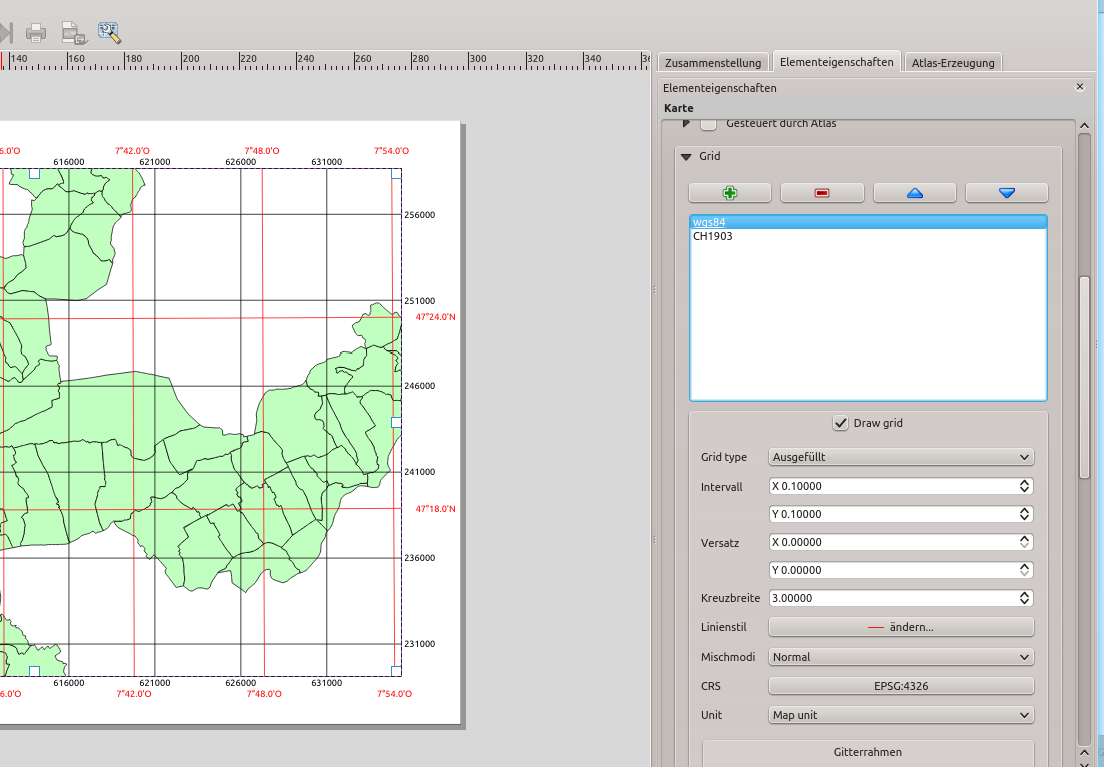
In printed maps, having several coordinate grids over one map is a very usefull feature. For instance using a meter system as output CRS, it is nice to display a latitude / longitude grid as well. Until now, the QGIS print composer allowed only one coordinate grid per composer map and it was restricted to the map output CRS.

Having that multigrid / multiCRS feature in QGIS Enterprise since 13.04 already, I’ve recently found the time to port it into the QGIS developer version. Therefore it will be part of the upcoming version 2.6 in October. The screenshot below shows how it can be used to add a wgs84 grid onto a meter map. In the composermap widget, grids can be added / removed and reordered. Additionally there is now a CRS selection button to select the coordinate system for the grid. The development of this feature has been kindly funded by Canton of Solothurn (Switzerland).

Using QGIS processing scripts

One of the area’s that QGIS is constantly improving is the ‘Processing framework’, Formerly known as the sextante framework and written in java, it is rewritten in Python by one of the original authors Victor Olaya and made part of QGIS since about QGIS 2.0. I think it is VERY usefull and in use a … Continue reading Using QGIS processing scripts

Multiple map grids in the QGIS print composer

In printed maps, having several coordinate grids over one map is a very usefull feature. For instance using a meter system as output CRS, it is nice to display a latitude / longitude grid as well. Until now, the QGIS print composer allowed only one coordinate grid per composer map and it was restricted to the map output CRS.

Having that multigrid / multiCRS feature in QGIS Enterprise since 13.04 already, I’ve recently found the time to port it into the QGIS developer version. Therefore it will be part of the upcoming version 2.6 in October. The screenshot below shows how it can be used to add a wgs84 grid onto a meter map. In the composermap widget, grids can be added / removed and reordered. Additionally there is now a CRS selection button to select the coordinate system for the grid. The development of this feature has been kindly funded by Canton of Solothurn (Switzerland).

Composer_grid

QGIS Layer Tree API (Part 1)

This blog post will be about the QGIS component responsible for showing the list of layers. In the QGIS project we typically call this component the “legend widget”. People used to other GIS software may also use other names such as “table of contents (ToC)”.

Layers in the legend widget can be organised into groups. This grouping allows easier manipulation of layers. For example it is possible to toggle the visibility of all layers at once. In addition to layers, groups can also contain other groups, effectively creating a hierarchy of groups and layers. From now on, we will refer to this hierarchy as the layer tree.

The legend widget might look like this:

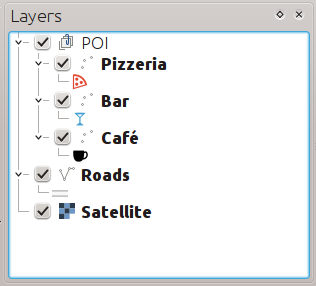
QGIS Legend Widget

Until QGIS 2.4, there has been only limited support for interacting with the legend widget using the QGIS API. There is a QgsLegendInterface class (which can be obtained with iface.legendInterface()) available for plugins. The legend interface has emerged in an ad-hoc way, leading to various issues when used in plugins. It is also worth noting that third-party applications based on QGIS have no access to the legend interface.

Layer Tree API

The layer tree API has been introduced in QGIS 2.4 to overcome these existing problems and add even more flexibility to the way the layer tree can be queried or modified.

The layer tree is a classical tree structure built of nodes. There are currently two types of nodes: group nodes and layer nodes. Group nodes can contain other (child) nodes, while layer nodes are ‘leaves’ of the tree, without any child nodes. The layer tree for the legend widget shown in the picture above looks like this:

Layer Tree Structure

The green nodes are group nodes (QgsLayerTreeGroup class) and the yellow nodes are layer nodes (QgsLayerTreeLayer class).

The legend widget also displays items using symbols, making it look like a real legend. The symbology is not part of the layer tree and will be discussed in an upcoming post.

To start working with the layer tree, we first need a reference to its root node. The project’s layer tree can be accessed easily:

root = QgsProject.instance().layerTreeRoot()

The root node is a group node - its children are shown as top-level items in the legend widget.

print root
print root.children()

This returns a list of the children of a node. The list includes only direct children - children of sub-groups need to be queried directly from those sub-groups.

Now let’s try to access the first child node in the tree and do a little bit of introspection:

child0 = root.children()[0]
print child0
print type(child0)
print isinstance(child0, QgsLayerTreeLayer)
print child0.parent()

With the children() and parent() methods it is possible to traverse the layer tree. A node is the root node of a tree if it has no parent:

print root.parent()

The following example shows how to list top-level items of the layer tree. For group nodes it will print the group name, for layer nodes it will print the layer name and ID.

for child in root.children():
  if isinstance(child, QgsLayerTreeGroup):
    print "- group: " + child.name()
  elif isinstance(child, QgsLayerTreeLayer):
    print "- layer: " child.layerName() + "  ID: " + child.layerId()

In order to traverse the full layer tree, it would be necessary to recursively call the same code for sub-groups.

There are some helper routines for common tasks like finding nodes representing layers in the tree. These take into account all descendants, not just top-level nodes.

ids = root.findLayerIds()
print ids
print root.findLayers()
print root.findLayer(ids[0])

It is assumed that a single layer is represented in a layer tree only once. There may however be temporary situations when a layer is represented by more than one node, for example when moving nodes (a new node is created before the old one is removed shortly after).

Similarly it is possible to search for group nodes by name:

print root.findGroup("POI")

Group names are not necessarily unique - if there are multiple groups with the same name, the first encountered during tree traversal will be returned.

Summary

In this blog post we have shown how to query the project’s layer tree. Upcoming blog entries will focus on modifying the layer tree and interacting with other parts of QGIS.

You may also like...

Mergin Maps, a field data collection app based on QGIS. Mergin Maps makes field work easy with its simple interface and cloud-based sync. Available on Android, iOS and Windows. Screenshots of the Mergin Maps mobile app for Field Data Collection
Get it on Google Play Get it on Apple store

QGIS – Mapping Election Results, pt 2: Adding and overlaying the data in QGIS

Continuing on from the previous tutorial:-

Return to QGIS. Add the westminster_const_region.shp file if necessary

  1. Press the Add Delimitated Text file button, and select the .csv export of the cleansed electoral data
  2. The two options I changed from the default settings are:-
  • First record contains field names
  • No geometry (attribute only table)
QGIS - Create layer from text file

QGIS – Create layer from text file

Step 3 – Joining the data

Joining the polygons in westminster_const_region.shp to the data imported from the Results_Cleansed spreadsheet will allow the data to be presented in a spatial and visual format which will be much easier to interpret, allow for spatial analysis and also give the viewer an idea of the geographic spread. Using QGIS’ Join function will hopefully save a lot of copying and pasting!

Right click on westminster_const_region.shp and select Properties to open the Properties dialog

  • Select the Joins button from the left panel
  • Join Layer – the layer that you want to join to
  • Join Field – the field that you want to join to
  • Target Field – the field in this layer that contains the matching data
QGIS - Add vector layer

QGIS – Add vector layer

The join will now appear in the layer’s Joins list:-

QGIS layer properties

QGIS layer properties

The attribute table will now show the combined  data for both layers:-

QGIS attribute table

QGIS attribute table

This data can now be used to create a thematic map that colours each constituency according to party that won the seat in 2010.

I won’t go through all the steps of creating a thematic map as an earlier tutorial does this.

I’ve used the same colours that the different parties in the UK use:-

QGIS Layer properties

QGIS Layer properties

The thematic map shows the results across the entire UK. It is easy to identify patterns in the result, for example

  • The Liberal Democrats mostly won seats in Scotland, the North East, Wales and South West.
  • There is strong Labour support in South West Scotland, North West England, West Midlands, South Wales, London, Liverpool and Manchester.
  • The Conservative support covers much of the rest of England, especially South East England, excluding London.
2010 election results map

2010 election results map


Using a GPS dongle with QGIS (Linux)

Because I had this GPS dongle laying on my table, I figured I had to find out how to connect this via usb or bluetooth to my Debian Laptop so I could use it with QGIS. Read the full article here www.zuidt.nl.

Shapeburst fill styles in QGIS 2.4

With QGIS 2.4 getting closer (only a few weeks away now) I’d like to take some time to explore an exciting new feature which will be available in the upcoming release… shapeburst fills!

As a bit of background, QGIS 2.2 introduced a gradient fill style for polygons, which included linear, radial and conical gradients. While this was a nice feature, it was missing the much-requested ability to create so-called “buffered” gradient fills. If you’re not familiar with buffered gradients, a great example is the subtle shading of water bodies in the latest incarnation of Google maps. ArcGIS users will also be familiar with the type of effects possible using buffered gradients.

Gradient fills on water bodies in Google maps

Gradient fills on water bodies in Google maps

Implementing buffered gradients in QGIS originally started as a bit of a challenge to myself. I wanted to see if it was possible to create these fill effects without a major impact on the rendering speed of a layer. Turns out you can… well, you can get pretty close anyway. (QGIS 2.4’s new multi-threaded responsive rendering helps a lot here too).

So, without further delay, let’s dive into how shapeburst fills work in QGIS 2.4! (I’ve named this fill effect ‘shapeburst fills’, since that’s what GIMP calls it and it sounds much cooler than ‘buffered gradients’!)

Basic shapeburst fills

For those of you who aren’t familiar with this fill effect, a shapeburst fill is created by shading each pixel in the interior of a polygon by its distance to the closest edge. Here’s how a lake feature polygon looks in QGIS 2.4 with a shapeburst from a dark blue to a lighter blue colour:

A simple shapeburst fill from a dark blue to a lighter blue

A simple shapeburst fill from a dark blue to a lighter blue

You can see in the image above that both polygons are shaded with the dark blue colour at their outer boundaries through to the lighter blue at their centres. The screenshot below shows the symbol settings used to create this particular fill:

A simple shapeburst fill from a dark blue to a lighter blue

Creating a simple shapeburst fill from a dark blue to a lighter blue

Here we’ve used the ‘Two color‘ option, and chosen our shades of blue manually. You can also use the ‘Color ramp’ option, which allows shading using a complex gradient containing multi stops and alpha channels. In the image below I’ve created a red to yellow to transparent colour ramp for the shapeburst:

Colour ramp shapeburst with alpha channels

Colour ramp shapeburst with alpha channels

Controlling shading distance

In the above examples the shapeburst fill has been drawn using the whole interior of the polygon. If desired, you can change this behaviour and instead only shade to a set distance from the polygon edge. Let’s take the blue shapeburst from the first example above and set it to shade to a distance of 5 mm from the edge:

Shapeburst fills can shade to a set distance only

Shapeburst fills can also shade to a set distance from the polygon’s exterior

This distance can either be set in millimetres, so that it stays constant regardless of the map’s scale, or in map units, so that it scales along with the map. Here’s what our lake looks like shaded to a 5 millimetre distance:

Shading to 5mm from the lake's edge

Shading to 5mm from the lake’s edge

Let’s zoom in on a portion of this shape and see the result. Note how the shaded distance remains the same even though we’ve increased the scale:

Zooming in maintains a constant shaded distance

Zooming in maintains a constant shaded distance

Smoothing shapeburst fills

A pure buffered gradient fill can sometimes show an odd optical effect which gives it an undesirable ‘spiny’ look for certain polygons. This is most strongly visible when using two highly contrasting colours for the fill. Note the white lines which appear to branch toward the polygon’s exterior in the image below:

Spiny artefacts on a pure buffered gradient fill

Spiny artefacts on a pure buffered gradient fill

To overcome this effect, QGIS 2.4 offers the option to blur the results of a shapeburst fill:

Blur option for shapeburst fills

Blur option for shapeburst fills

Cranking up the blur helps smooth out these spines and results in a nicer fill:

Adding a blur to the shapeburst fill

Adding a blur to the shapeburst fill

Ignoring interior rings

Another option you can control for shapeburst fills is whether interior polygon rings should be ignored. This option is useful for shading water bodies to give the illusion of depth. In this case you may not want islands in the polygon to affect their surrounding water ‘depth’. So, checking the ‘Ignore rings in polygons while shading‘ option results in this fill:

Ignoring interior rings while shading

Ignoring interior rings while shading

Compare this image with the first image posted above, and note how the shading differs around the small island on the polygon’s left.

Some extra bonuses…

There’s two final killer features with shapeburst fills I’d like to highlight. First, every parameter for the fill can be controlled via data defined expressions. This means every feature in your layer could have a different start and end colour, distance to shade, or blur strength, and these could be controlled directly from the attributes of the features themselves! Here’s a quick and dirty example using a random colour expression to create a basic ‘tint band‘ effect:

Using a data defined expression for random colours

Using a data defined expression for random colours

Last but not least, shapeburst fills also work nicely with QGIS 2.4’s new “inverted polygon” renderer. The inverted polygon renderer flips a normal fill’s behaviour so that it shades the area outside a polygon. If we combine this with a shapeburst fill from transparent to opaque white, we can achieve this kind of masking effect:

Creating a smooth exterior mask using the "inverted polygons" renderer

Creating a smooth exterior mask using the “inverted polygons” renderer

This technique plays nicely with atlas prints, so you can now smoothly fade out the areas outside of your coverage layer’s features for every page in your atlas print!

All this and more, coming your way in a few short weeks when QGIS 2.4 is officially released…

Toner-lite styles for QGIS

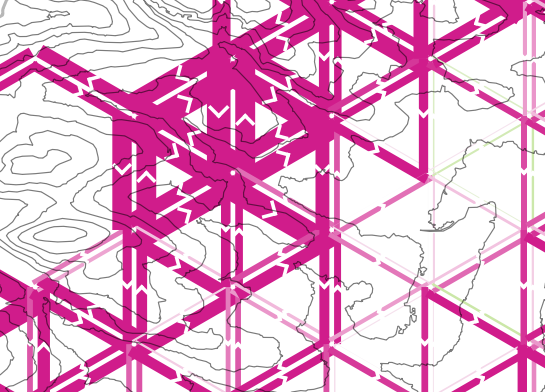
In my opinion, Stamen’s Toner-lite map is one of the best background maps to use together with colorful overlays. The only downsides of using it in QGIS are that the OpenLayers plugin can not provide the tiles at print resolution and that the projection is limited to Web Mercator. That’s why I’ve started to recreate the style for OSM Spatialite databases:

toner-lite

So far, there are styles for lines and polygons and they work quite well for the scale range between 1:1 and 1:250000. As always, you can download the styles from QGIS-resources on Github.


Getting started with QGIS

QGIS is a Free and Open Source Software, developed by a growing community of individuals and organisations.

Installation

You can download the latest version of QGIS from here. On that page, you can find the appropriate QGIS installation package for your operating system.

If you are a MS Windows user, you have 2 options: the standalone installer or the OSGeo4W installer, each of which has its own strengths:

  • OSGeo4W Installer Strengths
    • Access to the "master" (development) version of QGIS which means you can make use of the latest (yesterday's) cutting-edge features
    • Access to QGIS-Server (which allows you to publish your maps through a Web Mapping Service)
  • Standalone Installer Strengths
    • Simplest method of installation

Starting QGIS

Once you finish installing QGIS, you can find its icon on your desktop and/or Start menu. Launch QGIS and wait for the application to start. If you're a MS Windows user, QGIS might take some time to start up for the first time but subsequent loads will be much faster.
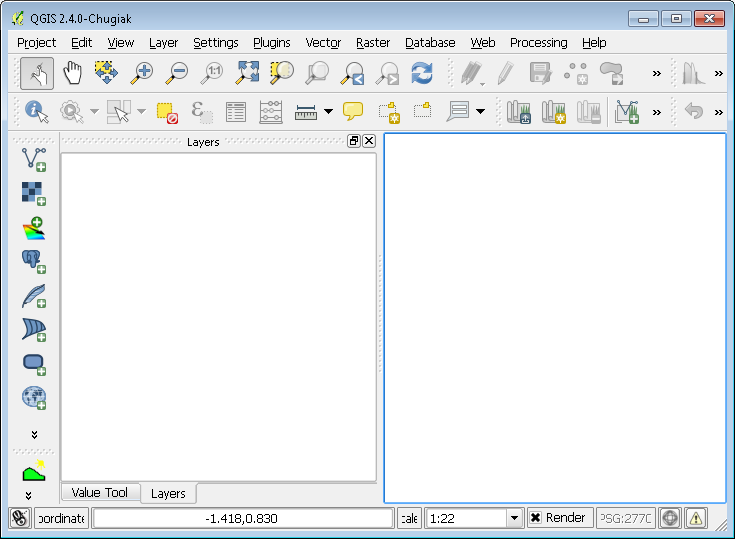
QGIS Start page

Arranging tool-bars

QGIS features a number of tool-bars. You can move them around by clicking and dragging the vertical or horizontal dotted bars separating the tool-bars (for example, the bar to the left of the help tool's icon in the image above).

Setting the Coordinate Reference System (CRS)

It is recommended to set the Coordinate Reference System (CRS) for your project before adding any data. CRS or SRS is a coordinate-based local, regional or global system used to locate geographical entities. Many CRSs are available and each is suited to a particular area of the globe. There is a comprehensive list of CRS codes available here. In this example, we will set the CRS to match the British National Grid coordinate reference system. The easiest way to search for a specific CRS is using its unique EPSG code. The EPSG code for British National Grid is 27700.

To set the CRS for your projects in QGIS, from the main menu, select Settings > Options. A new window will appear. Select CRS tab.
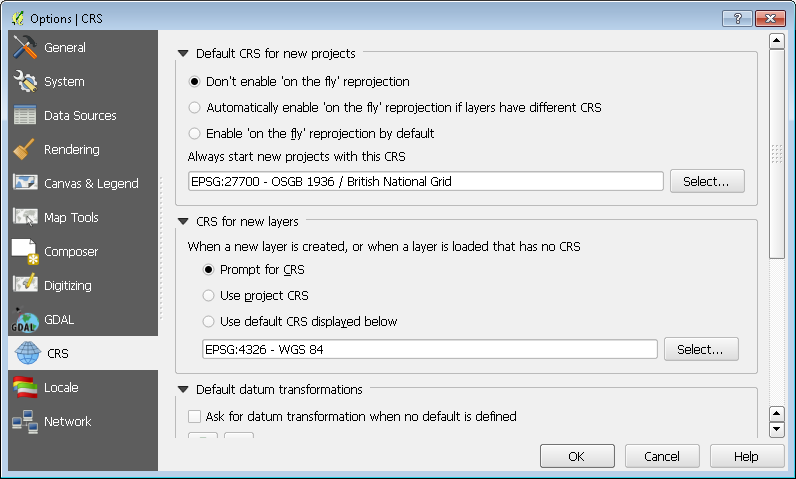
QGIS Options

CRS list

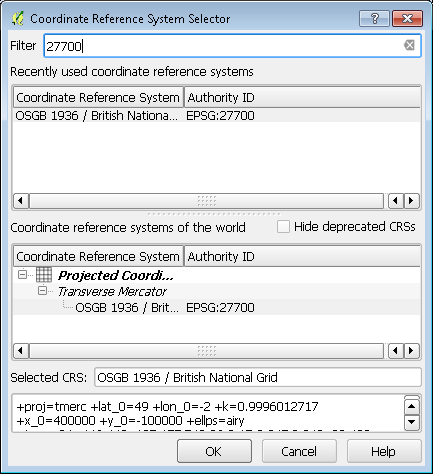
In the Search section, set Authority to "EPSG" and Search for to "ID". Type 27700 into the search box and click Find. Highlight the correct row in Coordinate Reference System section and click OK.

Adding data

GIS data is usually in either raster or vector format. QGIS supports a large number of GIS data formats through the GDAL/OGR library and other plugins. In the example below we will download and add some OS OpenData™ raster and vector datasets into QGIS.

Raster

Ordnance Survey released a number of OS OpenData raster datasets to the public under a very permissive license. You can download the data from here.

For this particular example, follow this link and browse to OS Street View®. Select SX from the map. Move towards the bottom of the page and click next. Fill in the required information and click continue. You should receive an email with a link to download osstvw_sx.zip (note: it is a 383.9 MB file - you can order a DVD instead if you have a slow internet connection). Once the download has finished, unzip the file. You should now have a new folder called OS Street View SX which contains 2 subfolders and a readme file.

Browse to Street View SX > data > georeferencing files > tfw. Select all the TFW files and move them to the Street View SX > data > sx folder. The TFW files contain georeferencing information describing the location of each TIF file.

In QGIS, from the main menu, select Layer > Add Raster Layer... and browse to the Street View SX > data > sx folder. Select sx99nw.tif, sx99ne.tif, sx99sw.tif and sx99se.tif. Click Open. You should now be able to see the raster tiles in the QGIS canvas and the Layers panel at the left side of the screen.

Raster files do not always contain CRS information. We can easily organise the layers and assign the correct CRS (EPSG:27700) with the help of groups. Create a new group by right-clicking on the blank space (not on the sx99 layers) in the Layers panel and selecting Add group. Set the name of the group to OS Street View. Next, move the sx99 layers into the new group by selecting them all and dragging them into the OS Street View group. Once all the sx99 layers are inside the OS Street View group, right-click on the group and select Set group CRS. A new dialog, similar to that seen in the Setting the CRS chapter will appear. Assign the British National Grid CRS (EPSG:27700) and click OK.
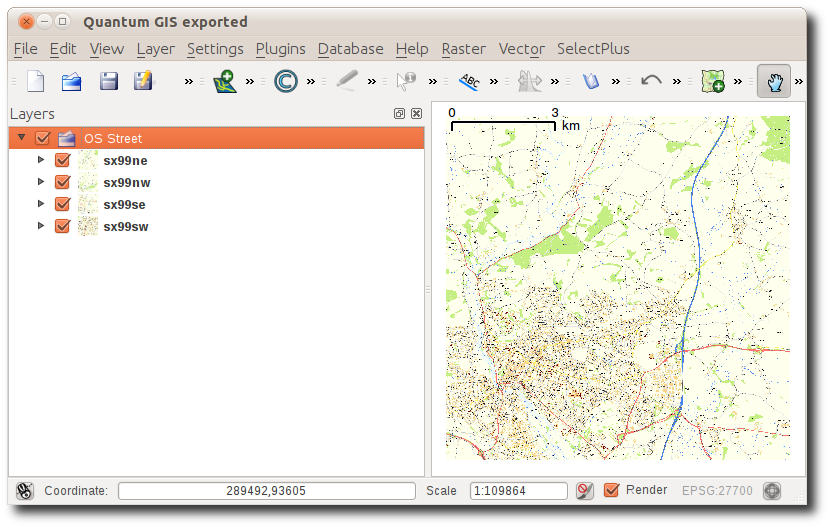
QGIS raster

Vector

Next, we'll bring some vector data into QGIS. Go to the OS OpenData Supply page and browse to OS VectorMap™ District (there are two OS VectorMap datasets on this page, for this example, ensure you select the vector version and not the raster version) and select SX from the map. Scroll to the bottom of the page and click next. Fill in the required information and click continue. Download vmdvec_sx.zip from the link you'll receive by email. Extract the contents of the ZIP file.

In QGIS, from the main menu, select Layer > Add Vector Layer... and browse to the OS VectorMap District (Vector) SX > data > SX. Select SX_Airport.shp, SX_RailwayTrack.shp and SX_Road.shp. Click Open. Click Open again.

To change the style of a vector layer, right-click on the layer in the Layers panel and select Properties. In the Style tab of the Layer Properties dialog, you can define exactly how the layer should look.
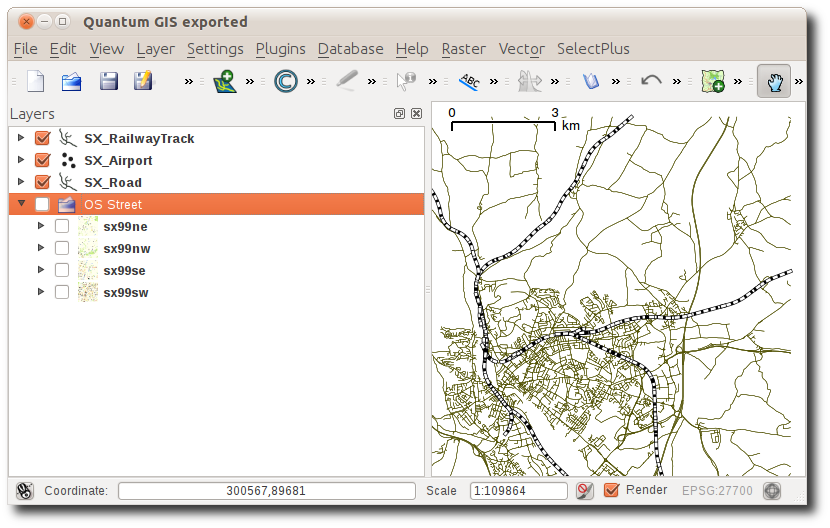
QGIS vector

Other Data

Internet based mapping can also be brought into QGIS, for example, a plugin exists that allows OpenStreetMap, Google, Bing and Yahoo maps to be added to QGIS.

Web map services (WMS) are another source of mapping data. In the next we'll add a WMS layer provided by British Geological Survey to our map. Please read the BGS WMS Terms of use. Another example of WMS is Ordnance Survey's OS OnDemand service. If you have OS OnDemand license, you can follow the instructions on Ordnance Survey's website (sorry, link no longer works) to add other useful WMS layers.

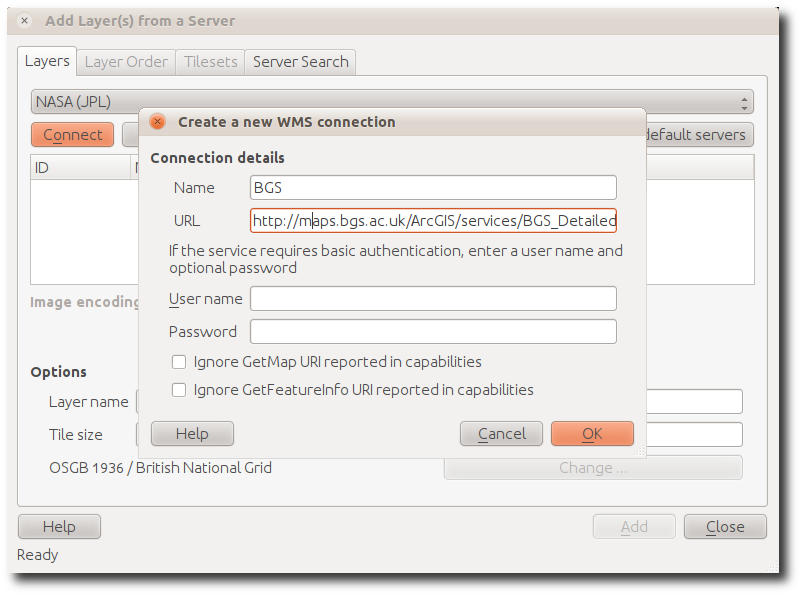
To add the BGS WMS, select Layer > Add WMS Layer... from the main menu. The Add Layer(s) from a Server dialog will appear. Click New.
wms add

Set the name to BGS and set the URL to the following:

http://maps.bgs.ac.uk/ArcGIS/services/BGS_Detailed_Geology/MapServer/WMS...

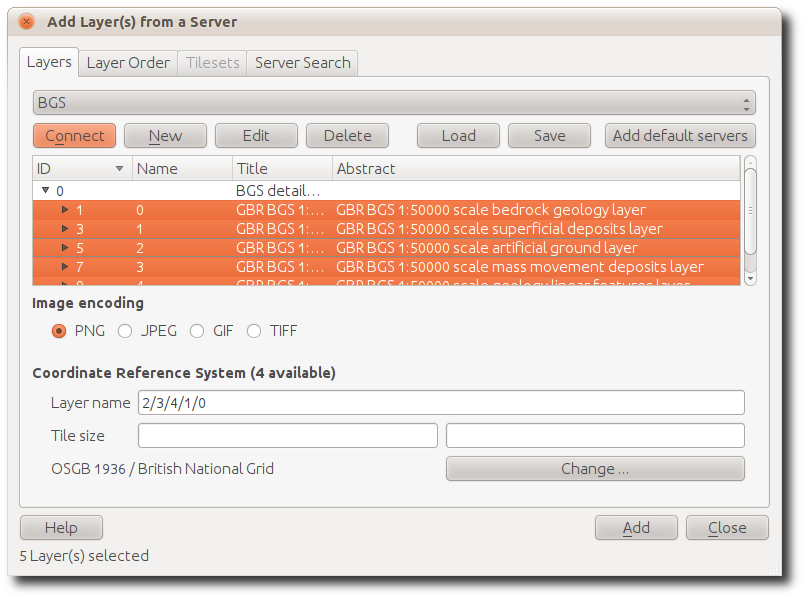
Click OK, and in the Add Layer(s) from a Server dialog, click Connect.
wms add layer

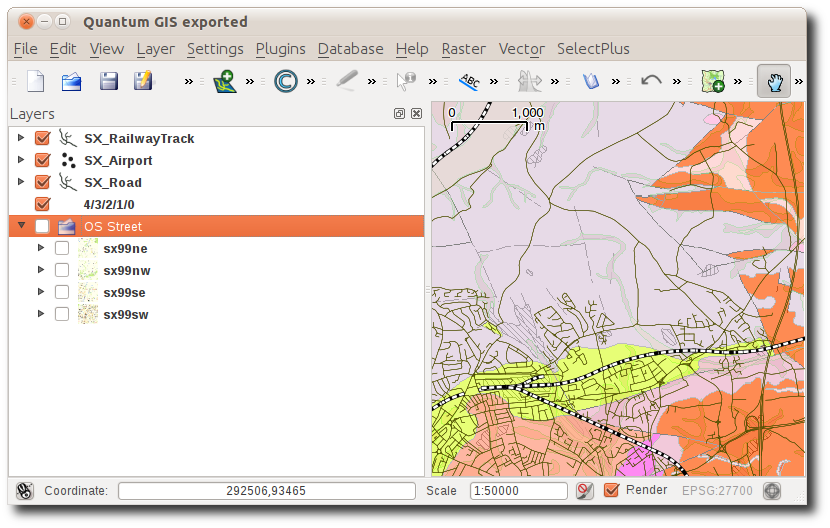
Select all the layers and click Add. Close the Add Layer(s) from a Server dialog. The BGS layer should become visible as you zoom-in to a scale of 1:50000 or closer. Alternatively, you can manually set the Scale in the status bar to 1:50000 and the BGS layer will appear.
wms BGS

Plugins

QGIS is written in a manner that makes it possible for anyone it extend its functionality through the use of plugins. As a result, there are many plugins available to the user, making QGIS highly modular and flexible.

Core plugins

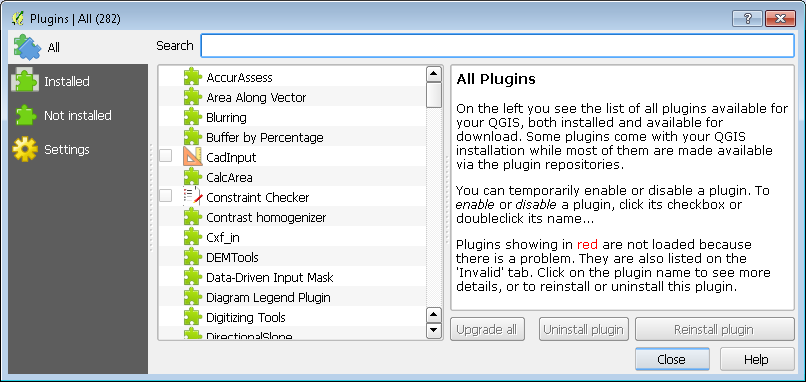
Core plugins are plugins that are shipped with QGIS and can be optionally enabled through the QGIS Plugin Manager.  To access the QGIS Plugin Manager, from the main menu, Select Plugins > Manage Plugins...
qgis core plugins

Select the All tab and type OpenLayers Plugin into the Filter box. Select the plugin and click Install plugin. You should now be able to add OpenStreetMap, Google, Bing and Yahoo maps to your canvas using the Web > OpenLayers plugin menu.
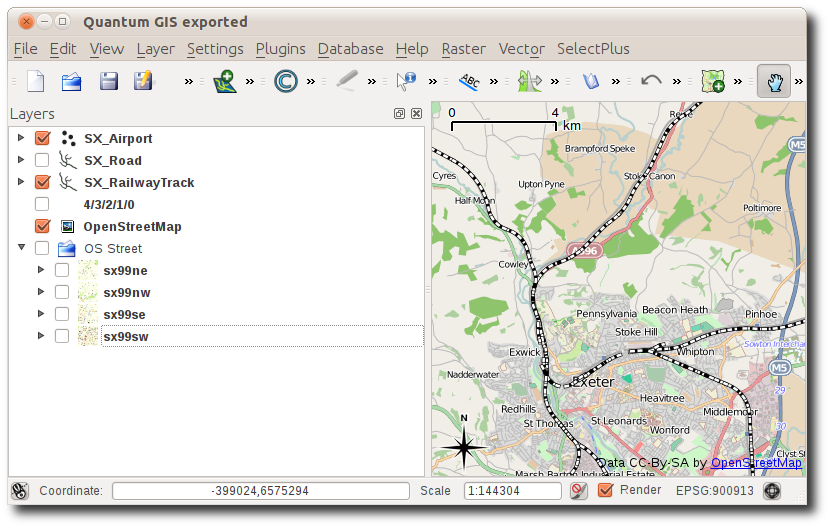
qgis and OpenLayers

Further information

For further help using QGIS, you can always check the manual, user or developer mailing lists or QGIS forum.

If you'd like to master QGIS as quickly as possible, why not attend one of our training courses.

Troubleshooting

Installing OpenLayers Plugin

To install OpenLayers plugin, from the main menu, click Plugins > Manage and Install Plugins.... A new window will appear.

You should be able to search and install the OpenLayers plugin within your list.

Windows Installation

Although you can have different version of QGIS installed under Windows, it's recommended to uninstall old versions before attempting to install new versions.

On rare occasions, some anti-virus software has been known to remove the qgis.exe and python.exe files from the installation folder. If you're having problems running the QGIS shortcut, please ensure those 2 files exist in the installation folder.

If QGIS cannot find your Python folder, you may need to set the PYTHONPATH environment variable to your QGIS folder (\QGIS\apps\python).

Access to internet

To be able to access WMS, WFS and 3rd party plugins, you'll need to have internet access. In the event that you're behind a proxy server, you can enter the proxy server details in Settings > Options > Network:
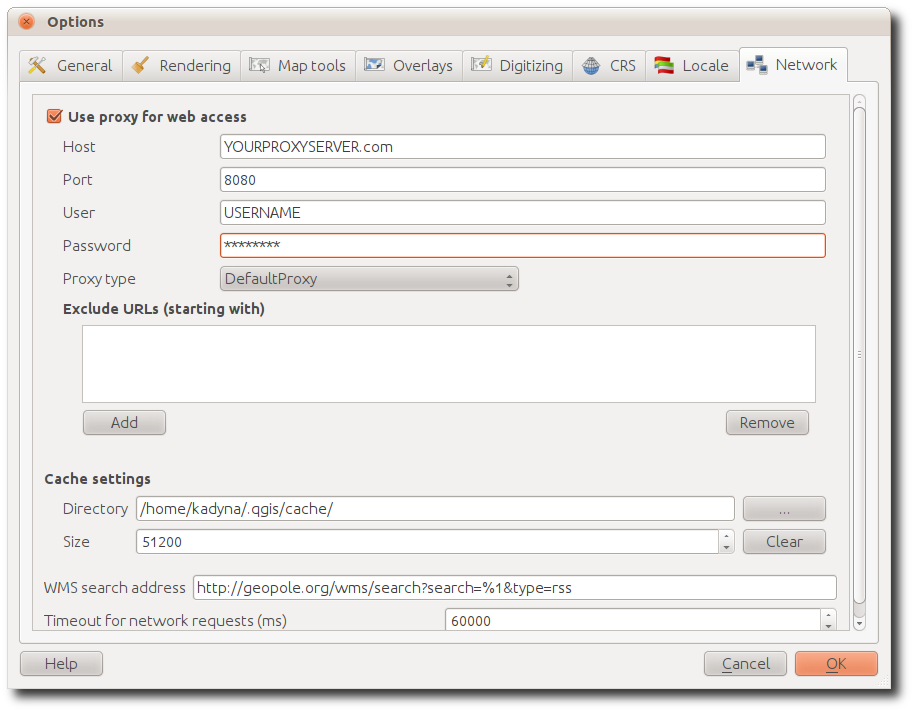
qgis proxy

You may also like...

Mergin Maps, a field data collection app based on QGIS. Mergin Maps makes field work easy with its simple interface and cloud-based sync. Available on Android, iOS and Windows. Screenshots of the Mergin Maps mobile app for Field Data Collection
Get it on Google Play Get it on Apple store

Packaging PostGIS dev releases with Docker

Packaging PostGIS dev releases with Docker

We recently added support for GML curves to PostGIS, which enables TinyOWS to deliver WFS requests with curve geometries. More on this in a later post. This enhancement is in the current PostGIS developement version (SVN master) and not released yet. To enable our customer testing this functionality, we had to build packages for their server environment which is Ubuntu Precise with UbuntuGIS repositories. After working with Linux LXC containers and it's predecessor VServer for years, Docker was a logical choice for a clean reproducible build environment.

Rebuilding a Debian package is usually quite easy:

apt-get build-dep <package>
apt-get source <package>
cd <packagedir>
#Make your changes
dch -i
dpkg-buildpackage

But getting build dependencies for PostGIS currently fails with libssl-dev conflicts, maybe because the dev packages got out of sync after the recent Heartblead updates. So the Dockerfile uses equivs to build a dummy package which satisfies the dependencies.

The command

docker run -v /tmp:/pkg sourcepole/postgis-svn-build-env sh -c 'cp /root/*postgis*.deb /pkg'

loads the Docker image with packages built from the latest SVN version of PostGIS in /root and copies the deb files from the containter into /tmp.

Now we're ready to install these packages on the Ubuntu server:

sudo dpkg -i /tmp/*postgis*.deb

Thats it. Feedback welcome!

@PirminKalberer

P.S.

If you happen to be a developer, then you may prefer running a cutting-edge version of PostGIS in a Docker container instead of building packages. Our colleagues from Oslandia just published how to do this.

„Geo For All“ - neue Technologien für eine Welt im Wandel

GEOSummit 2014, Bern

„Geo for all“ ist nicht nur das Motto der weltumspannenden ICA-OSGeo Lab Initiative zur Förderung der GIS-Ausbildung an Hochschulen, sondern steht allgemein für den immer breiteren Zugang zu professionellen GIS-Werkzeugen. Im Kartenbereich haben Produkte wie TileMill oder D3.js, sowie Dienste wie CartoDB, GeoCommons, usw. den Anwenderkreis weit über das klassische GIS-Fachbebiet hinaus erweitert. Im Vortrag werden einige herausragende Beispiele vorgestellt und deren Relevanz für die Fachwelt erläutert.

@PirminKalberer

Links:

QGIS Needs You! Help make QGIS 2.4 better

QGIS is now in feature freeze for the 2.4 release, that means no more features are going in and we need to focus on fixing any outstanding issues that are still hanging around before the release. 2.4 is going to be a good release, adding cool things like: multithreaded rendering; legend code refactor; colour blind previews; and a whole heaps of other cool stuff. We need your help finding and squashing bugs. This is where you come in.

Finding bugs

Grab the RC builds of QGIS from the downloads page. If you are on Windows I would recommand grabbing the OSGeo4W installer and installing the package called qgis-dev using the Advacned option. A new build will show up nighly and you can test the lastest version.

If you find a bug you need to log it at hub.qgis.org, if you don't we can't fix it. Don't post a tweet about it and hope that we pick it up because we may not, this happened recently and the person didn't file tickets when I asked them too and now it's forgotten.

We track everything at hub.qgis.org. We close tickets as we fix them so keep an eye out for ones that you open. Remember to always add as much information as possible, and answer questions if asked. We are aware that everyone is busy, as are we, however if you don't responed it can be hard to track down issues at times. It can take a bit of time to get used to what is a good or a bad ticket but it doesn't take long. Next time you see a bug file it at hub.qgis.org.

Squashing bugs

This is where the help really matters and is the best thing you can do for the project. If you're a developer and keen to try your hand at some bugfixing you can find the most important ones here.

Not a developer?

The next best thing you can do is fund some bug fixing. There are many ways to do this and this is the most effective way to get stuff done.

Your main options are:

  • Donation to the QGIS fund - we use some of this money to pay for bug fixing.
  • Hire a developer directly. This is a good way to go as it is focused development. You can find some of the devs here
  • Rob a bank and send the money to us - No!11! Don't do that.
  • Encourage your company - who maybe is now saving a lot of money - to sponser or hire a developer.
  • Run a user group and charge a small fee to donate to the project - minus costs of course.

It's not just code.

There is more to QGIS then code and some application at the other end. With each release comes other non developer work.

These things include:

  • Updating the manual
  • Updating translations
  • Helping with PR stuff like posters
  • Ticket clean up

If you're not in a position to help in the other areas of the project these things need love to so don't forget you can help here.

We love that QGIS is free, that it opens GIS to a whole range of people who would never have been able to use it. It's a great feeling. It's also a great feeling when others get invovled and help us along to make it better for everyone.

  • <<
  • Page 76 of 142 ( 2821 posts )
  • >>

Back to Top

Sustaining Members