Oprichting QGIS Gebruikersgroep Nederland
Sorry, this entry is only available in Dutch.
Sorry, this entry is only available in Dutch.
Am Donnerstag 14. November findet der PostGIS Day in Zürich statt! Neben topaktuellen News zu den Releases von PostGIS 3, QGIS 3.10 LTR und OpenLayers 6 gibt es Einblicke in die Responsive City Strategie der Stadt Zürich und weitere Themen wie Datentransformationen mit hale studio und Vektor Tiles.
Recently, staff at North Road have been hard at work on our SLYR “ESRI to QGIS compatiblity suite“, and we thought it’s time to share some of the latest exciting updates with you.
While SLYR begun life as a simple “LYR to QGIS conversion tool”, it quickly matured into a full ArcGIS compatibility suite for QGIS. Aside from its original task of converting ESRI LYR files, SLYR now extends the QGIS interface and adds seamless support for working with all kinds of ArcGIS projects and data files. It’s rapidly becoming a must-have tool for any organisation which uses a mix of ESRI and open source tools, or for any organisation exploring a transition away from ArcGIS to QGIS.
Accordingly, we thought it’s well past time we posted an update detailing the latest functionality and support we’ve added to SLYR over the past couple of months! Let’s dive in…


(*requires QGIS 3.10 or later)
Over the remainder of 2019, we’ll be hard at work further improving SLYR’s support for MXD document conversion, and adding support for automatic conversion of ArcMap print layouts to QGIS print layouts.
While SLYR is not currently an open-source tool, we believe strongly in the power of open source software, and accordingly we’ve been using a significant portion of the funds generated from SLYR sales to extend the core QGIS application itself. This has directly resulted in many exciting improvements to QGIS, which will become widely available in the upcoming QGIS 3.10 release. Some of the features directly funded by SLYR sales include:
You can read more about our SLYR ESRI to QGIS compatibility tool here, or email [email protected] to discuss licensing arrangements for your organisation! Alternatively, send us an email if you’d like to discuss your organisations approach to open-source GIS and for assistance in making this transition as painless as possible.
PT | EN
As I was preparing a QGIS Project to read a database structured according to the new rules and technical specifications for the Portuguese Cartography, I started to configure the editing forms for several layers, so that:
Basically, I wanted something like this:
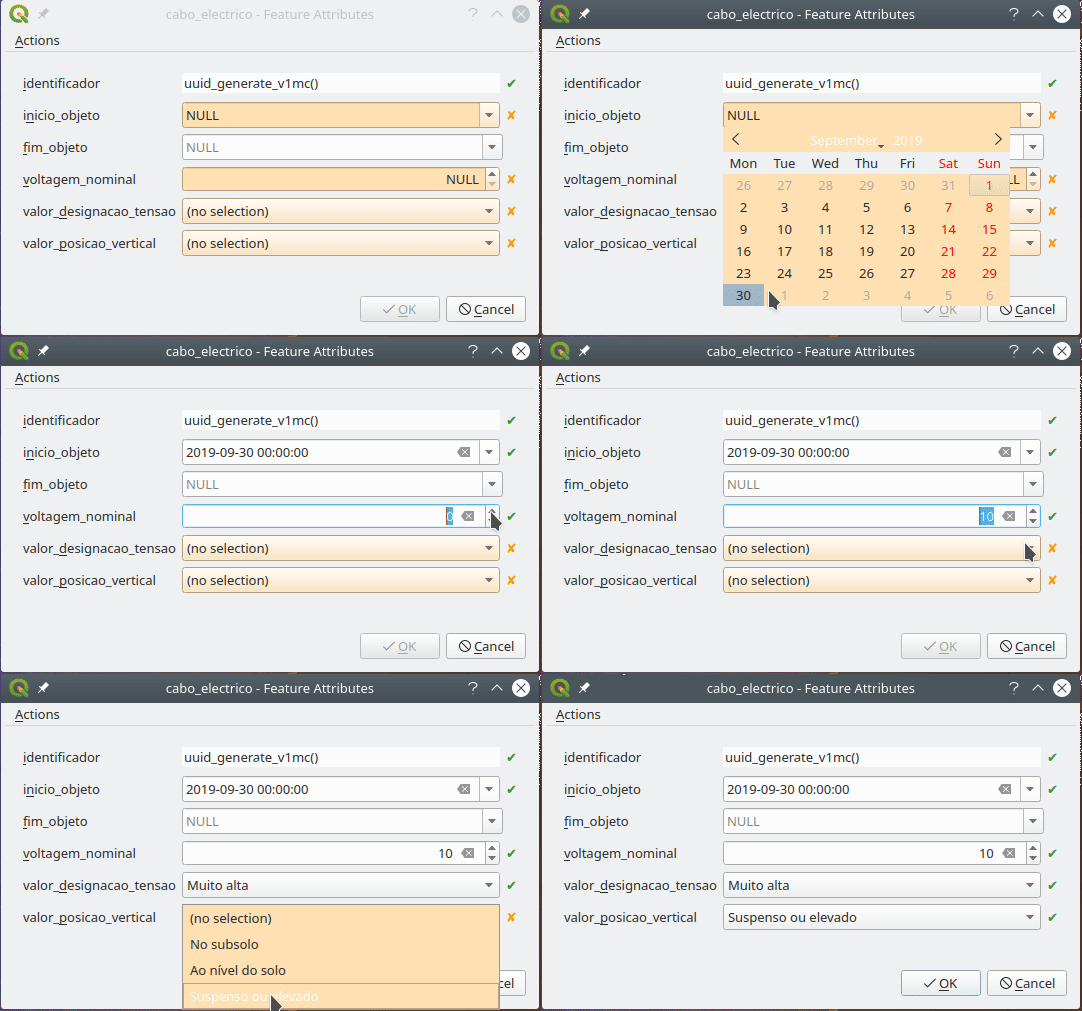
Let me say that, in PostGIS layers, QGIS does a great job in figuring out the best widget to use for each field, as well as the constraints to apply. Which is a great help. Nevertheless, some need some extra configuration.
If I had only a few layers and fields, I would have done them all by hand, but after the 5th layer my personal mantra started to chime in:
“If you are using a computer to perform a repetitive manual task, you are doing it wrong!”
So, I began to think how could I configure the layers and fields more systematically. After some research and trial and error, I came up with the following PyQGIS functions.
The identifier field (“identificador”) is automatically generated by the database. Therefore, the user shouldn’t edit it. So I had better make it read only
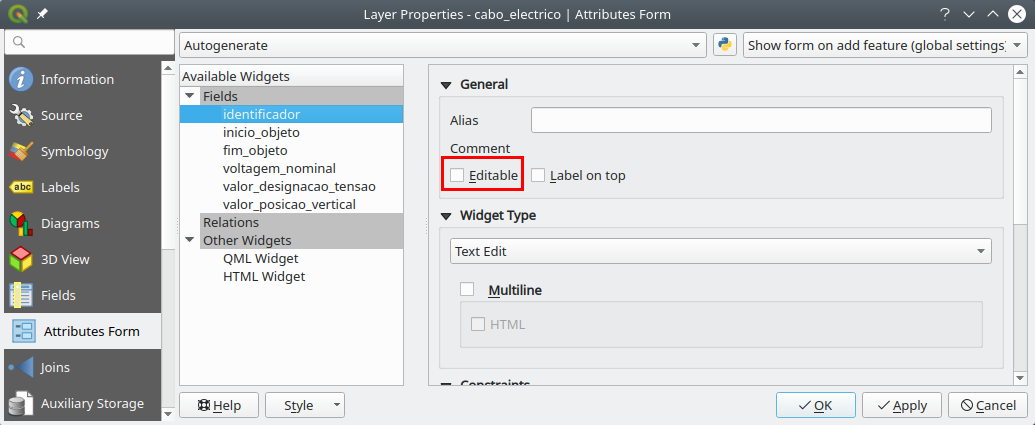
To make all the identifier fields read-only, I used the following code.
def field_readonly(layer, fieldname, option = True):
    fields = layer.fields()
    field_idx = fields.indexOf(fieldname)
    if field_idx >= 0:
        form_config = layer.editFormConfig()
        form_config.setReadOnly(field_idx, option)
        layer.setEditFormConfig(form_config)

# Example for the field "identificador"

project = QgsProject.instance()
layers = project.mapLayers()

for layer in layers.values():
    field_readonly(layer,'identificador')
The date fields are configured automatically, but the default widget setting only outputs the date, and not date-time, as the rules required.
I started by setting a field in a layer exactly how I wanted, then I tried to figure out how those setting were saved in PyQGIS using the Python console:
>>>layer = iface.mapCanvas().currentLayer()
>>>layer.fields().indexOf('inicio_objeto')
1
>>>field = layer.fields()[1]
>>>field.editorWidgetSetup().type()
'DateTime'
>>>field.editorWidgetSetup().config()
{'allow_null': True, 'calendar_popup': True, 'display_format': 'yyyy-MM-dd HH:mm:ss', 'field_format': 'yyyy-MM-dd HH:mm:ss', 'field_iso_format': False}
Knowing this, I was able to create a function that allows configuring a field in a layer using the exact same settings, and apply it to all layers.
def field_to_datetime(layer, fieldname):
    config = {'allow_null': True,
              'calendar_popup': True,
              'display_format': 'yyyy-MM-dd HH:mm:ss',
              'field_format': 'yyyy-MM-dd HH:mm:ss',
              'field_iso_format': False}
    type = 'Datetime'
    fields = layer.fields()
    field_idx = fields.indexOf(fieldname)
    if field_idx >= 0:
        widget_setup = QgsEditorWidgetSetup(type,config)
        layer.setEditorWidgetSetup(field_idx, widget_setup)

# Example applied to "inicio_objeto" e "fim_objeto"

for layer in layers.values():
    field_to_datetime(layer,'inicio_objeto')
    field_to_datetime(layer,'fim_objeto')
In the data model, many tables have fields that only allow a limited number of values. Those values are referenced to other tables, the Foreign keys.
In these cases, it’s quite helpful to use a Value Relation widget. To configure fields with it in a programmatic way, it’s quite similar to the earlier example, where we first neet to set an example and see how it’s stored, but in this case, each field has a slightly different settings
Luckily, whoever designed the data model, did a favor to us all by giving the same name to the fields and the related tables, making it possible to automatically adapt the settings for each case.
The function stars by gathering all fields in which the name starts with ‘valor_’ (value). Then, iterating over those fields, adapts the configuration to use the reference layer that as the same name as the field.
def field_to_value_relation(layer):
    fields = layer.fields()
    pattern = re.compile(r'^valor_')
    fields_valor = [field for field in fields if pattern.match(field.name())]
    if len(fields_valor) > 0:
        config = {'AllowMulti': False,
                  'AllowNull': True,
                  'FilterExpression': '',
                  'Key': 'identificador',
                  'Layer': '',
                  'NofColumns': 1,
                  'OrderByValue': False,
                  'UseCompleter': False,
                   'Value': 'descricao'}
        for field in fields_valor:
            field_idx = fields.indexOf(field.name())
            if field_idx >= 0:
                print(field)
                try:
                    target_layer = QgsProject.instance().mapLayersByName(field.name())[0]
                    config['Layer'] = target_layer.id()
                    widget_setup = QgsEditorWidgetSetup('ValueRelation',config)
                    layer.setEditorWidgetSetup(field_idx, widget_setup)
                except:
                    pass
            else:
                return False
    else:
        return False
    return True

# Correr função em todas as camadas
for layer in layers.values():
    field_to_value_relation(layer)
In a relatively quick way, I was able to set all the project’s layers with the widgets I needed.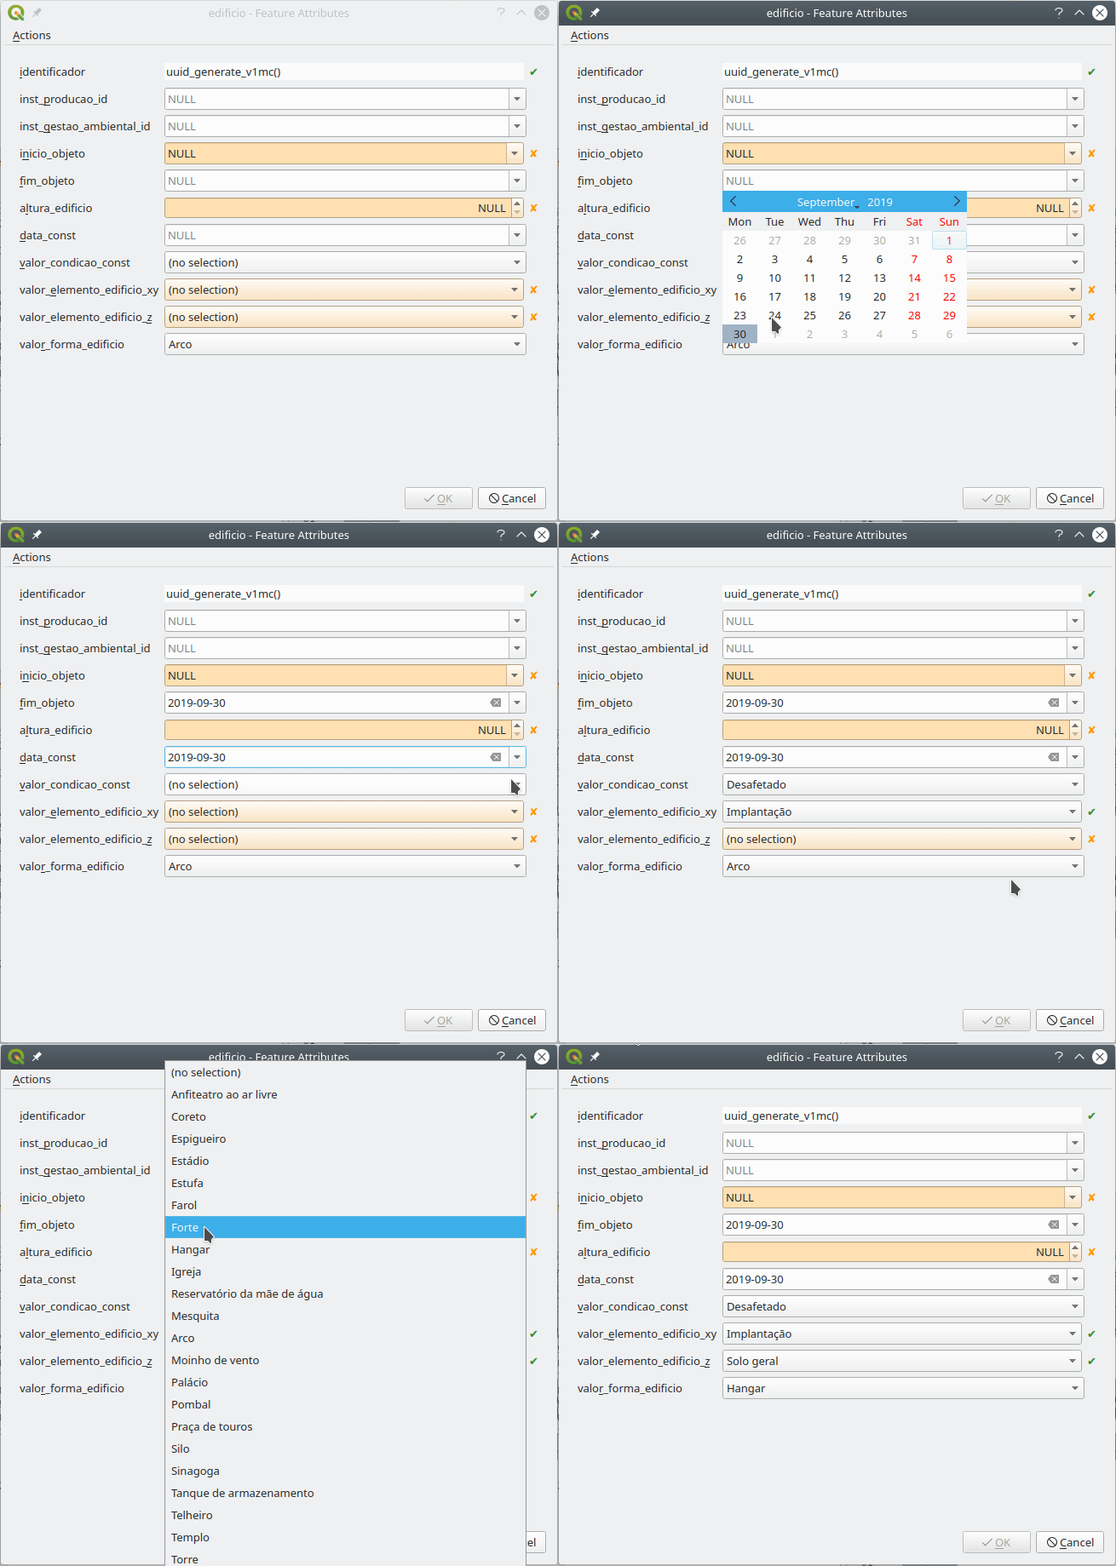
This seems to me like the tip of the iceberg. If one has the need, with some search and patience, other configurations can be changed using PyQGIS. Therefore, think twice before embarking in configuring a big project, layer by layer, field by fields.
QGIS-versioning is a QGIS and PostGIS plugin dedicated to data versioning and history management. It supports :
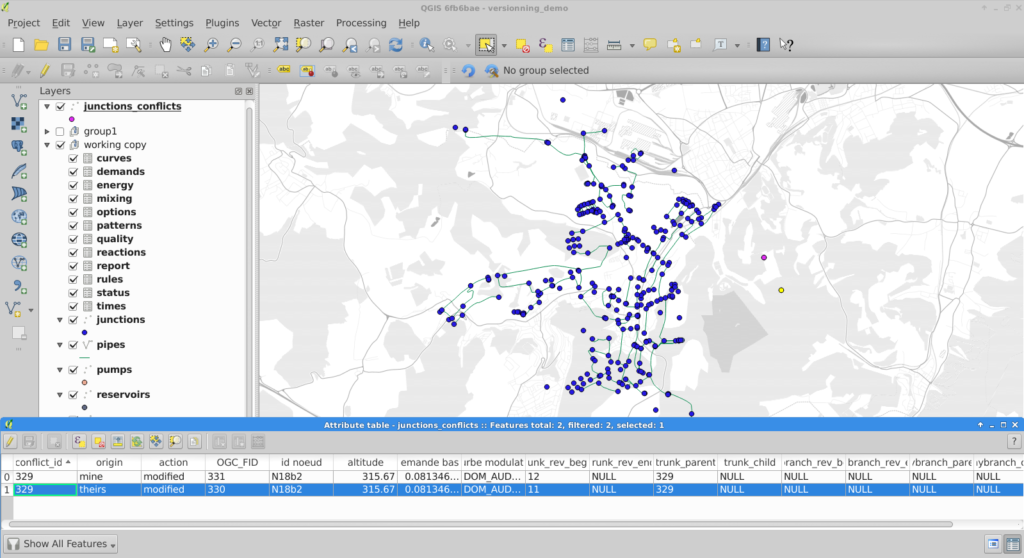
QGIS versioning conflict management
In a previous blog article we detailed how QGIS versioning can manage data history, branches, and work offline with PostGIS-stored data and QGIS. We recently added foreign key support to QGIS versioning so you can now historize any complex database schema.
This QGIS plugin is available in the official QGIS plugin repository, and you can fork it on GitHub too !
When a user decides to historize its PostgreSQL database with QGIS-versioning, the plugin alters the existing database schema and adds new fields in order to track down the different versions of a single table row. Every access to these versioned tables are subsequently made through updatable views in order to automatically fill in the new versioning fields.
Up to now, it was not possible to deal with primary keys and foreign keys : the original tables had to be constraints-free. This limitation has been lifted thanks to this contribution.
To make it simple, the solution is to remove all constraints from the original database and transform them into a set of SQL check triggers installed on the working copy databases (SQLite or PostgreSQL). As verifications are made on the client side, it’s impossible to propagate invalid modifications on your base server when you “commit” updates.
When you choose to historize an existing database, a few fields are added to the existing table. Among these fields, versioning_ididentifies one specific version of a row. For one existing row, there are several versions of this row, each with a different versioning_id but with the same original primary key field. As a consequence, that field cannot satisfy the unique constraint, so it cannot be a key, therefore no foreign key neither.
We therefore have to drop the primary key and foreign key constraints when historizing the table. Before removing them, constraints definitions are stored in a dedicated table so that these constraints can be checked later.
When the user checks out a specific table on a specific branch, QGIS-versioning uses that constraint table to build constraint checking triggers in the working copy. The way constraints are built depends on the checkout type (you can checkout in a SQLite file, in the master PostgreSQL database or in another PostgreSQL database).
That’s where the fun begins ! The first thing we have to check is key uniqueness or foreign key referencing an existing key on insert or update. Remember that there are no primary key and foreign key anymore, we dropped them when activating historization. We keep the term for better understanding.
You also have to deal with deleting or updating a referenced row and the different ways of propagating the modification : cascade, set default, set null, or simply failure, as explained in PostgreSQL Foreign keys documentation .
Nevermind all that, this problem has been solved for you and everything is done automatically in QGIS-versioning. Before you ask, yes foreign keys spanning on multiple fields are also supported.
You will get a new message you probably already know about, when you try to make an invalid modification committing your changes to the master database

Error when foreign key constraint is violated
One existing Qgis-versioning feature is partial checkout. It allows a user to select a subset of data to checkout in its working copy. It avoids downloading gigabytes of data you do not care about. You can, for instance, checkout features within a given spatial extent.
So far, so good. But if you have only a part of your data, you cannot ensure that modifying a data field as primary key will keep uniqueness. In this particular case, QGIS-versioning will trigger errors on commit, pointing out the invalid rows you have to modify so the unique constraint remains valid.

Error when committing non unique key after a partial checkout
There is a lot to check when you intend to replace the existing constraint system with your own constraint system based on triggers. In order to ensure QGIS-Versioning stability and reliability, we put some special effort on building a test set that cover all use cases and possible exceptions.
There is now no known limitations on using QGIS-versioning on any of your database. If you think about a missing feature or just want to know more about QGIS and QGIS-versioning, feel free to contact us at [email protected]. And please have a look at our support offering for QGIS.
Many thanks to eHealth Africa who helped us develop these new features. eHealth Africa is a non-governmental organization based in Nigeria. Their mission is to build stronger health systems through the design and implementation of data-driven solutions.

After the summer break, we’re back with a new user question.
This month, we want to focus on documentation. Specifically, we’d like to know how you learn how to use QGIS.
The survey is available in English, Spanish, Portuguese, French, Ukrainian, and Indonesian. If you want to help us translate user questions into more languages, please get in touch on the community mailing list!
Thanks to the success of our recent QGIS Print Layouts Graphs and Charts crowdfunding campaign, staff at North Road and Faunalia have been busy updating and improving the QGIS “DataPlotly” plugin with the goal of allowing beautiful charts inside your print layouts.
We’re super-excited to announce that the beta release of this new functionality is now available! With this beta installed, you’ll see a new icon in your QGIS Print Layout designer window:
![]()
Clicking this button will allow you to draw a new plot onto your print layout, just like you would any other standard layout item (like legends, scalebars, etc). Any print layout chart can be customised by right-clicking the chart and selecting “Item Properties“. This will open a panel with settings like position, size, frame, and other standard options. All the magic happens when you click the “Setup Plot” button inside this panel:

This exposes the vast array of styling and charting options available for use. If you’re an existing user of the DataPlotly QGIS plugin, you’ll recognise that these are the same settings you have available when creating interactive plots alongside the main map canvas. Every setting is now available for use in print layouts!

To grab the beta, head over to https://github.com/ghtmtt/DataPlotly/releases/tag/v3.9-beta and download the DataPlotly.zip file. Then, inside QGIS, select the Manage and Install Plugins option from the Plugins menu. Click on the “Install from ZIP” section, and point the dialog at your downloaded DataPlotly.zip file. Click “Install Plugin“, and then restart QGIS for good measure. When QGIS restarts you should see the new chart icon inside the print layout designer.
Note that you’ll need a recent QGIS release for this to work correctly — either QGIS 3.8.3 or 3.4.12. (The print layout functionality may not be compatible with earlier releases, as we’ve had to fix several issues inside QGIS itself to get this feature working as designed!).
We are actively seeking feedback and user testing on this beta release. If you encounter any issues, just head over to https://github.com/ghtmtt/DataPlotly/issues and let us know.
We’ll be further refining this functionality, with the goal of releasing the final non-beta version of the plugin to coincide with the upcoming QGIS 3.10 release.
Happy charting!
 The latest PDAL release (Point Data Abstraction Library, http://www.pdal.io/, version 2.0.1) has now been packaged for Fedora Linux.
I have cleaned up the dependencies (also the annoying former installation bug with PDAL-devel has been resolved).
The installation is as simple as this (the repository is located at Fedora’s COPR):
# enable and install PDAL
sudo dnf copr enable neteler/pdal
sudo dnf install PDAL PDAL-libs PDAL-vdatums

# if you want to compile other software like GRASS GIS with PDAL support, then you also need
sudo dnf install PDAL-devel
# Now, run PDAL:
pdal-config --version
pdal --help
Enjoy!
The post PDAL 2.0.1 packaged for Fedora including vertical datums and grids appeared first on GFOSS Blog | GRASS GIS and OSGeo News.
During FOSS4GUK 2019 in Edinburgh we ran a workshop for collecting data using Input. This is the content of the workshop with all the datasets.
To be able to work with Input, you will need the following:
For the purpose of this workshop, we have prepared a QGIS project. Let’s use that as a starting point:
 icon to create a copy of the project under your own
Mergin account (foss4guk_YOURNAME)
icon to create a copy of the project under your own
Mergin account (foss4guk_YOURNAME)The project you have copied in Mergin, is a QGIS project with various map layers. To see the content of the project in QGIS:
In Mergin, in the top menu, select Projects > My projects
Select foss4guk_YOURUSERNAME (or the name you assigned when copying the project).
In the top menu, click on
the  icon to download the project
Extract the content of the zip file
Alternatively:
The above process can be done through the Mergin plugin for QGIS. To do that:
Install the Mergin plugin in QGIS
Restart QGIS
In the QGIS Browser panel, right-click on Mergin and select Configure
Enter your Mergin username and password
Under My Project, right-click on foss4guk_YOURUSERNAME and select Download
Select a location under which the project will be downloaded to
Once downloaded, select Open to open the project.
Input is based on QGIS, therefore, any layer symbology / styles you set in QGIS, will be displayed in Input. If you are using SVGs (e.g. OS MasterMap), you need to embed these in the QGIS project.
Input also supports most of the edit widgets from QGIS. Edit widgets allow you to simplify filling-in forms with drop-down options, TRUE/FALSE switches, sliders, calendar and time, default values, attachments, value relations and more. To see some of those settings:
From the Layers panel (in QGIS), right-click on the listed buildings (points layer) and open the Properties window.
From the left-hand panel, select Attributes Form. Explore the various widgets assigned to different fields.
For this layer, we have set the Photo field to use an Attachment widget. This will allow Input to make use of your mobile camera to attach photos to features.
For the Surveyor field, we have linked it to an external CSV table, to populate a drop-down option with the names of surveyors.
Input can also use a pop-up window (similar to Google Maps) to display basic information about a single feature:
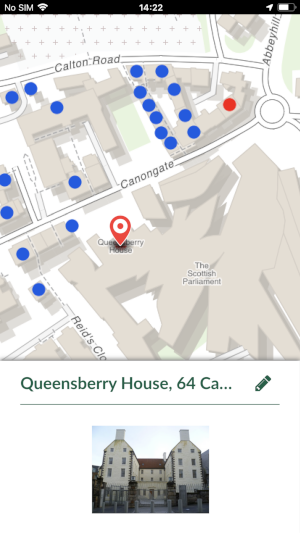
To customise this pop window’s content:
Open the properties table, and select the Display tab
You can see the title is set to ENT_TITLE and there is an image tag referencing the Photo field:
  # image
  file:///[%@project_folder%]/[% "Photo" %]
To simplify handling layer visibility, Input makes use of map themes defined in your QGIS project. In this project, there is a map theme for aerial photo (using a Bing aerial layer) and OpenStreetMap (geopackage).
[]{#anchor-5}Survey layer
In Input, any vector layer (point, line, polygon) can be edited (as long as editing that format is supported in QGIS). This could be very confusing when dealing with large numbers of vector layers in a single project (trying to figure out which one to edit).
Luckily you can set background layers (or those you don’t want to be editable in Input) to read-only:
In QGIS, from the main menu, select Project > Properties
In the new window, select the Data Sources tab from the left-hand panel
Below is the list of layers and their capability settings for the project. Layers not marked as read-only will be shown as survey layers (editable) in Input.
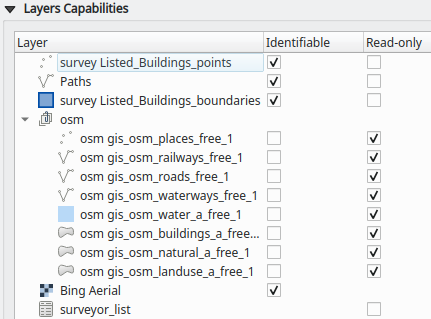
By default, the file paths to layers are relative. You can change that under the General tab of this window.
To use Input, open the app on your device. On its first run, Input will show the Projects page.
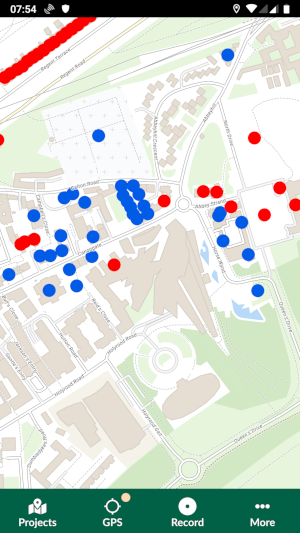
When you open the project, you may not see all layers. This is because some of the layers have zoom-dependant visibility settings (again configured in QGIS).
To switch map themes:
Tap More on the bottom-right side of the screen
Tap Map themes > aerial photo
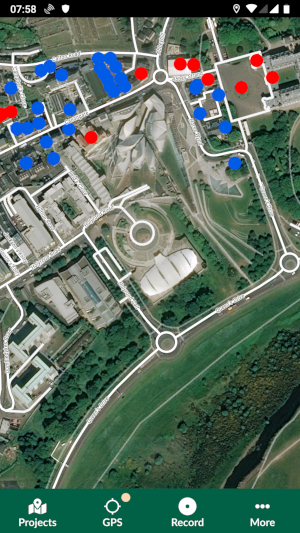
You can also display feature details simply by tapping on them.
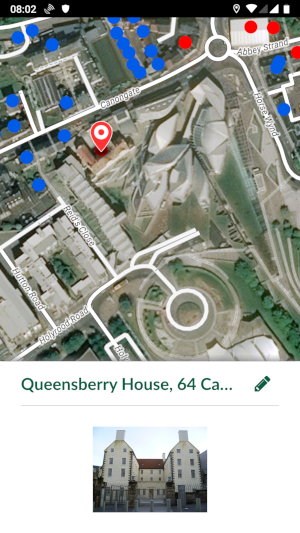
To capture data:
Tap Record
You can then choose the layer in which you want to record your feature, by tapping on the light green band, in the lower part of the screen, above the Input menu.
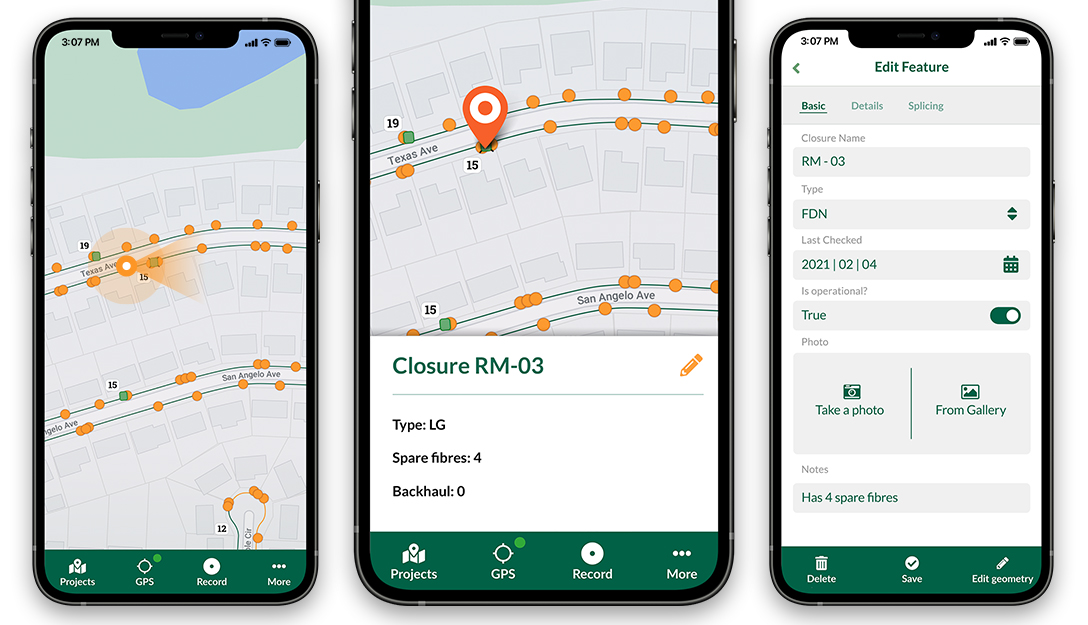
If you are capturing a point, by default, the suggested point to capture will be on your GPS location. You can drag the map to adjust the location of the new point. To switch back to the current GPS location, tap the GPS icon on the bottom-left of your screen.
After adding a point, you will be prompted to fill-in the form.
If you are recording a line or a polygon, you can either add points to define the shape of your feature or press and hold the GPS icon when in Record mode to generate a shape from your GPS track.
You can edit the existing features on your map. For point layers, you can edit geometry and form data. For lines and polygons, you can edit only the form data.
Let’s get out and capture some data for the Path layer!
Once you have made changes to your data, you can upload them back to Mergin:
In Input, tap Projects
Select My projects
Click on the sync/refresh icon to the right of your project
You can now download the project again to your desktop and see the changes in QGIS. Alternatively, you can synchronise the changes you made back to QGIS by using the Mergin plugin for QGIS (described earlier).
In this year Google Summer of Code (GSoC), there is a project involving QGIS 3D. Ismail Sunni as the student with Martin Dobias and Peter Petrik as the mentors have implemented 3D On-Screen Navigation, 3D Measurement Tool and 3D Rendering Point Feature as A Billboard.
You can also learn more about this GSoC project here.
Previously, user could already navigate the 3D world by using mouse and keyboard. Unfortunately, for a new user it is not easy to start using them. 3D On-Screen Navigation will help navigating the 3D world. There are buttons to do zoom in/out, tilt up/down, pan up/down/left/right, and rotate the 3D map view. This feature can be activated from the 3D map view toolbar. See how to use it in this video:
Now you can measure distance in 3D map view with considering the z-value. This tool is available in the 3D map view toolbar. It has the same UI as in 2D measurement tool with the same configuration (rubber band color, unit, decimal place, and keeping the base unit). It also has the same behavior (left-click to add a new point, middle-click to delete the last point, and right-click to restart the measurement). Now you can measure the distance between two building’s top or length of a river in a mountain. See the 3D measurement tool in action:
A new kind of rendering style has been added for point layers. It allows you to show the point with QGIS symbol (e.g. marker, SVG, etc) that always face to the user and always has the same size. You can see sample usage:


Last week, I had the pleasure to give a movement data analysis workshop at the OpenGeoHub summer school at the University of Münster in Germany. The workshop materials consist of three Jupyter notebooks that have been designed to also support self-study outside of a workshop setting. So you can try them out as well!
All materials are available on Github:
Here’s a quick preview of the bird migration data analysis tutorial (click for full size):
You can run all three Jupyter notebooks online using MyBinder (no installations required).
Alternatively or if you want to dig deeper: installation instructions are available on movingpandas.org
The OpenGeoHub summer school this year had a strong focus on spatial analysis with R and GRASS (sometimes mixing those two together). It was great to meet @mdsumner (author of R trip) and @edzerpebesma (author of R trajectories) for what might have well been the ultimate movement data libraries geek fest. In the ultimate R / Python cross-over, @robinlovelace even ported tutorial 0 to Rmd, so it can be run in RStudio: 0_getting_started.Rmd
Both talks and workshops have been recorded. Here’s the introduction:
and this is the full workshop recording:
This post is part of a series. Read more about movement data in GIS.
After a long wait and weeks of development, we finally managed to release Input on iOS platform.
Update: Input app is now available through Apple App Store:
We are pleased to announce the Beta release of Input on iOS TestFlight. To install the app, simply click on this link from your iOS device: https://testflight.apple.com/join/JO5EIywn. This will open a window to first install TestFlight app. After that, you should be able to install Input on your device.
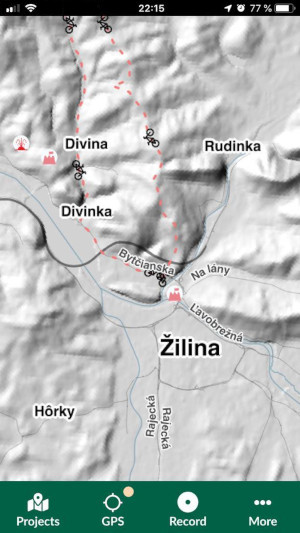
Input is the first QGIS based app to be released for iOS. Using Input, you can open, view and edit your QGIS projects and data on your iPhone/iPad.
For setting QGIS projects, transferring data/projects and capturing data, you can see the documentation here.
In addition to the great works of the QGIS community in the past to port QGIS to Android devices, we had to do major changes to be able to have Input on iOS. Below are the steps we had taken in the past couple of years, to pave the way:
As a first step, we decided to create a new library in QGIS based on Qt Quick for QGIS. This allowed us to easily create platform independent apps for touch devices.
The library has been built on components ported from QField project. In addition, we have been improving the library and added support for new types of edit form widgets. Details of the QGIS Enhancement Proposal for QGIS Quick can be found here.
By providing static data providers, it was possible to compile code of data providers directly into qgis_core library. This was a major step, as iOS does not support dynamic libraries. Details of this QGIS enhancement can be found here.
We will be delighted to hear your suggestions and feedback, mainly critical ones so that we can improve the application and user experience. After ironing out any issues reported during the Beta testing in the TestFlight, we will publish the app to the App Store.
FOSS4G is a gathering of like-minded people from around the world to share their experience with the Open Source GIS software. This year, we had a number of talks, a workshop and a lot of fun!
The event started with the QGIS Developers meeting. We joined the meeting to discuss the upcoming release of QGIS (3.10) and some of the new features and bugs.

We had a workshop on Mesh layer. Participants created animation of the Hurricane Michael in QGIS. Details of the workshop can be found here.
Our first talk was on Input: a QGIS based app for mobile/tablet. During the talk, Saber demonstrated the workflow for setting up a survey project in QGIS and transfer it through the Mergin service to mobile device. Input was then used in a live demo to collect data and synchronise the information back to the server.
You can find the video recording from the talk here
Martin Dobias presented the current state of QGIS 3D and future plans. Martin and Peter Petrik have been mentoring Ismail Sunni for his Google Summer of Code to implement 3D billboard in QGIS. The work was completed and merged to QGIS project recently. Martin demonstrated the new features as the result of the GSoC.
Full presentation can be found here
Mesh layer has been a part of the QGIS for the past year. Peter discussed the improvements made over the recent months. He also gave an overview of the upcoming works to extend the mesh layer to handle 1D and 3D data.
Peter’s talk on mesh layer can be found here
The event was not all about work! We had fun times catching up with friends, partying and running around!
A lot of effort, sleepless nights and sweat went into organising this event. We thank the organisers to make this happen.


Recently, we’ve been working on an exciting development which is coming soon in QGIS 3.10… support for Geospatial PDF exports! This has been a long-desired feature for many QGIS users, and it was only made possible thanks to a group of financial backers (listed below). In this post, we’re going to explore these new features and how they improve your QGIS PDF outputs.
Geospatial PDFs can now be created either by exporting the main QGIS map canvas, or by creating and exporting a custom print layout. For instance, when you select the “Save Map as PDF” option from the main QGIS window, you’ll see a new group of Geospatial PDF related options:

At its most basic, Geospatial PDF is a standard extension to the PDF format which allows for vector spatial datasets to be embedded in PDF files. If the “Include vector feature information” checkbox is ticked when creating a Geospatial PDF output, then QGIS will automatically include all the geometry and attribute information from features visible within the page. So if we export a simple map to PDF, we’ll get an output file which looks just like any old regular PDF map output…

…but, we can also pull this PDF back into QGIS and treat it just like any other vector data source! In the screenshot below we’re using the Identify tool to query on of the polygons and see all the attribute information from the original source layer.

This ability adds a lot of value to PDF exports. Anyone who has ever been supplied a non-spatial PDF as a “spatial dataset” will attest to the frustrations these cause… but if you create proper Geospatial PDFs instead, then there’s no loss of the valuable underlying spatial information or feature attributes! Furthermore, if these PDFs are opened within Acrobat Reader, tools are enabled which allow users to query features interactively.
Another nice benefit which comes with Geospatial PDF output is that layers can be interactively toggled on or off in the PDF viewer. The screenshot below shows a Geospatial PDF file created from a simple QGIS map. On the left we have a list of the layers in the PDF, each of which can be turned on or off inside the PDF viewer!

The really nice thing here is that, thanks to the underlying smarts in the GDAL library which is responsible for the actual Geospatial PDF creation, the PDF renders identically to our original QGIS map. While labels turn on and off alongside their corresponding map layer, they are still correctly stacked in the exact same way as you see in the QGIS window. Furthermore, the created PDFs keep labels and vector features as vector artwork… so there’s absolutely no loss in quality when zooming in to the map! These files look GREAT!
On that same note… the sponsorship allowed us to tackle another related issue, which is that in previous QGIS versions PDF (or SVG) exports would always export every single vertex from any visible feature! Ouch! This meant that if you had a complex polygon boundary layer, you would potentially be creating a PDF with millions of vertices per feature, even though most of these would be overlapping and completely redundant at the exported map’s scale. Now, QGIS automatically simplifies vector features while exporting them (using an appropriate, effectively invisible, level of simplification). The dramatically reduces the created file sizes and speeds up opening them and navigating them in other applications (especially Inkscape). (There’s an option at export time to disable this simplification, if you have a specific reason to!).
Creating Geospatial PDFs from print layouts gives even more options. For a start, whenever a print layout is exported to Geospatial PDFs, we ensure that the created PDF correctly handles stacking of layers alongside any other print layout items you have. In the image below we see a custom print layout which includes interactive layer visibility controls. If a layer is toggled, it’s hidden only from the map item — all the other surrounding elements like the title, north arrow and scalebar remain visible:

That’s not all though! When exporting a print layout to Geospatial PDF, QGIS also hooks into any map themes you’ve setup in your project. If you select to include these themes in your output, then the result is magical! The screenshot below shows the export options for a project with a number of themes, and we’ve chosen to export these themes in the PDF:

Opening the resultant PDF shows that our layer control on the left now lists the map themes instead of individual layers. Viewers can switch between these themes, changing the visibility of layers and their styling to match the QGIS map theme from the project! Additionally, you can even expand out a theme and expose layer-by-layer visibility control. Wow! This means you could create a single PDF output file which includes an environmental, social, cadastral, transport, …. view of your map, all in the one file.

Lastly, there’s even control for fine-tuning the combination of layers which are exposed in the output PDF file and which ones should be toggled on and off together. In the screenshot below we’ve opted to group the “Aircraft” and “Roads” map layers into a single logical PDF group called “Transport”.

The resultant PDF respects this, showing an entry in the interactive layer tree for “Transport” which toggles both the aircraft and roads layers together:

So there you go — the power of Geospatial PDF, coming your way in QGIS 3.10!
One semi-related benefit of this work is that it gave us an opportunity to rework how “layered” exports from print layouts are created. This has had a significant flow-on impact on the existing ability to create layered SVG outputs from QGIS. Previously, this was a rather fragile feature, which created SVGs with lots of issues – overlapping labels, incorrectly stacked layers, and last-but-not-least, non-descriptive layer names! Now, just like Geospatial PDF exports, the layered SVG exports correctly respect the exact look of your map, and have much more friendly, descriptive layer names:

This should significantly reduce the amount of housekeeping required when working on these layered SVG exports.
This work was funded by:
North Road are leading experts in extending the QGIS application to meet your needs. If you’d like to discuss how you can sponsor development of features or fixes which you want in QGIS, just contact us for further details!
Reporting back from the annual international FOSS4G conference, which took place in Bucharest this year.
We presented a workshop on Mesh layer in QGIS during FOSS4G in Bucharest. Below is step-by-step guide for those who’d like to know more about mesh layers in QGIS.
Data for this tutorial can be found here.
In this tutorial, we are going to work with a mesh layer in QGIS. Throughout this tutorial you will learn to:
Load a mesh layer
Change symbology
Working with time
Creating time series/cross section plots
Export mesh
Creating animation
For the purpose of this tutorial, we are going to use the ERA5 dataset from ECMWF:
(the data in the first link should contain what you need to proceed with this tutorial).
Before loading the mesh layer in QGIS, we are going to add the world map as a background layer.
In QGIS, from the Browser panel, browse to the downloaded data > Working with mesh layer > vector_data.gpkg and add world_map layer.
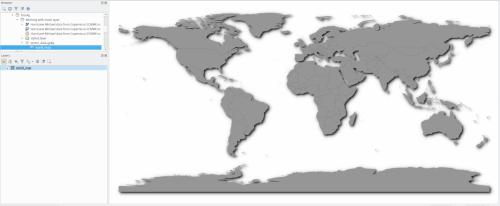
You can change the project background layer to blue to have an image similar to the one below:
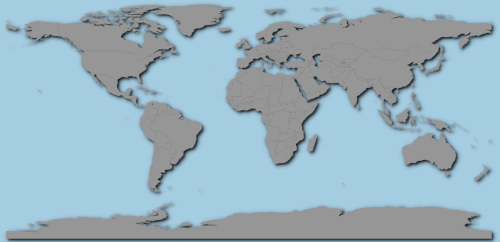
To add the mesh layer:
In QGIS, from the Browser panel, browse to the downloaded data > Working with mesh layer and add Hurricane Michael data from Copernicus ECMWF.nc as a mesh layer (not raster).
Depending on your QGIS settings, the CRS setting window might appear. Ensure you assign EPSG:4326 to the mesh layer.
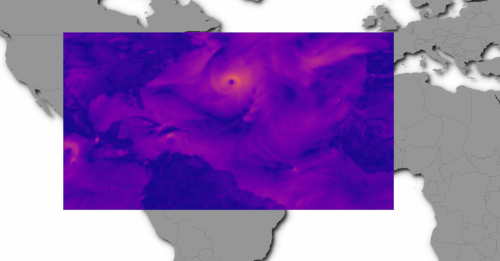
To change the mesh layer style:
In QGIS, from the layers panel, select the mesh layer and press F7
The layer styling panel will appear on the right of your QGIS window
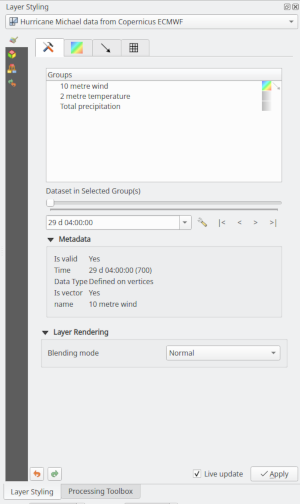
Within this panel, you can switch on/off quantities, vectors, style the layer and browse through time.
Below, we are going to switch on the wind data and style it:
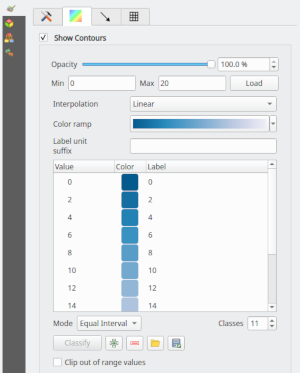
On the Style panel, click on Symbology tab
wind to switch on the quantity**
Under color ramp section:
Set Min to 0
Set Max to 20
Interpolation to Linear
Color ramp to Blues (Inverted)
Mode to Equal Interval
Classes to 11
You can change the blending mode to Darken and you will see an image similar to the one below:
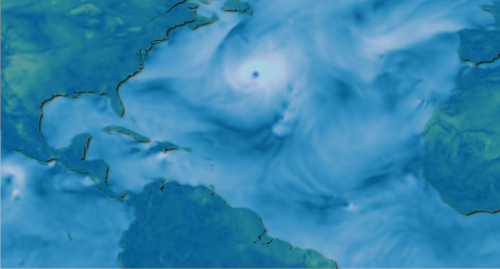
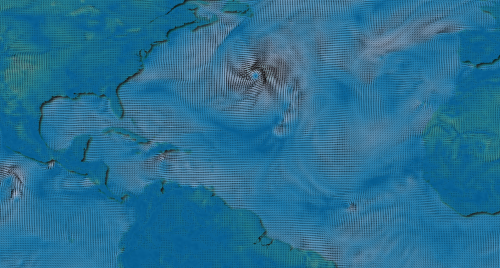
To style vector component of the wind data:
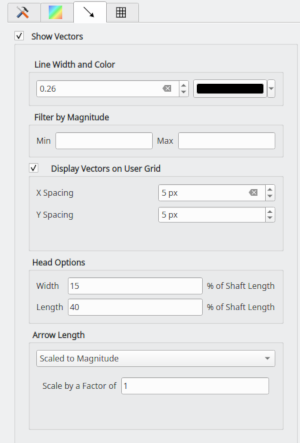
metre wind to switch on the vector**
Click on the vector settings section:
Enable the option for Display Vectors on User Grid
X Spacing: 10 px
**Y Spacing: 10 px **
For Arrow Length, select Scaled to Magnitude
If your mesh layer has time dimension, you should be able to browse through time using the slider provided under the settings tab:
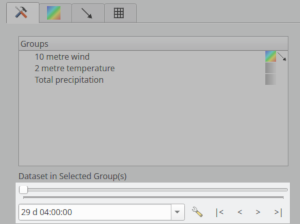
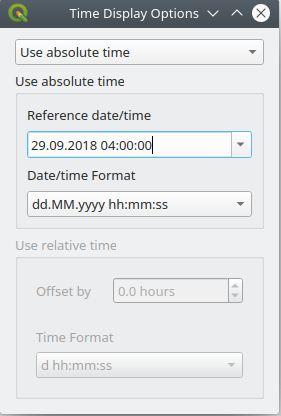
Note that the time reference does not always parse correctly. To change the time (if you know the correct format and starting date/time):
Click on the setting in front of time
In the new window:
Use absolute time
Reference date/time: 29.09.2018 04:00:00
To plot time series, you will need to install Crayfish plugin from QGIS plugin repository. Once the plugin is installed:
In QGIS, from the main menu > Mesh > Crayfish > Plot
An empty plot appears at the bottom of your QGIS window. To generate time series for multiple points on the map:
Make sure you have the following settings
Layer: Hurricane Michale data from Copernicus ECMWF
Plot: Time series
Group: [current]
And then click on From Map: Point
Hold Ctrl key on your keyboard and click on the locations you want to plot time series:
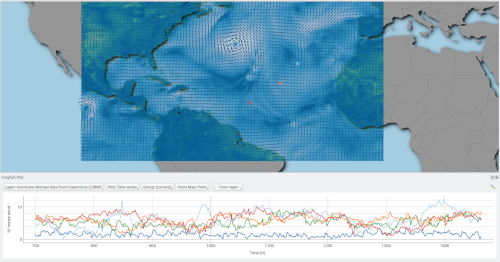
A series of graphs will be plotted for each point with matching colours.
You can also create long profile (including aggregated long plot) for a specific time step.
To export mesh to a raster or vector, you can use the processing toolbox:
In QGIS, from the main menu > Processing > Toolbox
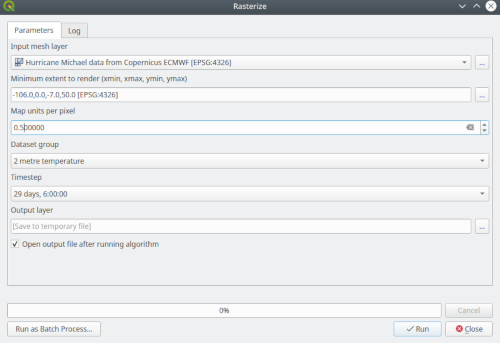
Under Crayfish algorithm, double click on Rasterize
A new window will appear:
For Input mesh layer select Hurricane Michale data from Copernicus ECMWF
For Minimum extent click on … and select Use Layer Extent. In the new pop-up, select Hurricane Michale data from Copernicus ECMWF
For Map units per pixel, type: 0.500
For Dataset group, select 2 metre temperature
For Timestep, select 29 days, 6:00:00
Click Run
Similarly, you can export your mesh to points or polygon for each time step.
To export to animation, you can set up a print layout template.
Ensure you have selected 10 m wind quantity from the mesh layer properties panel
Right-click on Hurricane Michael data from Copernicus ECMWF and select Export to animation
Set the correct parameters for start time/end time
Set the values for time, legend, title, etc
Set the filename for the animation file
Mesh calculator is similar to the Raster calculator with the following added functionalities:
Aggregate functions, e.g. calculate maximum values over time
Time filter
Try to calculate the maximum precipitation values for Hurricane Michale data from Copernicus ECMWF dataset
To join the FOSS4G in Bucharest this week, we have released a new version of Input, a mobile app based on QGIS for field survey.
There have been many new features and enhancements in the new release. You can download the latest version from here:
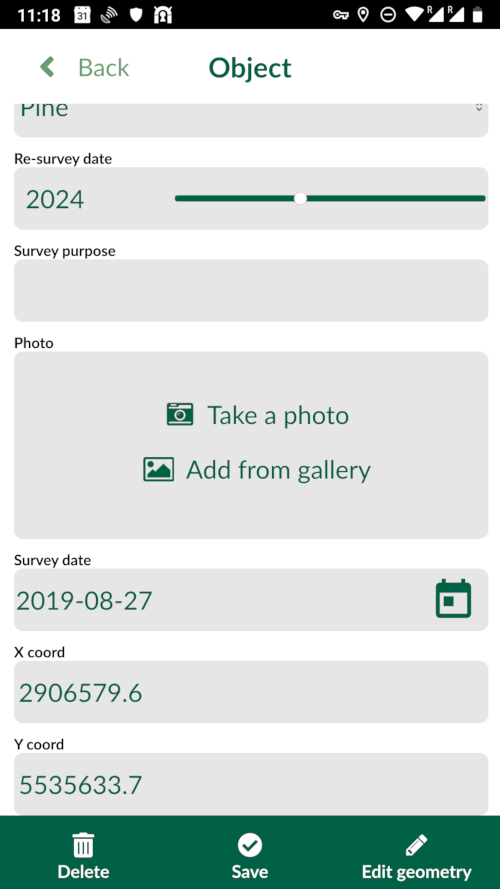
Slider widget has been added as a method to insert values in the forms. The widget configuration follows the QGIS form settings. In addition, the default value settings in QGIS are also recognised in Input forms.
An indicator will appear on the map, while the app is trying to render the content.
Download and upload to the Mergin service have been improved substantially. There is a progress bar indicator for the download/upload. You can also cancel the process.
With the new Google Play Store requirement, we are also now shipping the 64-bit version of the application. Our initial tests showed faster loading and rendering of the maps.
We will be in Bucharest during FOSS4G 2019. Come and talk to us about Input, QGIS, web mapping, etc during the conference!
Currently, there’s around 20 persons in Bucharest working on QGIS development during the Contributors Meeting. And because the name of the hackfest is changed from developers meeting to contributors meeting, I now feel welcome too (as a non-coding contributor). So what can I do, as a non-coding QGIS fan? Write documentation! I just started with […]
We now have signed packages for macOS. You can find these packages published on the official QGIS download page at http://download.qgis.org.
In addition to being a very powerful and user-friendly open source GIS application, QGIS can be installed on different operating systems: MS Windows, macOS, various flavours of Linux and FreeBSD.
Volunteers help with generating the installers for those platforms. The work is highly valuable and the scale of effort put into packaging over the years is often underappreciated. QGIS has also grown significantly over the years and so has its complexity to package relevant libraries and 3rd party tools to the end-users.
QGIS has been packaged on OSX/macOS for many years, making it one of the few GIS applications you can use on this platform. This is largely thanks to the tireless work of William Kyngesburye (https://www.kyngchaos.com/software/qgis/) who has shouldered the task of compiling QGIS and its dependencies and offering them as disk images on the official QGIS website. The packages for each new release are available within days for all supported macOS versions.
Unlike most other operating systems, macOS can only be run on Apple hardware. This is a barrier for developers on other platforms who wish to compile and test their code on macOS. For other platforms, QGIS developers have automated packaging, not only for the major releases but also for daily code snapshots (aka nightly or master builds). Availability of the daily packages has allowed testers to identify platform-specific issues, well before the official release.
Apple also has a system of software signing so that users can verify if the packages are securely generated and signed by the developers. Up until now, signed macOS packages were not available, resulting in users who are installing QGIS needing to go into their security preferences and manually allow the QGIS application to be run.
In October 2018, Lutra Consulting started their work on packaging QGIS for macOS. The work has been based on OSGeo tap on Homebrew. Homebrew is a ‘bleeding edge’ package manager similar to those provided by Gentoo or Arch Linux. The packages by Lutra bundle the various libraries and resources on which QGIS depends into a single QGIS.app application bundle. The packages were made available in late 2018 for QGIS official releases and master. QGIS Mac users have eagerly tested and reported various issues and the majority of them were resolved in early 2019.
Following the successful launch of the prototype packages and in discussion with other developers, it was agreed to transfer the ownership of the packaging infrastructure and scripts (https://github.com/qgis/QGIS-Mac-Packager) to QGIS.org. Using the new infrastructure and OSGeo Apple developers certificate, all QGIS ‘disk images’ (installers) have been available since late May 2019.
What are the main difference between the new installers and the ones offered by Kyngchaos? The new installer offers:
There are some known issues:
For a full list, see: https://github.com/qgis/QGIS-Mac-Packager
We hope that by providing the new installers, macOS users will have a better experience in installing and using QGIS. Ideally, with the availability of nightly builds and being more accessible to new users, more software bugs and issues will be reported and this will help to improve QGIS overall.
Maintaining and supporting macOS costs more compared with other platforms. As QGIS is one of the only viable GIS applications for macOS users in an enterprise environment, we encourage you and your organisation to become a sustaining member to help assure the continued availability and improvement of the macOS packages in the long term.
In future we plan to migrate the packaging process to use Anaconda QGIS packages as the source for package binaries. We also would like to integrate macOS builds into the Travis-CI automated testing that happens whenever a new GitHub pull request is submitted so that we can validate that the macOS packages do not get any regressions when new features are introduced.
With this work, we now have nightly builds of the upcoming release (‘master’) branch available for all to use on macOS. We now have signed packages and we have an automated build infrastructure that will help to ensure that macOS users always have ready access to new versions of QGIS as they become available. You can find these packages published on the official QGIS download page at http://download.qgis.org. A huge thanks to the team at Lutra Consulting for taking this much-needed work, and to William Kyngesburye for the many years that he has contributed towards the macOS/OSX QGIS packaging effort!