Related Plugins and Tags

QGIS Planet

QGIS 3.8 Zanzibar is released!

We are pleased to announce the release of QGIS 3.8 ‘Zanzibar’! Zanzibar was the location of our developer meeting before the international FOSS4G 2018 conference in Dar Es Salaam.


Installers for all supported operating systems are already out. QGIS 3.8 comes with tons of new features, as you can see in our visual changelog.

We would like to thank the developers, documenters, testers and all the many folks out there who volunteer their time and effort (or fund people to do so). From the QGIS community we hope you enjoy this release! If you wish to donate time, money or otherwise get involved in making QGIS more awesome, please wander along to qgis.org and lend a hand!

QGIS is supported by donors and sustaining members. A current list of donors who have made financial contributions large and small to the project can be seen on our donors list. If you would like to become a sustaining member, please visit our page for sustaining members for details. Your support helps us fund our six monthly developer meetings, maintain project infrastructure and fund bug fixing efforts.

QGIS is Free software and you are under no obligation to pay anything to use it – in fact we want to encourage people far and wide to use it regardless of what your financial or social status is – we believe empowering people with spatial decision making tools will result in a better society for all of humanity.

(Fr) Oslandia recrute : développeur(se) C++ et Python

Sorry, this entry is only available in French.

Five QGIS network analysis toolboxes for routing and isochrones

In the past, network analysis capabilities in QGIS were rather limited or not straight-forward to use. This has changed! In QGIS 3.x, we now have a wide range of network analysis tools, both for use case where you want to use your own network data, as well as use cases where you don’t have access to appropriate data or just prefer to use an existing service.

This blog post aims to provide an overview of the options:

  1. Based on local network data
    1. Default QGIS Processing network analysis tools
    2. QNEAT3 plugin
  2. Based on web services
    1. Hqgis plugin (HERE)
    2. ORS Tools plugin (openrouteservice.org)
    3. TravelTime platform plugin (TravelTime platform)

All five options provide Processing toolbox integration but not at the same level.

If you are a regular reader of this blog, you’re probably also aware of the pgRoutingLayer plugin. However, I’m not including it in this list due to its dependency on PostGIS and its pgRouting extension.

Processing network analysis tools

The default Processing network analysis tools are provided out of the box. They provide functionality to compute least cost paths and service areas (distance or time) based on your own network data. Inputs can be individual points or layers of points:

The service area tools return reachable edges and / or nodes rather than a service area polygon:

QNEAT3 plugin

The QNEAT3 (short for Qgis Network Analysis Toolbox 3) Plugin aims to provide sophisticated QGIS Processing-Toolbox algorithms in the field of network analysis. QNEAT3 is integrated in the QGIS3 Processing Framework. It offers algorithms that range from simple shortest path solving to more complex tasks like Iso-Area (aka service areas, accessibility polygons) and OD-Matrix (Origin-Destination-Matrix) computation.

QNEAT3 is an alternative for use case where you want to use your own network data.

For more details see the QNEAT3 documentation at: https://root676.github.io/index.html

Hqgis plugin

Access the HERE API from inside QGIS using your own HERE-API key. Currently supports Geocoding, Routing, POI-search and isochrone analysis.

Hqgis currently does not expose all its functionality to the Processing toolbox:

Instead, the full set of functionality is provided through the plugin GUI:

This plugin requires a HERE API key.

ORS Tools plugin

ORS Tools provides access to most of the functions of openrouteservice.org, based on OpenStreetMap. The tool set includes routing, isochrones and matrix calculations, either interactive in the map canvas or from point files within the processing framework. Extensive attributes are set for output files, incl. duration, length and start/end locations.

ORS Tools is based on OSM data. However, using this plugin still requires an openrouteservice.org API key.

TravelTime platform plugin

This plugin adds a toolbar and processing algorithms allowing to query the TravelTime platform API directly from QGIS. The TravelTime platform API allows to obtain polygons based on actual travel time using several transport modes rather, allowing for much more accurate results than simple distance calculations.

The TravelTime platform plugin requires a TravelTime platform API key.

For more details see: https://blog.traveltimeplatform.com/isochrone-qgis-plugin-traveltime

QGIS Grant Programme 2019 Results

We are extremely pleased to announce the winning proposals for our 2019 QGIS.ORG grant programme. Funding for the programme was sourced by you, our project donors and sponsorsNote: For more context surrounding our grant programme, please see: QGIS Grants #4: Call for Grant Proposals 2019.

The QGIS.ORG Grant Programme aims to support work from our community that would typically not be funded by client/contractor agreements. For the first time, this year we did not accept proposals for the development of new features. Instead proposals should focus on infrastructure improvements and polishing of existing features.

Voting to select the successful projects was carried out by our QGIS Voting Members. Each voting member was allowed to select up to 6 of the 10 submitted proposals by means of a ranked selection form. The full list of votes are available here (on the first sheet). The second sheet contains the calculations used to determine the winner (for full transparency). The table below summarizes the voting tallies for the proposals:

A couple of extra notes about the voting process:

  • The PSC has an ongoing program to fund documentation so elected to fund the proposal “Open documentation issues for pull requests” even if this increases the total funded amount beyond the initial budget.
  • Although the budget for the grant programme was €20,000, the total amount for the winning proposals is €22,200. This increase is possible thanks to the generous support by our donors and sponsors this year.
  • Voting was carried out based on the technical merits of the proposals and the competency of the applicants to execute on these proposals.
  • No restrictions were in place in terms of how many proposals could be submitted per person / organization, or how many proposals could be awarded to each proposing person / organization.
  • Voting was ‘blind’ (voters could not see the existing votes that had been placed).

We received 31 votes from 16 community representatives and 15 user group representatives.

On behalf of the QGIS.ORG project, I would like to thank everyone who submitted proposals for this call!

A number of interesting and useful proposal didn’t make it because of our limited budget; we encourage organizations to pick up one of their choice and sponsor it.

(English) Proj: Select Datum Transformations for EPSG:28992

(FOR REFERENCE, TODO: TO BE UPDATED AND TRANSLATED) If you startup QGIS 3.8 / Zanzibar the first time to load a data in our national CRS (EPSG:28992) you are being presented with the following dialog: I thought it had something todo with the fact that this OSGeo4W install maybe used the newer PROJ (6.0.1), but […]

(English) QGISnetworklogger plugin or what are QGIS and my service talking about…

Just released a ‘new’ plugin: QGIS Network Logger, install via the plugin manager of QGIS version 3.6 or higher (https://plugins.qgis.org/plugins/qgisnetworklogger/). One of the things QGIS is pretty good in is talking to OGC services (WebMapService/WMS, WebFeatureService/WFS etc etc), QGIS even talks to Esri web services. Something what was hard in this, is that if you […]

QGIS 3 and performance analysis

Context

Since last year we (the QGIS communtity) have been using QGIS-Server-PerfSuite to run performance tests on a daily basis. This way, we’re able to monitor and avoid regressions according to some test scenarios for several QGIS Server releases (currently 2.18, 3.4, 3.6 and master branches). However, there are still many questions about performance from a general point of view:

  • What is the performance of QGIS Server compared to QGIS Desktop?
  • What are the implications of feature simplification for polygons and lines?
  • Does the symbology have a strong impact on performance and in which proportion?

Of course, it’s a broad and complex topic because of the numerous possibilities offered by the rendering engine of QGIS. In this article we’ll look at typical use cases with geometries coming from a PostgreSQL database.

Methodology

The first way to monitor performance is to measure the rendering time. To do so, the Map canvas refreshis activated in the Settings of QGIS Desktop. In this way we can get the rendering time from within the Rendering tab of log messages in QGIS Desktop, as well as from log messages written by QGIS Server.

The rendering time retrieved with this method allows to get the total amount of time spent in rendering for each layer (see the source code).

But in the case of QGIS Server another interesting measure is the total time spent for a specific request, which may be read from log messages too. There are indeed more operations achieved for a single WMS request than a simple rendering in QGIS Desktop:
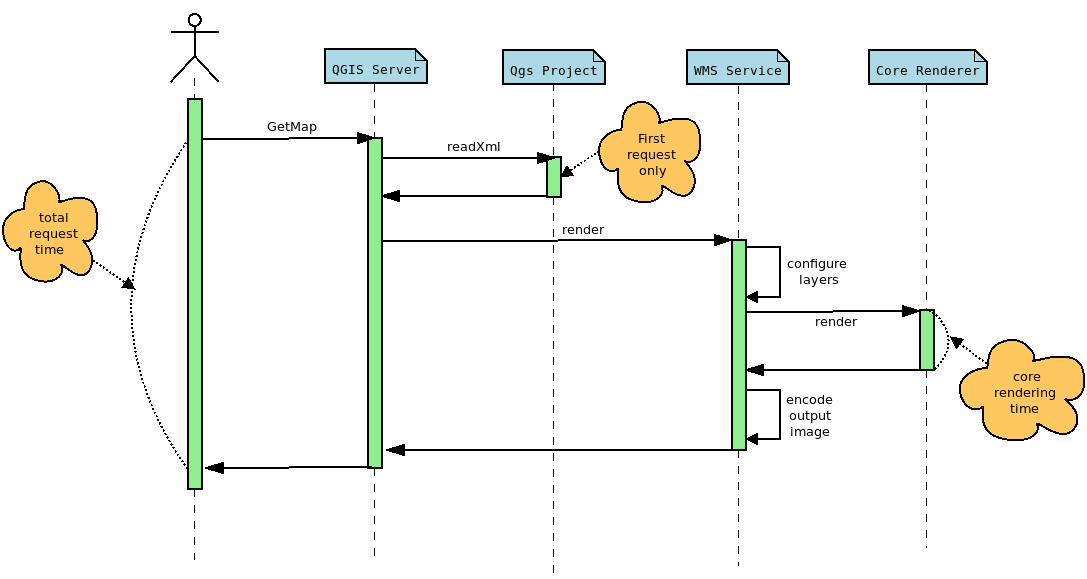
The rendering time extracted from QGIS Desktop corresponds to the core rendering time displayed in the sequence diagram above. Moreover, to be perfectly comparable, the rendering engine must be configured in the same way in both cases. In this way, and thanks to PyQGIS API, we can retrieve the necessary information from the Python console in QGIS Desktop, like the extent or the canvas size, in order to configure the GetMap WMS request with the appropriate WIDTH,, HEIGHT , and BBOX parameters.

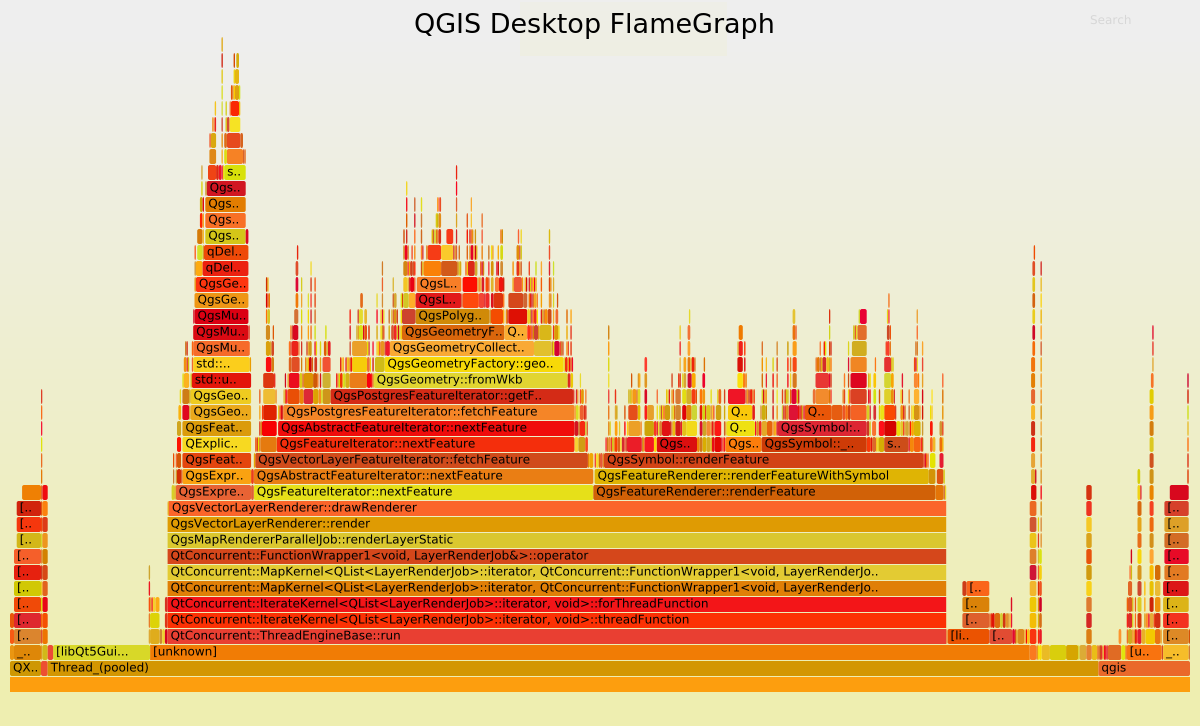
Another way to examine the performance is to use a profiler in order to inspect stack traces. These traces may be represented as a FlameGraph. In this case, debug symbols are necessary, meaning that the rendering time is not representative anymore. Indeed, QGIS has to be compiled in Debug mode.

Polygons

For these tests we use the same dataset as that for the daily performance tests, which is a layer of polygons with 282,776 features.

Feature simplification deactivated

Let’s first have a look at the rendering time and the FlameGraph when the simplification is deactivated. In QGIS Desktop, the mean rendering time is 2591 ms. Using to the PyQGIS API we are able to get the extent and the size of the map to render the map again but using a GetMap WMS request this time.

In this case, the rendering time is 2469 ms and the total request time is 2540 ms. For the record, the first GetMap request is ignored because in this case, the whole QGIS project is read and cached, meaning that the total request time is much higher. But according to those results, the rendering time for QGIS Desktop and QGIS Server are utterly similar, which makes sense considering that the same rendering engine is used, but it is still very reassuring :).

Now, let’s take a look to the FlameGraph to detect where most of the time is spent.
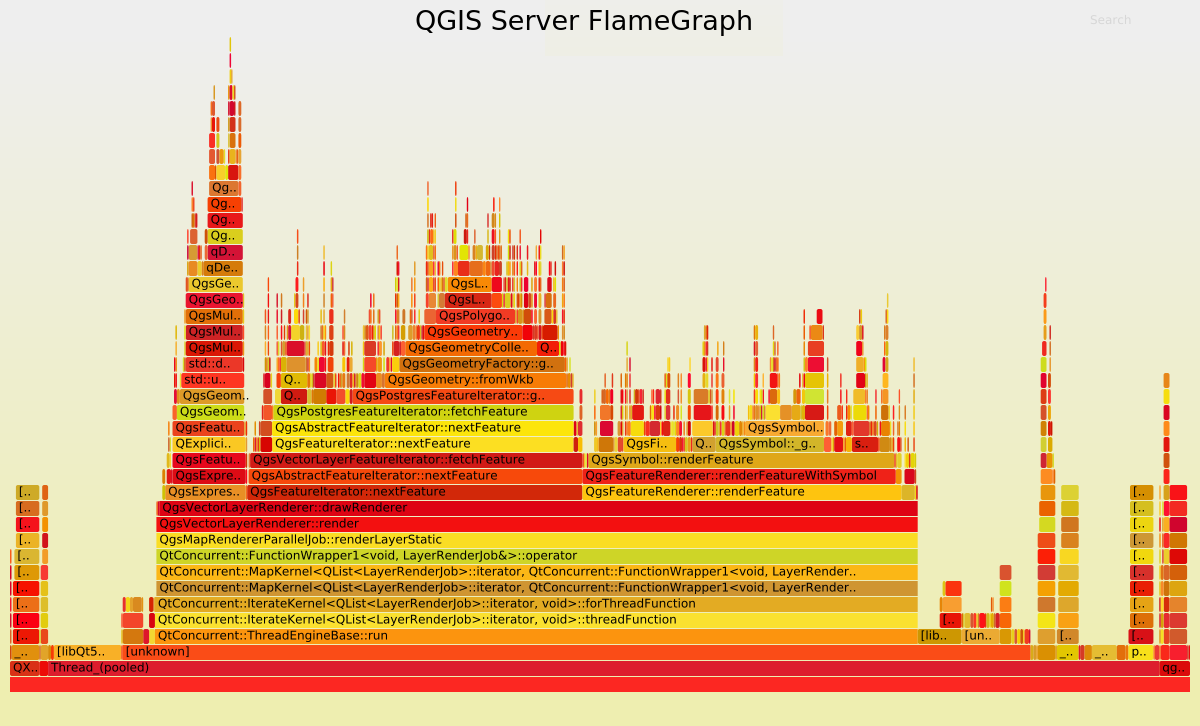
 

Undoubtedly the FlameGraph’s are similar in both cases, meaning that if we want to improve the performance of QGIS Server we need to improve the performance of the core rendering engine, also used in QGIS Desktop. In our case the main method is QgsMapRendererParallelJob::renderLayerStatic where most of the time is spent in:

Methods Desktop % Server %
QgsExpressionContext::setFeature 6.39 6.82
QgsFeatureIterator::nextFeature 28.77 28.41
QgsFeatureRenderer::renderFeature 29.01 27.05

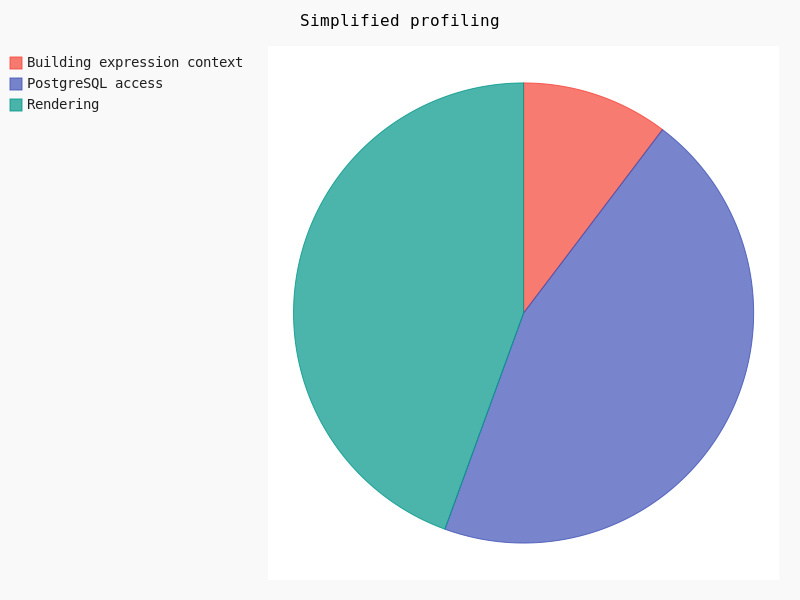
Basically, it may be simplified like:

Clearly, the rendering takes about 30% of the total amount of time. In this case geometry simplification could potentially help.

Feature simplification activated

Geometry simplification, available for both polygons and lines layers, may be activated and configured through layer’s Properties in the Rendering tab. Several parameters may be set:

  • Simplification may be deactivated
  • Threshold for a more drastic simplification
  • Algorithm
  • Provider simplification
  • Scale

Once the simplification activated, we varied the threshold as well as the algorithm in order to detect performance jumps:
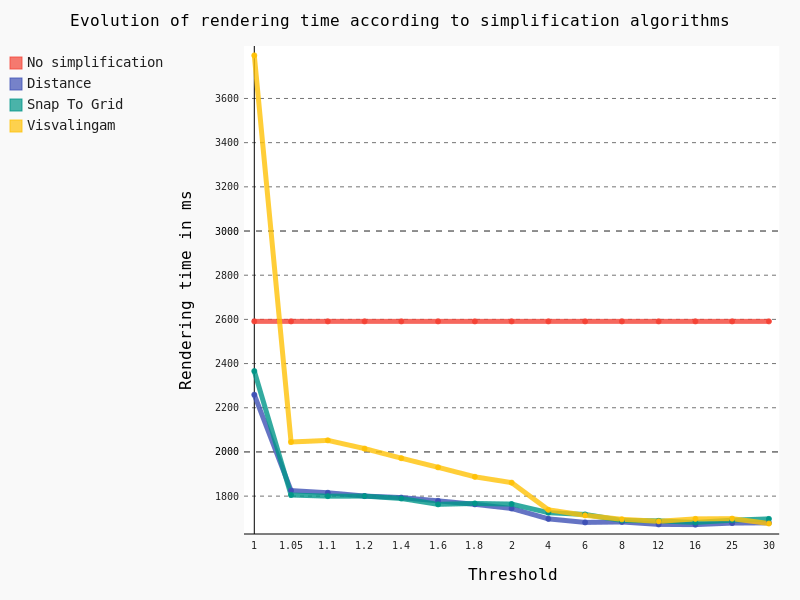
The following conclusions can be drawn:

  • The Visvalingam algorithm should be avoided because it begins to be efficient with a high threshold, meaning a significant lack of precision in geometries
  • The ideal threshold for Snap To Grid and Distance algorithms seems to be 1.05. Indeed, considering that it’s a very low threshold, the precision of geometries is still pretty good for a major improvement in rendering time though

For now, these tests have been run on the full extent of the layer. However, we still have a Maximum scale parameter to test, so we’ve decreased the scale of the layer:

And in this case, results are pretty interesting too:
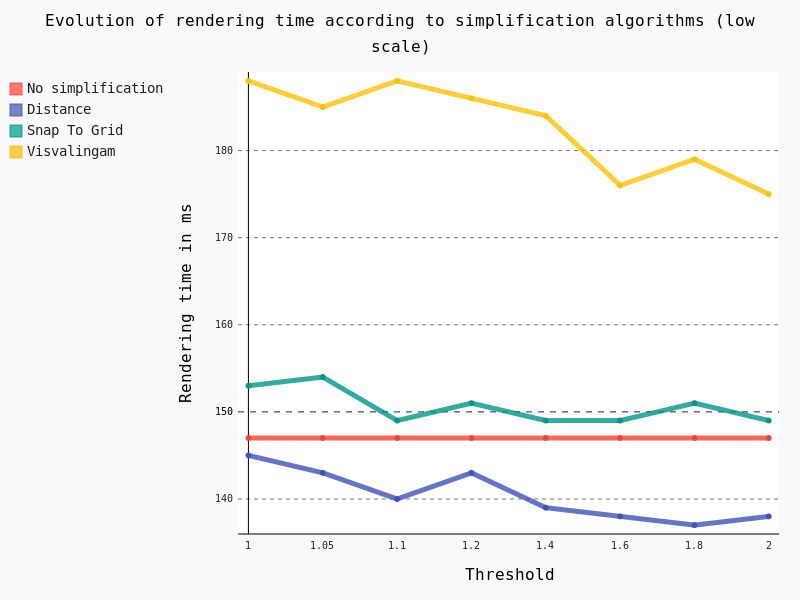
Several conclusions can be drawn:

  • Visvalingam algorithm should be avoided at low scale too
  • Snap To Grid seems counter-productive at low scale
  • Distance algorithm seems to be a good option

Lines

For these tests we also use the same dataset as that for daily performance tests, which is a layer of lines with 125,782 features.

Feature simplification activated

In the same way as for polygons we have tested the effect of the geometric simplification on the rendering time, as well as algorithms and thresholds:
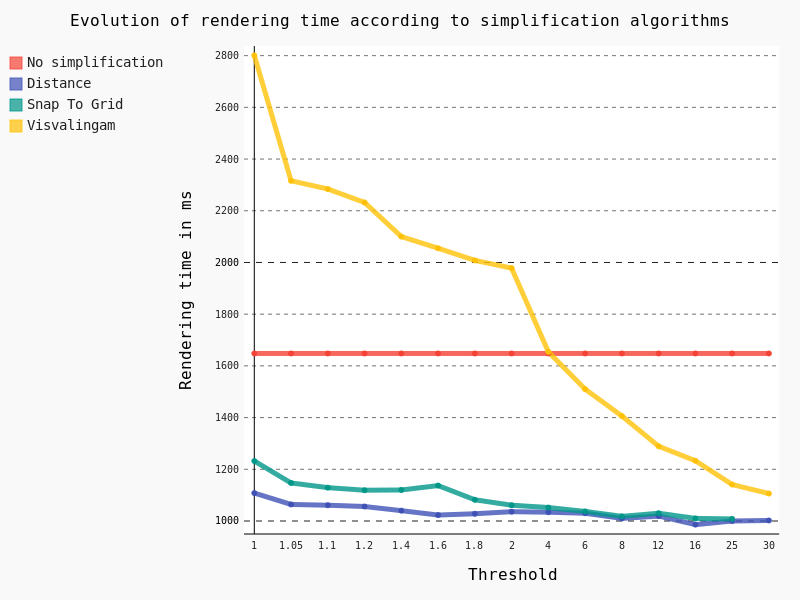
In this case we have exactly the same conclusion as for polygons: the Distance algorithm should be preferred with a threshold of 1.05.

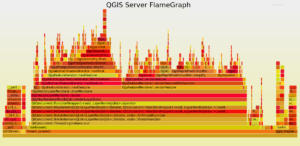
For QGIS Server the mean rendering time is about 1180 ms with geometry simplification compared to 1108 ms for QGIS Desktop, which is totally consistent. And looking at the FlameGraph we note that once again most of the time is spent in accessing the PostgreSQL database (about 30%) and rendering features (about 40%).


Symbology

Another parameter which has an obvious impact on performance is the symbology used to draw the layers. Some features are known to be time consuming, but we’ve felt that a a thorough study was necessary to verify it.


Firstly, we’ve studied the influence of the width as well as the Single Symbol type on the rendering time.
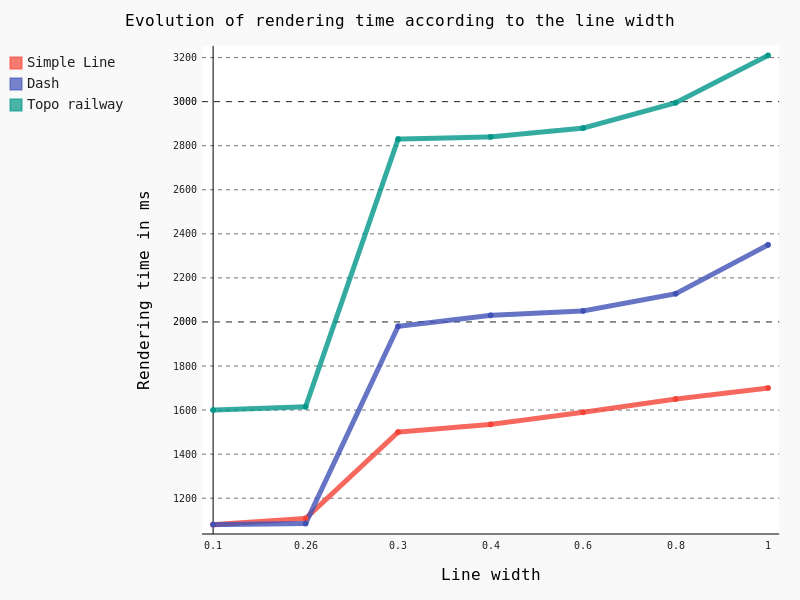
Some points are noteworthy:

Simple Line is clearly the less time consuming

– Beyond the default 0.26 line width, rendering time begins to raise consequently with a clear jump in performance


Another interesting feature is the Draw effects option, allowing to add some fancy effects (shadow, glow, …).
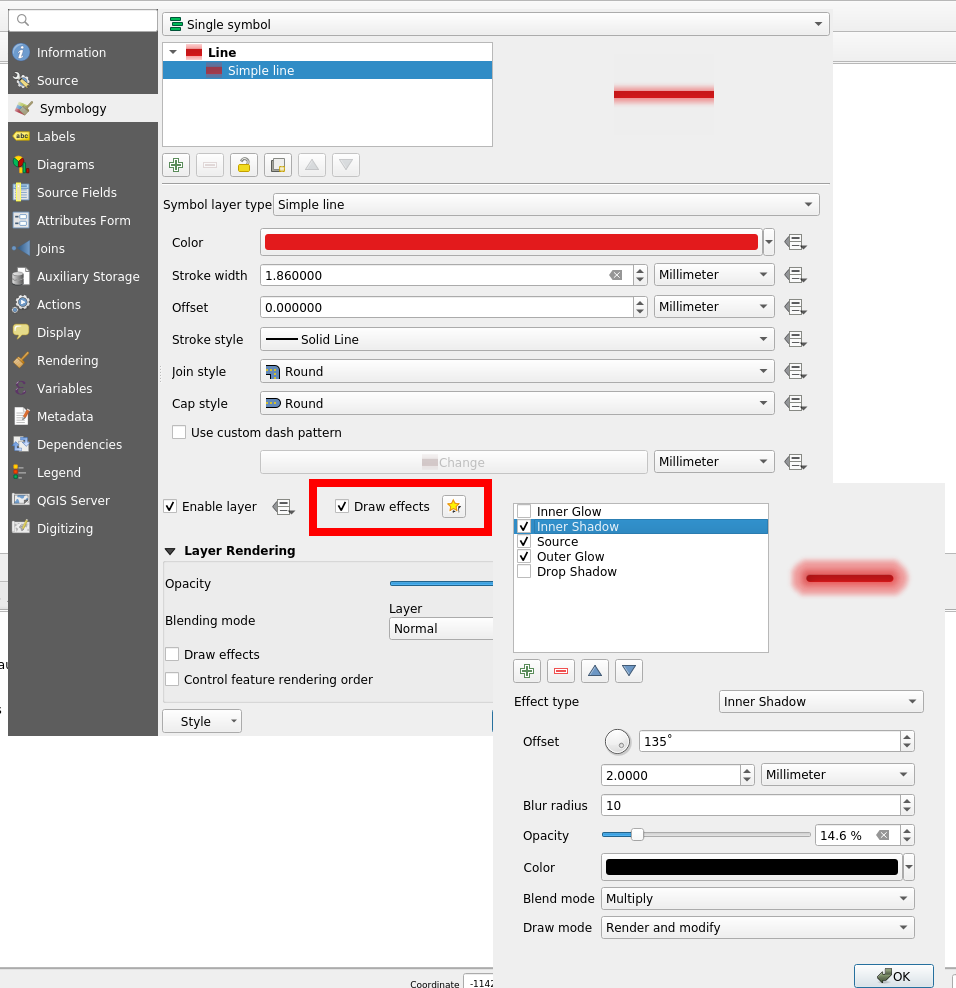
However, this feature is known to be particularly CPU consuming. Actually, rendering all the 125,782 lines took so long that we had to to change to a lower scale, with just some a few dozen lines. Results are unequivocal:


The last thing we wanted to test for symbology is the effect of the Categorized classification. Here are the results for some classifications with geometry simplification activated:

  • No classification: 1108 ms
  • A simple classification using the column “classification” (8 symbols): 1148 ms
  • A classification based on a stupid expression “classification x 3″ (8 symbols): 1261 ms
  • A classification based on string comparison “toponyme like ‘Ruisseau*'” (2 symbols): 1380 ms
  • A classification with a specific width line for each category (8 symbols): 1850 ms

Considering that a simple classification does not add an excessive extra-cost, it seems that the classification process itself is not very time consuming. However, as soon as an expression is used, we can observe a slight jump in performance.

Labeling

Another important part to study regarding performance is labeling and the underlying positioning. For this test we decreased the scale and varied the Placement parameter without tuning anything.

Clearly, the parallel labeling is much more time consuming than the other placements. However, as previously stated, we used the default parameters for each positioning, meaning that the number of labels really drawn on the map differs from a placement to another.

Points

The last kind of geometries we have to study is points. Similarly to polygons and lines, we used the same dataset as that of performance tests, that is a layer with 435588 points.

In the case of points geometries geometry simplification is of course not available. So we are going to focus on symbology and the impact of marker size.

Obviously Font Marker must be used carefully because of the underlying jump in performance, as well as SVG Symbols. Moreover, contrary to Simple Marker, an increase of the size implies a drastic augmentation in time rendering.

General conclusion

Based on this factual study, several conclusions can be drawn.

Globally, FlameGraph for QGIS Desktop and QGIS Server are completely similar as well as rendering time.

It means that if we want to improve the performance of QGIS Server, we have to work on the desktop configuration and the rendering engine of the QGIS core library.

Extracting generic conclusions from our tests is very difficult, because it clearly depends on the underlying data. But let’s try to suggest some recommendations :).

Firstly, geometry simplification seems pretty efficient with lines and polygons as soon as the algorithm is chosen cautiously, and as long as your features include many vertices. It seems that the Distance algorithm with a 1.05 threshold is a good choice, with both high and low scale. However, it’s not a magic solution!

Secondly, a special care is needed with regards to symbology. Indeed, in some cases, a clear jump in performance is notable. For example, fancy effects and Font Marker SVG Symbol have to be used with caution if you’re picky on rendering time.

Thirdly, we have to be aware of the extra cost caused by labeling, especially the Parallel  placement for line geometries. On this subject, a not very well-known parameter allows to drastically reduce labeling time: the PAL candidates option. Actually, we may decrease the labeling time by reducing the number of candidates. For an explicit use case, you can take a look at the daily reports.
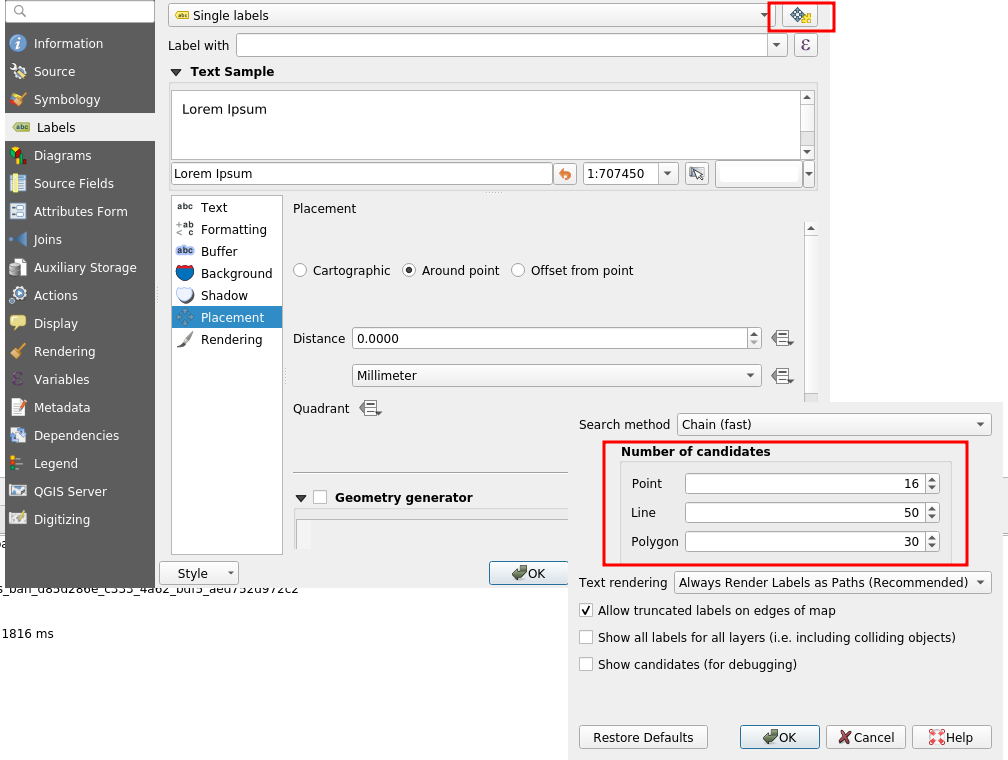
In any case, improving server performance in a substantial way means improving the QGIS core library directly.

Especially, we noticed thanks to FlameGraph that most of the time is spent in drawing features and managing the data from the PostgreSQL database. By the way, a legitimate question is: “How much time do we spend on waiting for the database?”. To be continued 😉

If you hit performance issues on your specific configuration or want to improve QGIS awesomeness, we provide a unique QGIS support offer at http://qgis.oslandia.com/ thanks to our team of specialists!

Funding for selective masking in QGIS is now complete!

Few months ago, Oslandia launched QGIS lab’s , a place to advertise our new ideas for QGIS, but also a place to help you find co funders to make dreams become reality.

The first initiative is about label selective masking, a feature that will allow us to achieve even more professional rendering for our maps.

Selective masking


Thanks to the commitment of the Swiss QGIS user group and local authorities, this work is now funded !

We now can start working hard to deliver you this great feature for QGIS 3.10

Thanks again to our funders

A last word, this is not a classical crowd funding initiative, but a classical contract for each funder.

No more reason not to contribute to free and open source software!

QGIS Print Layouts Graphs and Charts — target reached!

We’ve just passed the extended deadline for our recent QGIS Print Layouts Graphs and Charts campaign, and the great news is that thanks to a large number of generous backers we’ve successfully hit the target for this campaign! This has only been possible thanks to the tireless work of the QGIS community and user groups in promoting this campaign and spreading the word.

The Print Layouts Graphs and Charts campaign is a joint effort with our friends at Faunalia, so we’ll soon be starting work together on all the wonderful new functionality heading to the QGIS DataPlotly plugin as a result. The work will be commencing late June, just after the QGIS 3.8.0 final release. Keep an eye out for further updates on the development from this time! You can read more about what’s coming in detail at the campaign page.

We’d like to take this opportunity to extend our heartfelt thanks to all the backers who have pledged to support this project:

  • Federico Gianoli
  • Papercraft Mountains
  • Liam McCrae
  • Henry Walshaw
  • Raúl Sangonzalo
  • Ferdinando Urbano
  • pitsch-ing.ch
  • Carbon-X
  • Gabriel Diosan
  • Rene Giovanni Borella
  • Enrico Bertonati
  • Guido Ingwer
  • David Addy
  • Gerd Jünger
  • Andreas Neumann
  • Stefano Campus
  • Michael Jabot
  • Korto
  • Enrico Ferreguti
  • Carlo A. Nicolini
  • Salvatore Fiandaca
  • Alberto Grava
  • Hans van der Kwast
  • Ben Hur Pintor
  • Silvio Grosso
  • Nobusuke Iwasaki
  • Alasdair Rae
  • Manori Senanayake
  • Canton de Neuchâtel
  • Matthias Daues
  • Alteri Seculo
  • SunGIS Ltd.
  • Stu Smith
  • Keolis Rennes
  • Gabriel Diosan
  • Aiden Price
  • Giacomo Ponticelli
  • Diane Fritz
  • Gemio Bissolati
  • Claire Birnie
  • Nicolas Roelandt
  • Rocco Pispico
  • Gabriel Bengtsson
  • Birds Eye View
  • Barend Köbben
  • Roberto Marzocchi (GTER)
  • Yoichi Kayama
  • Alessandro Sarretta
  • Luca Angeli
  • Luca Bellani
  • giswelt
  • Stefan Giese
  • Ben Harding
  • Joao Gaspar
  • Romain Lacroix
  • Ryan Cooper
  • Daniele Bonaposta
  • QGIS Swedish User Group
  • Nino Formica
  • Michael Gieding
  • Amedeo Fadini
  • Andrew Hannell
  • Stefano
  • Phil Wyatt
  • Brett Edmond Carlock
  • Transitec


Using QGIS from Conda

QGIS recipes have been available on Conda for a while, but now, that they work for the three main operating systems, getting QGIS from Conda is s starting to become a reliable alternative to other QGIS distributions. Anyway, let’s rewind a bit…

What is Conda?

Conda is an open source package management system and environment management system that runs on Windows, macOS and Linux. Conda quickly installs, runs and updates packages and their dependencies. Conda easily creates, saves, loads and switches between environments on your local computer. It was created for Python programs, but it can package and distribute software for any language.

Why is that of any relevance?

Conda provides a similar way to build, package and install QGIS (or any other software) in Linux, Windows, and Mac.

As a user, it’s the installation part that I enjoy the most. I am a Linux user, and one of the significant limitations is not having an easy way to install more than one version of QGIS on my machine (for example the latest stable version and the Long Term Release). I was able to work around that limitation by compiling QGIS myself, but with Conda, I can install as many versions as I want in a very convenient way.

The following paragraphs explain how to install QGIS using Conda. The instructions and Conda commands should be quite similar for all the operating systems.

Anaconda or miniconda?

First thing you need to do is to install the Conda packaging system. Two distributions install Conda: Anaconda and Miniconda.

TL;DR Anaconda is big (3Gb?) and installs the packaging system and a lot of useful tools, python packages, libraries, etc… . Miniconda is much smaller and installs just the packaging system, which is the bare minimum that you need to work with Conda and will allow you to selectively install the tools and packages you need. I prefer the later.

For more information, check this stack exchange answer on anaconda vs miniconda.

Download anaconda or miniconda installers for your system and follow the instructions to install it.

Windows installer is an executable, you should run it as administrator. The OSX and Linux installers are bash scripts, which means that, once downloaded, you need to run something like this to install:

bash Miniconda3-latest-Linux-x86_64.sh

Installing QGIS

Notice that the Conda tools are used in a command line terminal. Besides, on Windows, you need to use the command prompt that is installed with miniconda.

Using environments

Conda works with environments, which are similar to Python virtual environments but not limited only to python. Basically, it allows isolating different installations or setups without interfering with the rest of the system. I recommend that you always use environments. If, like me, you want to have more that one version of QGIS installed, then the use of environments is mandatory.

Creating an environment is as easy as entering the following command on the terminal:

conda create --name <name_of_the_environment>

For example,

conda create --name qgis_stable

You can choose the version of python to use in your environment by adding the option python=<version>. Currently versions of QGIS run on python 3.6, 3.7, 3.8 and 3.9.

conda create –name qgis_stable python=3.7

To use an environment, you need to activate it.

conda activate qgis_stable

Your terminal prompt will show you the active environment.

(qgis_stable) aneto@oryx:~/miniconda3$

To deactivate the current environment, you run

conda deactivate

Installing packages

Installing packages using Conda is as simples as:

conda install <package_name>

Because conda packages can be stored in different channels, and because the default channels (from the anaconda service) do not contain QGIS, we need to specify the channel we want to get the package from. conda-forge is a community-driven repository of conda recipes and includes updated QGIS packages.

conda install qgis --channel conda-forge

Conda will download the latest available version of QGIS and all its dependencies installing it on the active environment.

Note: Because conda always try to install the latest version, if you want to use the QGIS LTR version, you must specify the QGIS version.

conda install qgis=3.10.12 --channel conda-forge

Uninstalling packages

Uninstalling QGIS is also easy. The quickest option is to delete the entire environment where QGIS was installed. Make sure you deactivate it first.

conda deactivate
conda env remove --name qgis_stable

Another option is to remove QGIS package manually. This is useful if you have other packages installed that you want to keep.

conda activate qgis_stable
conda remove qgis -c conda-forge

This only removes the QGIS package and will leave all other packages that were installed with it. Note that you need to specify the conda-forge channel. Otherwise, Conda will try to update some packages from the default channels during the removal process, and things may get messy.

Running QGIS

To run QGIS, in the terminal, activate the environment (if not activated already) and run the qgis command

conda activate qgis_stable
qgis

Updating QGIS

To update QGIS to the most recent version, you need to run the following command with the respective environment active

conda update qgis -c conda-forge

To update a patch release for the QGIS LTR version you run the install command again with the new version:

conda install qgis=3.10.13 -c conda-forge

Some notes and caveats

Please be aware that QGIS packages on Conda do not provide the same level of user experience as the official Linux, Windows, and Mac installer from the QGIS.org distribution. For example, there are no desktop icons or file association, it does not include GRASS and SAGA, etc …

On the other hand, QGIS installations on Conda it will share user configurations, installed plugins, with any other QGIS installations on your system.

QGIS op de FOSS4GNL 2019 (20 juni in Delft)

Sorry, this entry is only available in Dutch.

Movement data in GIS #23: trajectories in context

Today’s post continues where “Why you should be using PostGIS trajectories” leaves off. It’s the result of a collaboration with Eva Westermeier. I had the pleasure to supervise her internship at AIT last year and also co-supervised her Master’s thesis [0] on the topic of enriching trajectories with information about their geographic context.

Context-aware analysis of movement data is crucial for different domains and applications, from transport to ecology. While there is a wealth of data, efficient and user-friendly contextual trajectory analysis is still hampered by a lack of appropriate conceptual approaches and practical methods. (Westermeier, 2018)

Part of the work was focused on evaluating different approaches to adding context information from vector datasets to trajectories in PostGIS. For example, adding land cover context to animal movement data or adding information on anchoring and harbor areas to vessel movement data.

Classic point-based model vs. line-based model

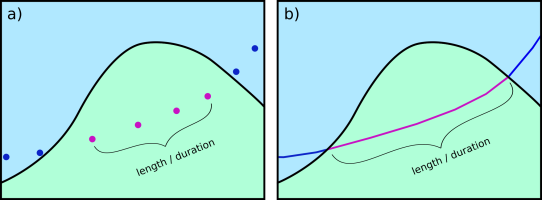
The obvious approach is to intersect the trajectory points with context data. This is the classic point data model of contextual trajectories. It’s straightforward to add context information in the point-based model but it also generates large numbers of repeating annotations. In contrast, the line data model using, for example, PostGIS trajectories (LinestringM) is more compact since trajectories can be split into segments at context borders. This creates one annotation per segment and the individual segments are convenient to analyze (as described in part #12).

Spatio-temporal interpolation as provided by the line data model offers additional advantages for the analysis of annotated segments. Contextual segments start and end at the intersection of the trajectory linestring with context polygon borders. This means that there are no gaps like in the point-based model. Consequently, while the point-based model systematically underestimates segment length and duration, the line-based approach offers more meaningful segment length and duration measurements.

Schematic illustration of a subset of an annotated trajectory in two context classes, a) systematic underestimation of length or duration in the point data model, b) full length or duration between context polygon borders in the line data model (source: Westermeier (2018))

Another issue of the point data model is that brief context changes may be missed or represented by just one point location. This makes it impossible to compute the length or duration of the respective context segment. (Of course, depending on the application, it can be desirable to ignore brief context changes and make the annotation process robust towards irrelevant changes.)

Schematic illustration of context annotation for brief context changes, a) and b)
two variants for the point data model, c) gapless annotation in the line data model (source: Westermeier (2018) based on Buchin et al. (2014))

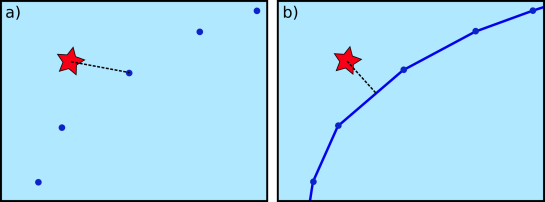
Beyond annotations, context can also be considered directly in an analysis, for example, when computing distances between trajectories and contextual point objects. In this case, the point-based approach systematically overestimates the distances.

Schematic illustration of distance measurement from a trajectory to an external
object, a) point data model, b) line data model (source: Westermeier (2018))

The above examples show that there are some good reasons to dump the classic point-based model. However, the line-based model is not without its own issues.

Issues

Computing the context annotations for trajectory segments is tricky. The main issue is that ST_Intersection drops the M values. This effectively destroys our trajectories! There are ways to deal with this issue – and the corresponding SQL queries are published in the thesis (p. 38-40) – but it’s a real bummer. Basically, ST_Intersection only provides geometric output. Therefore, we need to reconstruct the temporal information in order to create usable trajectory segments.

Finally, while the line-based model is well suited to add context from other vector data, it is less useful for context data from continuous rasters but that was beyond the scope of this work.

Conclusion

After the promising results of my initial investigations into PostGIS trajectories, I was optimistic that context annotations would be a straightforward add-on. The line-based approach has multiple advantages when it comes to analyzing contextual segments. Unfortunately, generating these contextual segments is much less convenient and also slower than I had hoped. Originally, I had planned to turn this work into a plugin for the Processing toolbox but the results of this work motivated me to look into other solutions. You’ve already seen some of the outcomes in part #20 “Trajectools v1 released!”.

References

[0] Westermeier, E.M. (2018). Contextual Trajectory Modeling and Analysis. Master Thesis, Interfaculty Department of Geoinformatics, University of Salzburg.


This post is part of a series. Read more about movement data in GIS.

„Geo For All“ - neue Technologien für eine Welt im Wandel

GEOSummit 2014, Bern „Geo for all“ ist nicht nur das Motto der weltumspannenden ICA-OSGeo Lab Initiative zur Förderung der GIS-Ausbildung an Hochschulen, sondern steht allgemein für den immer breiteren Zugang zu professionellen GIS-Werkzeugen. Im Kartenbereich haben Produkte wie TileMill oder D3.js, sowie Dienste wie CartoDB, GeoCommons, usw. den Anwenderkreis weit über das klassische GIS-Fachbebiet hinaus erweitert. Im Vortrag werden einige herausragende Beispiele vorgestellt und deren Relevanz für die Fachwelt erläutert.

Share and manage your Data with QGIS Cloud and WFS-T

A lot of people are using QGIS Cloud as a service with ready to use QGIS webclient. It’s very easy to publish data and share maps in this way. But QGIS Cloud has more power under the hood. A not so obvious feature of QGIS Cloud is the option to share your data via Web Feature Service (WFS) and manage them via Web Feature Service Transactional (WFS-T). “The basic Web Feature Service allows querying and retrieval of features.

QGIS goes 3D

Marco, Matthias and me spent three days at the QGIS hackfest in Wroclaw (pictures). There I got the time to work on the QGIS globe plugin and made a presentation of the current state. As soon as the threading branch (Martin Dobias’ Google of Summer project) is merged into trunk, the globe should make its way into trunk as well. In the meantime you can compile the QGIS branch from guthub to test the globe.

QGIS Cloud - Speed up the loading time of the web client

QGIS Cloud is your personal geo-data infrastructure in the internet. Publish maps and data. Share geo-information with others. And all of this very easily, without server, infrastructure and expert knowledge. If you know QGIS Desktop, then you know QGIS cloud just as well. Just install the QGIS cloud plugin from the official QGIS plugin repository and you’re good to go. You can publish as many maps as you want. But the default settings of QGIS projects you like to publish via QGIS Cloud are not the best with respect to the performance of the QGIS Webclient / WMS.

FOSSGIS 2017 in Passau

In zwei Wochen beginnt die alljährliche deutschsprachige FOSSGIS Konferenz zum Theme Open Source GIS und OpenStreetMap in Passau.

Sourcepole at FOSS4G 2014 in Portland

In one week, the 2014 FOSS4G Conference will start in Portland/Oregon. Sourcepole supports this major event as a bronze sponsor. Our conference contributions: Workshop presented by Horst Düster (@moazagotl) Tuesday afternoon: QGIS Plugin Development with PyQt4 and PyQGIS Presentations by Pirmin Kalberer ((@implgeo)) Thursday, Session 2, Track 7, 13:00 - 13:25: State of QGIS Server Thursday, Session 2, Track 7, 13:30 - 13:55: From Nottingham to PDX: QGIS 2014 roundup Thursday, Session 3, Track 6, 16:25 - 13:25: Easy ETL with OGR Meet Pirmin and Horst at Sourcepole’s exhibition booth and have a look at our latest products.

The state of QGIS Globe

The Region of Umbria, Italy, sponsored 4 days of work to update QGIS Globe for current QGIS versions. Most of the functionality is working again and the globe is now compatible with osgEarth 1.0 up to 1.3. The bad news is, that the globe plugin is not working on Windows with OSGeo4W. It seems that one of the OSGeo4W libraries (GDAL?) is compiled with an incompatible MS compiler version. Christmas holidays are coming…

Slides FOSS4G 2017

Reporting back from FOSS4G 2017 in Boston, which started with the usual QGIS plugin programming workshop, this time at the Harvard University campus.

  • <<
  • Page 30 of 141 ( 2808 posts )
  • >>

Back to Top

Sustaining Members