Related Plugins and Tags

QGIS Planet

Map corner coordinates in QGIS

EN | PT

Some time ago in the qgis-pt mailing list, someone asked how to show the coordinates of a map corners using QGIS. Since this features wasn’t available (yet), I have tried to reach a automatic solution, but without success,  After some thought about it and after reading a blog post by Nathan Woodrow, it came to me that the solution could be creating a user defined function for the expression builder to be used in labels in the map.

Closely following the blog post instructions, I have created a file called userfunctions.py in the  .qgis2/python folder and, with a help from Nyall Dawson I wrote the following code.

from qgis.utils import qgsfunction, iface
from qgis.core import QGis

@qgsfunction(2,"python")
def map_x_min(values, feature, parent):
 """
 Returns the minimum x coordinate of a map from
 a specific composer.
 """
 composer_title = values[0]
 map_id = values[1]
 composers = iface.activeComposers()
 for composer_view in composers():
  composer_window = composer_view.composerWindow()
  window_title = composer_window.windowTitle()
  if window_title == composer_title:
   composition = composer_view.composition()
   map = composition.getComposerMapById(map_id)
   if map:
    extent = map.currentMapExtent()
    break
 result = extent.xMinimum()
 return result

After running the command import userfunctions in the python console  (Plugins > Python Console), it was already possible to use the  map_x_min() function (from the python category) in an expression to get the minimum X value of the map.

Screenshot from 2014-09-09 16^%29^%29

All I needed now was to create the other three functions,  map_x_max(), map_y_min() and map_y_max().  Since part of the code would be repeated, I have decided to put it in a function called map_bound(), that would use the print composer title and map id as arguments, and return the map extent (in the form of a QgsRectangle).

from qgis.utils import qgsfunction, iface
from qgis.core import QGis

def map_bounds(composer_title, map_id):
 """
 Returns a rectangle with the bounds of a map
 from a specific composer
 """
 composers = iface.activeComposers()
 for composer_view in composers:
  composer_window = composer_view.composerWindow()
  window_title = composer_window.windowTitle()
  if window_title == composer_title:
   composition = composer_view.composition()
   map = composition.getComposerMapById(map_id)
   if map:
    extent = map.currentMapExtent()
    break
 else:
  extent = None

 return extent

With this function available, I could now use it in the other functions to obtain the map X and Y minimum and maximum values, making the code more clear and easy to maintain. I also add some mechanisms to the original code to prevent errors.

@qgsfunction(2,"python")
def map_x_min(values, feature, parent):
 """
 Returns the minimum x coordinate of a map from a specific composer.
 Calculations are in the Spatial Reference System of the project.
<h2>Syntax</h2>
map_x_min(composer_title, map_id)
<h2>Arguments</h2>
composer_title - is string. The title of the composer where the map is.
 map_id - integer. The id of the map.
<h2>Example</h2>
map_x_min('my pretty map', 0) -> -12345.679

 """
 composer_title = values[0]
 map_id = values[1]
 map_extent = map_bounds(composer_title, map_id)
 if map_extent:
  result = map_extent.xMinimum()
 else:
  result = None

 return result

@qgsfunction(2,"python")
def map_x_max(values, feature, parent):
 """
 Returns the maximum x coordinate of a map from a specific composer.
 Calculations are in the Spatial Reference System of the project.
<h2>Syntax</h2>
map_x_max(composer_title, map_id)
<h2>Arguments</h2>
composer_title - is string. The title of the composer where the map is.
 map_id - integer. The id of the map.
<h2>Example</h2>
map_x_max('my pretty map', 0) -> 12345.679

 """
 composer_title = values[0]
 map_id = values[1]
 map_extent = map_bounds(composer_title, map_id)
 if map_extent:
  result = map_extent.xMaximum()
 else:
  result = None

 return result

@qgsfunction(2,"python")
def map_y_min(values, feature, parent):
 """
 Returns the minimum y coordinate of a map from a specific composer.
 Calculations are in the Spatial Reference System of the project.
<h2>Syntax</h2>
map_y_min(composer_title, map_id)
<h2>Arguments</h2>
composer_title - is string. The title of the composer where the map is.
 map_id - integer. The id of the map.
<h2>Example</h2>
map_y_min('my pretty map', 0) -> -12345.679

 """
 composer_title = values[0]
 map_id = values[1]
 map_extent = map_bounds(composer_title, map_id)
 if map_extent:
  result = map_extent.yMinimum()
 else:
  result = None

 return result

@qgsfunction(2,"python")
def map_y_max(values, feature, parent):
 """
 Returns the maximum y coordinate of a map from a specific composer.
 Calculations are in the Spatial Reference System of the project.
<h2>Syntax</h2>
map_y_max(composer_title, map_id)
<h2>Arguments</h2>
composer_title - is string. The title of the composer where the map is.
 map_id - integer. The id of the map.
<h2>Example</h2>
map_y_max('my pretty map', 0) -> 12345.679

 """
 composer_title = values[0]
 map_id = values[1]
 map_extent = map_bounds(composer_title, map_id)
 if map_extent:
  result = map_extent.yMaximum()
 else:
  result = None

 return result

The functions became available to the expression builder in the “Python” category (could have been any other name) and the functions descriptions are formatted as help texts to provide the user all the information needed to use them.

Screenshot from 2014-09-09 15^%39^%19

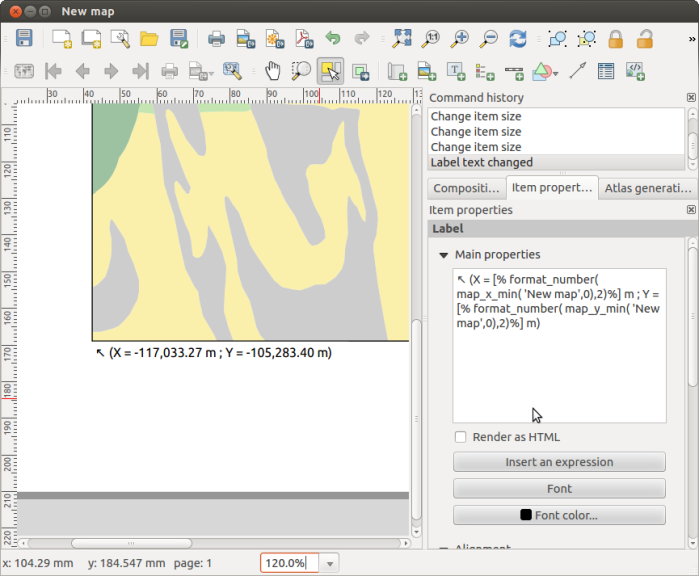
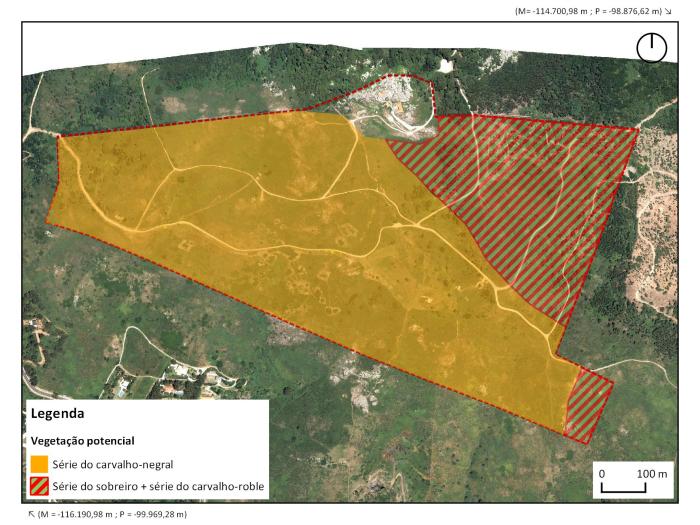
Using the created functions, it was now easy to put the corner coordinates in labels near the map corners. Any change to the map extents is reflected in the label, therefore quite useful to use with the atlas mode.

Screenshot from 2014-09-09 15^%40^%27

The functions result can be used with other functions. In the following image, there is an expression to show the coordinates in a more compact way.

Screenshot from 2014-09-09 15^%43^%55

There was a setback… For the functions to become available, it was necessary to manually import them in each QGIS session. Not very practical. Again with Nathan’s help, I found out that it’s possible to import python modules at QGIS startup by putting a startup.py file with the import statements in the .qgis2/python folder. In my case, this was enough.

import userfunctions

I was pretty satisfied with the end result. The ability to create your own functions in expressions demonstrates once more how easy it is to customize QGIS and create your own tools. I’m already thinking in more applications for this amazing functionality.

UT 9 - Qta da Peninha - Vegetação potencial

You can download the Python files with the functions HERE. Just unzip both files to the .qgis2/python folder, and restart QGIS, and the functions should become available.

Disclaimer: I’m not an English native speaker, therefore I apologize for any errors, and I will thank any advice on how to improve the text.

Multiple format map series using QGIS 2.6 – Part 1

EN | PT

As always, the new QGIS version (QGIS 2.6 Brigthon) brings a vast new set of features that will allow the user to do more, better and faster than with the earlier version. One of this features is the ability to control some of the composer’s items properties with data (for instance, size and position). Something that will allow lots of new interesting usages. In the next posts, I propose to show how to create map series with multiple formats.

In this first post, the goal is that, keeping the page size, the map is created with the most suitable orientation (landscape or portrait) to fit the atlas feature. To exemplify, I will be using the Alaska’s sample dataset to create a map for each of Alaska’s regions.

I have started by creating the layout in one of the formats, putting the items in the desired positions.

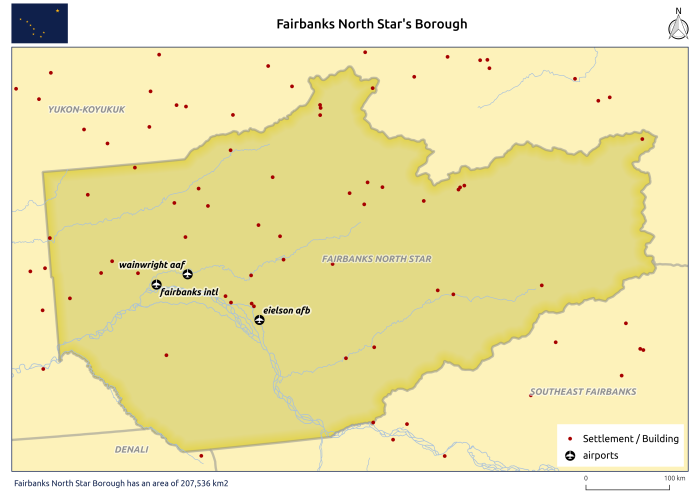
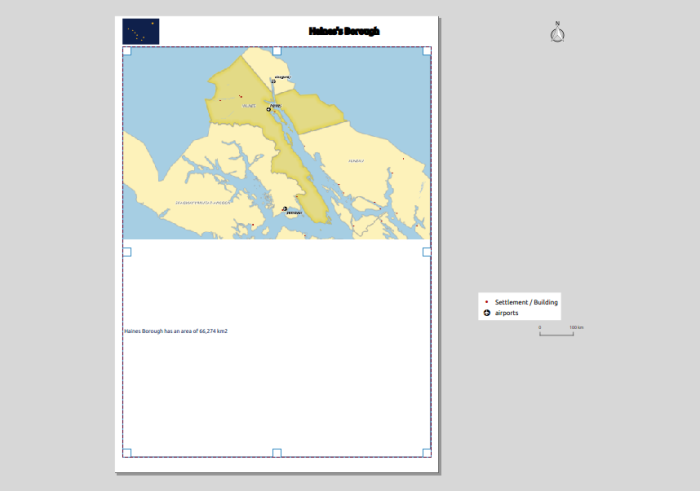
mapa_base_atlas

To control the page orientation with the atlas feature, in the composition tab, I used the following expression in the orientation data defined properties:

CASE WHEN bounds_width( $atlasgeometry ) >=  bounds_height( $atlasgeometry ) THEN 'landscape' ELSE 'portrait' END

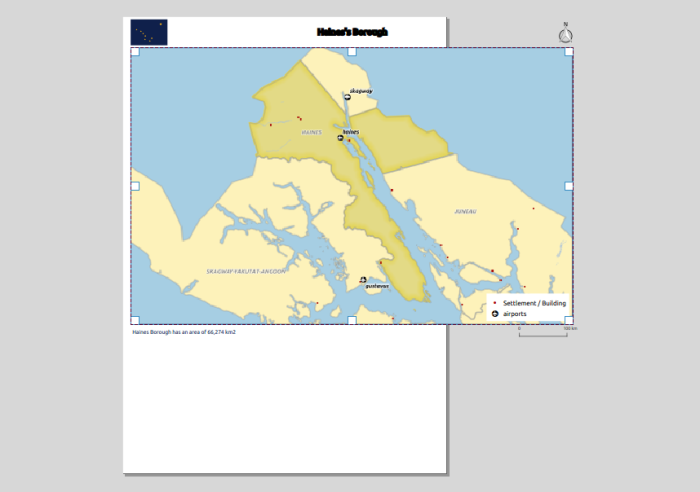
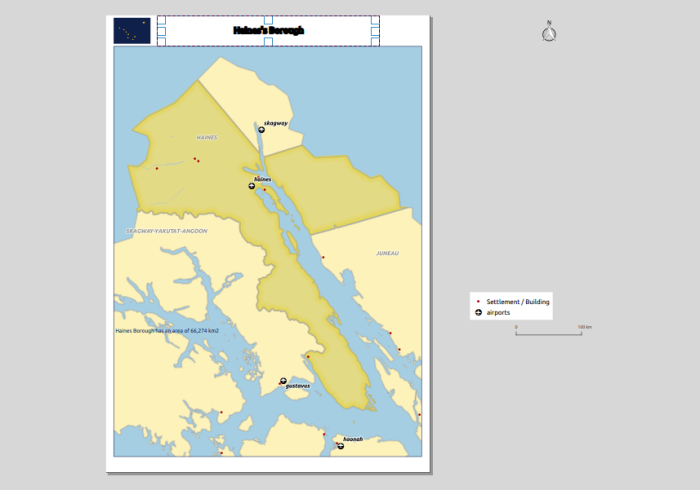
Using the atlas preview, I could verify that the page’s orientation changed according to the form of the atlas feature. However, the composition’s items did not follow this change and some got even outside the printing area

Screenshot from 2014-11-08 23:29:49

To control both size and position of the composition’s items I had in consideration the A4 page size (297 x 210 mm), the map margins ( 20 mm, 5 mm, 10 mm, 5 mm) and the item’s reference points.

For the map item, using the upper left corner as reference point, it was necessary to change it’s height and width. I knew that the item height was the subtraction of the top and bottom margins (30 mm) from the page height, therefore I used the following expression:

(CASE WHEN  bounds_width(  $atlasgeometry ) >=  bounds_height( $atlasgeometry) THEN 297 ELSE 210 END) - 30

Likewise, the expression to use in the width was:

(CASE WHEN  bounds_width(  $atlasgeometry ) >=  bounds_height( $atlasgeometry) THEN 210 ELSE 297 END) - 10

Screenshot from 2014-11-09 00:02:15

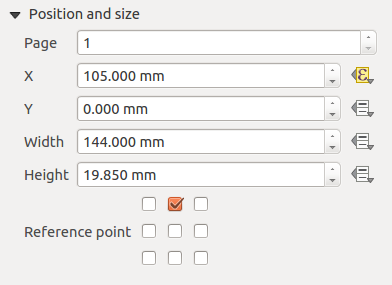
The rest of the items were always at a relative position of the page without the need to change their size and therefore only needed to control their position. For example, the title was centered at the page’s top, and therefore, using the top-center as reference point, all that was needed was the following expression for the X position:

Screenshot from 2014-11-09 00:13:17

(CASE WHEN  bounds_width(  $atlasgeometry ) >=  bounds_height( $atlasgeometry)  THEN 297 ELSE 210 END)  / 2.0

Screenshot from 2014-11-09 00:30:57

On the other hand, the legend needed to change the position in both X and Y. Using the bottom-right-corner as reference point, the X position expression was:

(CASE WHEN  bounds_width(  $atlasgeometry ) >=  bounds_height( $atlasgeometry) THEN 297 ELSE 210 END) - 7

And for the Y position:

(CASE WHEN  bounds_width(  $atlasgeometry ) >=  bounds_height( $atlasgeometry) THEN 210 ELSE 297 END) - 12

Screenshot from 2014-11-09 00:47:28

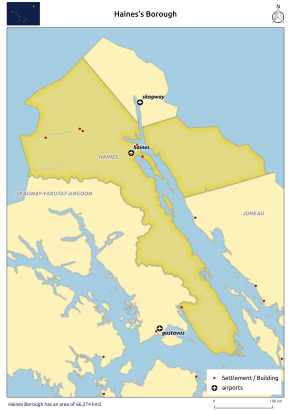
For the remaining items (North arrow, scalebar, and bottom left text), the expression were similar to the ones already mentioned, and, after setting them for each item, I got a layout that would adapt to both page orientation.

output_9

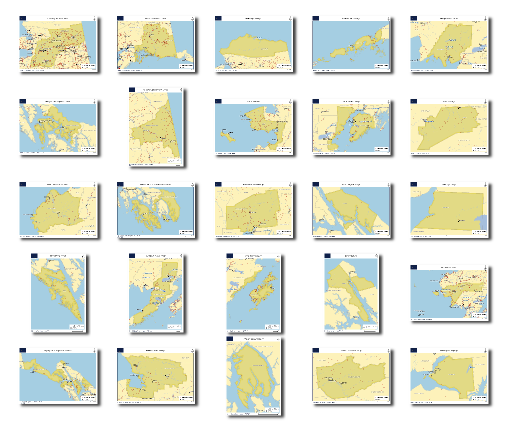
From that point, printing/exporting all (25) maps was one click away.

mosaico_regioes

In the next post of the series, I will try to explain how to create map series where it’s the size of the page that change to keep the scale’s value of the scale constant.

Instalar duas versões de QGIS em Linux

QGIS24_QGISmaster

Em altura de testes à versão em desenvolvimento do QGIS (versão master), dá jeito  ter também instalada a última versão estável do QGIS. Em windows isso não representa um problema, uma vez que se podem instalar várias versões do QGIS em paralelo (tanto via Osgeo4w como standalone). Em linux, o processo não é tão directo pelo facto da instalação se realizar por obtenção de diversos pacotes disponíveis nos repositórios, não sendo por isso possível instalar mais do que uma versão sem que se originem quebras de dependências. Assim, instalando a versão estável através dos repositórios, as alternativas para instalação da versão em desenvolvimento são:

  • Compilar o QGIS master do código fonte;
  • Instalar o QGIS master num docker;
  • Instalar o QGIS master numa máquina virtual;

Neste artigo vou mostrar como compilar o código fonte em Ubuntu 14.04. Afinal não é tão difícil quanto parece. Meia dúzia de comandos e um pouco de paciência e vai-se lá. Usei como base as indicações do ficheiro INSTALL.TXT disponível no código fonte com umas pequenas alterações.

Instalar todas as dependências necessárias

Num terminal correr o seguinte comando para instalar todas as dependências e ferramentas necessárias à compilação do QGIS. (adicionei o ccmake e o git ao comando original)

sudo apt-get install bison cmake doxygen flex git graphviz grass-dev libexpat1-dev libfcgi-dev libgdal-dev libgeos-dev libgsl0-dev libopenscenegraph-dev libosgearth-dev libpq-dev libproj-dev libqscintilla2-dev libqt4-dev libqt4-opengl-dev libqtwebkit-dev libqwt5-qt4-dev libspatialindex-dev libspatialite-dev libsqlite3-dev lighttpd pkg-config poppler-utils pyqt4-dev-tools python-all python-all-dev python-qt4 python-qt4-dev python-sip python-sip-dev spawn-fcgi txt2tags xauth xfonts-100dpi xfonts-75dpi xfonts-base xfonts-scalable xvfb cmake-curses-gui

Configurar o ccache

Este passo permite optimizar a compilação e tornar a compilação mais rápida nas próximas vezes que se fizer:

cd /usr/local/bin
sudo ln -s /usr/bin/ccache gcc
sudo ln -s /usr/bin/ccache g++

 Obter o código fonte do Github

O código fonte pode ser colocado numa pasta à escolha de cada um. Seguindo a sugestão do ficheiro de instruções acabei por colocar tudo na minha pasta home/alexandre/dev/cpp.

mkdir -p ${HOME}/dev/cpp
cd ${HOME}/dev/cpp

Já dentro da pasta home/alexandre/dev/cpp, podemos obter o código do qgis executando o seguinte comando git:

git clone git://github.com/qgis/QGIS.git

Nota: Se pretendesse fazer alterações ao código e experimentar se funcionava, então deveria fazer o clone do fork do qgis do meu próprio repositório, ou seja:

git clone https://github.com/SrNetoChan/Quantum-GIS

Preparar directorias de compilação e instalação

O código fonte tem de ser compilado e instalado em locais próprios para evitar conflitos com outras versões do QGIS. Por isso, há que criar uma pasta para efectuar a instalação:

mkdir -p ${HOME}/apps

E outra onde será feita a compilação:

cd QGIS
mkdir build-master
cd build-master

Configuração

Já na pasta build-master damos início ao processo de compilação. O primeiro passo é a configuração, onde vamos dizer onde queremos instalar o QGIS master. Para isso executamos o seguinte comando (não esquecer os dois pontos):

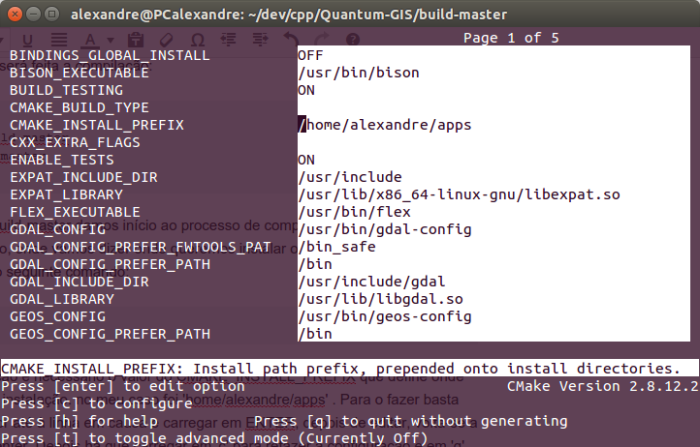
ccmake ..

Na configuração é necessário alterar o valor do CMAKE_INSTALL_PREFIX que define onde vai ser feita a instalação, no meu caso usei a pasta já criada ‘home/alexandre/apps’ . Para editar o valor há que mover o cursor até à linha em causa e carregar em [enter], depois de editar, volta-se a carregar em [enter]. Depois há que carregar em [c] para refazer a configuração e depois em ‘g’ para gerar a configuração.

Screenshot from 2014-10-08 23:33:39

 Compilação e instalação

Já com tudo configurado resta compilar o código e depois instalá-lo:

make
sudo make install

Nota: Estes dois passos podem demorar um bocadinho, principalmente na primeira vez que o código for compilado.

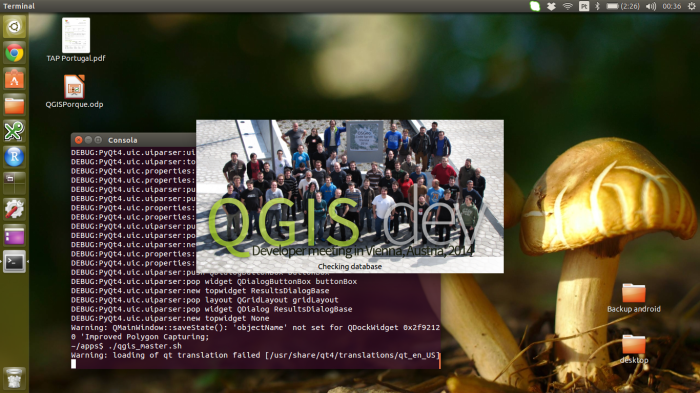
Depois de instalado podemos correr o QGIS master a partir da pasta de instalação:

cd ${HOME}/apps/bin/
export LD_LIBRARY_PATH=/home/alexandre/apps/lib
export QGIS_PREFIX_PATH=/home/alexandre/apps
${HOME}/apps/bin/qgis

Para se tornar mais cómodo, podemos colocar os últimos 3 comandos num ficheiro .sh e gravá-lo num local acessível (desktop ou home) para executarmos o qgis sempre que necessário.

Screenshot from 2014-10-09 00:36:52

UPDATE: Actualizar a versão master

Como já foi referido num comentário, a versão em desenvolvimento está constantemente a ser alterada, por isso para testar se determinados bugs foram entretanto corrigidos há que a actualizar. Trata-se de um processo bastante simples. O primeiro passo é actualizar o código fonte:

cd ${HOME}/dev/cpp/qgis
git pull origin master

E depois é voltar a correr a compilação (que desta feita será mais rápida):

cd build-master
ccmake ..
make
sudo make install

South-East QGIS User Group – Writeup

Since helping to organise the inaugural meeting in September 2013, this was the first UK QGIS South-East UG meeting which piggy-backs off the success of the Scottish and Welsh UG meetings.

Putting an agenda together isn’t the easiest thing to do at the best of times and especially given that the use of QGIS here in the UK is still in its infancy but thankfully without much need for pleading many kind people came together to help out and make the day a great success.

Imperial College hosted the event for us and everyone one agreed that the facilities were fantastic. A special thanks needs to go to Claudia Vitolo for arranging everything for us at Imperial. There was a good turnout with about 55 people turning up, with a real mix of public, private and academic backgrounds.

imperial_1

David McDermott started off proceedings with a talk about Atlas and Map Production. He cleanly illustrated to the audience through screenshots how Surrey Heath Borough Council are using this fantastic feature of 2.2 to produce lots of maps, quickly, efficiently and importantly eye-pleasing.

imperial_2

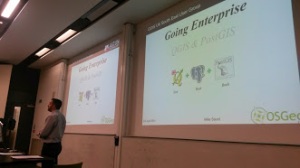
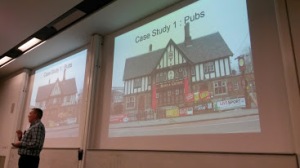
Mike Saunt demonstrated through a mixture of presentation and live demo a series of tweaks within QGIS and using a bit of SQL in PostGIS, how QGIS can be an Enterprise GIS tool. For those in the audience that new to QGIS or looking for alternative GIS solutions were keen to ask questions about the QGIS/PostGIS architecture which Mike was very happy to answer, sighting many case examples.

imperial_3

Jerry Clough gave a well received talk on OpenStreetMap and promoted a lot of conversation. Jerrys’ talk was a real mixed bag of factoids and tips on OSM in general and using it within QGIS.

Andrew Bell gave the audience a treat by demonstrating how with some simple PostGIS SQL you could within QGIS draw a line or route (from A to B) which would automatically buffer and select features from the Ordnance Survey PoI (Points of Interest) layer that fell within the buffer. All very simple but very effective process. Andrew admitted that this had a lot of scope and could be adapted for Emergency Planning for example.

View presentation here

The afternoon sessions saw two workshops;

Pete Wells from Lutra gave a whistle stop run through of using Python and QGIS, and went as far as producing a very simple plugin all within the space of an hour and ten minutes. It was a well attended talk and the sort of workshop that future user groups should try to repeat.

The Ordnance Survey did an Introduction to QGIS using OS Opendata and was equally well attended as Pete Wells workshop, as both workshops ran at the same time. The talk was loosely based on the successful OS MasterClasses that have been run over the past few years.

The schedule of the day quickly slipped, mainly due to the great audience participation at the end of the presentations. As a result the afternoon workshops, ‘its your floor’ and discussion sessions were shortened so that a 4pm finish was achievable.

Its your floor was a bit of a wild card slot in the days agenda. Prior to the event the attendees were asked  if they wanted to take to the stage and chat about what they were doing to QGIS, effectively 5 slides in 5 minutes. Two brave souls stepped upto the mark and gave informative but lightning talks about what they had been up to. This is certainly a part of the agenda that the South-East region will be repeating again.

The day ended with a lively debate about the role and future of the UK QGIS user group and it might be that moving forward such a debate becomes an earlier item on the days agenda.

One of the discussion points was on the cost of running future events. Based on an online poll conducted earlier on this year and feedback from the Scottish group, it was clear that for the group to continue future events will probably longer be free and as such a minimal donation would be required to attend. The true cost of hosting an event is probably more than most imagine. The single biggest cost is catering, in the case of this meeting and the inaugural meeting back in September 13, the combined cost just for catering was in excess of £1400. Luckily in both cases and in fact in all of the user group meetings that have occurred catering and venue hire costs have been met through sponsorship. However such kind support from private companies will not last indefinitely. The exact minimum donation cost may vary from event to event, depending on venue hire costs and catering.

Over a series of discussion topics a few themes kept on popping up which put into question the role of the user group. Behind the scenes of the user group, as with any user group or community there are also people busy working away to do all sorts of things in the background. The user group has a loose working community which is referred to as regional leads but in fact these regional leads are not standing alone but a few people supporting them. This working group has been discussing how we can work more closely with the core QGIS project and hopefully soon we will be able to clearly define how we achieve this. Where this thought process is going is that the role of the user group is just that, a user group and not a QGIS developer group. Clearly some people within the wider UK QGIS UG will be more developer minded than others and as such would be encouraged to participate the development of QGIS. Others may want to help out with updating manuals or bug hunting. While others might not be interested in any of the above and just want to create maps, data or GIS processes and share these with the group which should equally be encouraged.  We as a user group should be there to encourage any of the above users.

Simon Miles


1st UK QGIS user group meeting -Wales

This is just an interim post, the full blog is being written up by Kevin Williams and You Tube videos are being put together by Shaun Lewis. To wet your appetite, you can see the introduction presentation and agenda on SlideShare.

Update 27th January 2014 :-

A long overdue update.

Cymru am byth!

The event was a big success!  We had around 50 people attend from various organisations throughout Wales.  The event was kindly sponsored by Exegesis (http://www.esdm.co.uk/) and Astun Technology (www.http://astuntechnology.com/)  both of which gave excellent presentations.

Huge thanks to Shaun Lewis and his manager, Paul Funnell for hosting the event in such a professional manner.  The venue and technology were second to none.

There’s been lots of feedback via email and phonecalls, together with a survey carried out by Shaun Lewis of Brecon Beacons National Park.

From all of the comments, the future is bright for QGIS in Wales.  There is an ever-increasing interest and numbers of users, not just in QGIS but in the full SDI provided by QGIS, postgis, geoserver etc.  I can see the group incorporating elements of the open source stack to give a more detailed advice, collaboration and guidance, but let’s walk before we can run!

-Kevin

Watch this space for more news from around Wales in the QGIS arena!


Scottish QGIS User Group 19th March 2014

scottish thistleThe Scottish QGIS user group meeting is happening on 19th March 2014 in Stirling at the Stirling Management Centre.  Doors open at 9:30 with a 10:00 start and a planned finish of 16:00.  Registration is through Eventbrite and there are 50 places available working on a first come, first served basis.

Details on how to get to the Stirling Management Centre are available here.

The agenda will be published a bit closer to the time once speakers have been finalised.  If you would like to present let me (Ross McDonald) know as it would be good to have a mix of input to the day.  There are both 20 minute and “lightning talk” 5-10 minute slots available.

A big thank-you to thinkWhere for hosting this first QGIS user group event in Scotland.

If you want two days of geo discussion then think about attending the AGI Scotland – Future Cities event in Glasgow the day before.  Check the AGI Scotland website for more details.


Scottish QGIS User Group

scottish flagThe inaugural Scottish QGIS user group meeting is being planned and organised for mid-March next year.  If you would like to participate, I am looking for user presentations, case studies, map displays and practical demos and tutorials.

The event will be held in Stirling and will be a full day of networking and open-source geo-goodness.  Full details will go out in the new year and will be available through Eventbrite, this blog, the Google+ group, Twitter and probably a heap of other channels.  After the success of the English and the Welsh events we are hoping the Scottish event will raise the bar even higher.  Please use the contact form to get in touch with me, Ross McDonald.


OS OpenData Workshop – QGIS in the Classroom

Last week I attended an Ordnance Survey OpenData MasterClass in Exeter. This was one of a series of seven masterclasses that the Ordnance Survey were running across the country. They were aimed at letting people know how to get the best of the  OpenData products that they provide.

The workshop was delivered in a format of combining theory and practical sessions. They were aimed at people of various experience; from those new to working with location data to the more advanced users wanting to brush up on their skills.

What was encouraging from a QGIS point of view was that a lot of the course was taught using QGIS 2.0.  After an interesting introduction to the history and current standing of OpenData by Ian Holt we were given our first taste of QGIS. Ably led by Steve Kingston we were shown:

  • How to navigate around QGIS;

  • Import a range of vector and raster datasets (thankfully pre-downloaded);

  • Build virtual rasters (very useful if you’re dealing with lots of OS tiles);

  • Merge shapefiles into one layer

  • Create thematic maps from LSOA boundaries and ONS data (like the one below)  - here I learnt  you can now load non-geographic data from a csv straight into QGIS without using a csvt file, yay!

imd_compressed

After Lunch and a quick insight by Chris Parker  into the next Geovation Challenge , Chris Wesson from the Carto Design team at the OS gave a cartographic design workshop. This started off with a talk about the basic design principles behind cartography and how you should bear these in mind when making a map.

He then showed us how to import vector map district vector data and then style these in a various ways –  I particularly found his tips on creating road casing useful. Some of the maps being were produced were of a really good standard, especially when you this was many people’s first time using a GIS of any sort.

I thought that this was a really worthwhile experience and would recommend going to one if you get the chance in the future (according to their website there are still masterclasses to come in York and Nottingham). I learnt a fair bit myself as I always think it’s useful to watch someone else use a product that you’ve used in isolation. They might do something that you’ve never seen before that’s loads quicker or show you a hidden feature you’ve not come across.

It was encouraging to see people of various backgrounds present, parish councils in particular. As someone who works for a local authority that has many Parishes i’m very keen to promote the use of open data by parishes and local groups and get them using QGIS, etc

In the New Year I’m going to look into having a QGIS South West event and hope to reach out to all  types of QGIS users across the region. I’ll keep you posted on the exact details via the Google+ group but if you read this and are in or around the South West and want to share your experiences of using QGIS (no matter how big or small) then please get in touch.

That’s it for now. Just leaves me to thank all the people that made the OS Masterclasses possible I’m sure they’ve been a success so hopefully they’ll be even more next year to look forward to!
Matt


Fall/Winter QGIS (2.0), PostGIS and WebGIS training course schedule

faunaliagis

QGIS 64bit for Windows is ready to test

faunaliagis

Happy New Year

and thank you for a great 2012!

The view counter shows a staggering 250,000 views for last year. If that isn’t a reason to celebrate!

Here’s a quick recap with the top ten posts last year which were split between the two main topics pgRouting and QGIS:

  1. A Beginner’s Guide to pgRouting
  2. Table Joins – A New Feature in QGIS 1.7
  3. How to Specify Data Types of CSV Columns for Use in QGIS
  4. QGIS Server on Windows7 Step-by-step
  5. Osm2po Part 2 – PgRouting on OSM the Easy Way
  6. An osm2po Quickstart
  7. QGIS Server on Ubuntu Step-by-step
  8. Converting MXD to QGIS Project File
  9. Stamen Maps for QGIS
  10. Mapping Density with Hexagonal Grids

All the best for 2013!


IAC – International Astronomy Conference 2011

Today I attended the IAC conference that was held this week in Cape Town. I could write a long essay about my experience there but I believe the image below will do a better job   PS. I also touched a moon rock!

Linfiniti goes scrummy

We just bought a nice big whiteboard at Linfiniti HQ so that we can really use SCRUM project management to good effect. Now if Rudi could just get a few more of those post-its into the Done! column, we can all go home and relax for the weekend :-)

Rudi showing off our new scrum board!

Rudi showing off our new scrum board!

pixelstats trackingpixel

  • <<
  • Page 6 of 6 ( 113 posts )
  • uncategorized

Back to Top

Sustaining Members