Related Plugins and Tags

QGIS Planet

Call for applications: QGIS Manual Update and Improvement

Dear QGIS community,

In the last few years we have been steadily improving the amount of funding we are able to accumulate in the QGIS project. Our goal in obtaining funding is always to ‘make QGIS better’. Up until now we have focussed funding on high profile aspects of the project: Funding regular hackfests, paying for bug fixing work prior to releases, funding infrastructure such as servers, domain name registrations etc.

With improved funding levels we now have the opportunity to also start addressing some of the many less obvious components of QGIS that badly need attention, but often don’t attract volunteers. In our PSC meetings it was agreed that we would start this initiative by funding one or more experienced users to improve the QGIS manual. Here, briefly, is the vision:

As an experienced QGIS user you currently have two main resources: The QGIS manual and the QGIS training manual. In this call we focus on the manual, which is already an excellent resource on available functionality in QGIS.

  • The challenge is to keep it synchronised with all new features, and examples and figures often run the risk of being out of date. This is the case already for several chapters of the manual for the latest QGIS releases and we want to start optimizing this.

    We would love to see the QGIS manual providing a readable narrative explaining the purpose (with images and illustrations if needed) of each feature. It can also provide short sample snippet where useful, which in many cases you can simply cut and paste into your code and then tweak to get started.

    For this funded effort we are thus seeking one or more individuals to lay the foundation for this work:

    * verify and improve the norms and guidelines of the documentation and
    especially its update process together with the PSC.
    * update the manual to include all features that are available within the latest QGIS release (2.12).
    * update figures, if necessary according to the defined guidelines (size, desktop-environment, resolution,…).
    * populate the manual with further short examples and improved descriptions, without competing with the training manual.
    * do these in a nice clear and concise writing style, taking inspiration from other software manuals, if available.

    If you think this is something you are able to do, please contact the QGIS PSC using this form and let us know!

    Best wishes,
    Otto


Feature freeze is now in effect for QGIS 2.12

A note from Jürgen Fischer, our release manager, heralds the start of preparations for QGIS 2.12. We depend all users out there to test it and report issues so we can make the best possible release. An edit version of the email to the developer mailing list from Jürgen follows:

Hi,

I’d like to remind everyone that the 2.11 development cycle ended yesterday at
12:00 UTC. We are now in feature freeze on the road to the 2.12 release on 2015-10-23

Now we (the community) need to prepare QGIS for the release. No new features will be added anymore.

  • Users, if not already begun, should now start
    extensive testing of master and report bugs on the QGIS hub.
  • Developers should move their focus from creating new features to fixing bugs.
  • Translators can can continue their work (we maintain all our translations on transifex now).

The nightly builds of QGIS testing available for Windows (download here), Linux (Debian and Ubuntu) and Mac
OS X (download here) are now effectively snapshots of what’s going to be released.  Except of course
for the bugs that are going to be fixed until release day.  For Windows there will also be weekly release candidates of the standalone installer. Lets keep up working together to make 2.12 another great release.

Jürgen


Registration open for QGIS hackfest in Gran Canaria, November 2015

Dear QGIS developers

Collage Las Palmas de Gran Canaria

We will be holding our 14th hackfest in Gran Canaria over November 5th – November 8th, 2015. You can read more about the plans for this meet up and register your intention to attend on the hackfest wikipage. This is a developer centric hackfest where we invite coders, documenters, testers, graphic artists, translators and anyone else who is interested in improving QGIS for the benefit of all our users. General users of QGIS are of course also welcome to join us, but we will not be holding any specific user-centric workshops or talks like we do at our user conferences.

The QGIS hackfests are an important aspect of the project, playing an key role in facilitating collaboration and planning within the community of developers and contributors who combine their efforts to put out three releases of QGIS each year. We rely on the goodwill and sponsorship of our grateful users and their host organisations to financially sustain the QGIS project. If you are in a position of influence, we ask you to please consider sponsoring QGIS to support this hackfest and other project related activities.

We would like to thank Pablo Fernández Moniz and his co-organisers from Universidad de las Palmas de Gran Canaria for organising the event. If you are able to support his event organisation activities in any way, please contact him at 

We look forward to seeing your all there!

The QGIS Team


Call for applications: QGIS API Documentation Improvement

Dear QGIS DevelopersIn the last few years we have been steadily improving the amount of funding we are able to accumulate in the QGIS project. Our goal in obtaining funding is always to ‘make QGIS better’. Up until now we have focussed funding on high profile aspects of the project: Funding regular hackfests, paying for bug fixing work prior to releases, funding infrastructure such as servers, domain name registrations etc.

With improved funding levels we now have the opportunity to also start addressing some of the many less obvious components of QGIS that badly need attention, but often don’t attract volunteers. In our July 2015 PSC meeting it was agreed that we would start this initiative by funding one or more developers to improve the python documentation in QGIS. Here, briefly, is the vision:

Lets take our inspiration from Qt. As a foundational library for QGIS, I have always loved the fact that Qt4 is so well documented. Take a look at this for example – http://doc.qt.io/qt-4.8/qlabel.html#details

The Qt4 documentation provides a readable narrative explaining the purpose (with images and illustrations if needed) of each class. It also provides a code snippet, which in many cases you can simply cut and paste into your code and then tweak to get started.

As a PyQGIS programmer you have two main resources: The QGIS Python cookbook and the QGIS C++ API documentation. The cookbook is an excellent resource, but it is hard to keep it synchronised with the code base – so examples often run the risk of being out of date, or don’t leverage new functionality that makes its way into the code base. The C++ documentation is good in terms of coverage, but it often lacks detail and as a python programmer you may find it a bit off putting since the text is littered with examples using pointers. Also, the C++ documentation isn’t always a one to one match for python users, and doesn’t explain python specific behaviour such as how ownership is passed around with returning objects.

Wouldn’t it be nice if the C++ API documentation also included the content that is in the python cookbook? And wouldn’t it be nice if the C++ documentation became the C++ *and* Python API documentation – catering for users of both programming languages and providing for a single point of reference and maintenance? Even better the python documentation would live right in the C++ code, so that anytime someone touches the code base they can easily maintain the documentation without needing to jump through a lot of hoops.

For this funded effort we are thus seeking one or more individuals to lay the foundation for this work:

  • establish norms and guidelines for improving the doxygen API docs so that each documented resource can include both python and C++ documentation.
  • port the cookbook content over to the API documentation
  • create doxygen pages to provide a starting point for python programmers to be able to carry out common activities they need
  • populate the API docs with Python examples and improved descriptions
  • do these in a nice clear and concise writing style, again taking inspiration from the fine work that Qt has done
  • perhaps do something really smart to generate docs from the SIP API and incorporate it into our doxygen doctree?

If you think this is something you are able to do, please contact the QGIS PSC using this form and let us know!

Click here to apply here if you are interested in this work


Point release QGIS 2.8.3 ‘Wien’ is ready!

We are very pleased to announce the point release of QGIS 2.8.3 ‘Wien’. Wien is German for ‘Vienna’ – host city to our developer meet up in November 2009 and again in March 2014.

As point release it contains no new features, but 150 changes to fix bugs (see https://github.com/qgis/QGIS/compare/final-2_8_2…final-2_8_3 for a full list).

Even when only fixes are added to software they introduce the possibility of new bugs – if you encounter any problems with this release, please file a ticket on the QGIS Bug Tracker (http://hub.qgis.org/). Please consult the existing and closed issues there before filing any new ones.

The source code and binaries for Windows, Debian and Ubuntu are already available via the large download link on our home page (http://qgis.org/). More packages will follow as soon as the package maintainers finish their work. Please revisit the page if your platform is not available yet.

Thanks

We would like to thank the developers, documenters, testers and all the many folks out there who volunteer their time and effort (or fund people to do so).

From the QGIS community we hope you enjoy this release! If you wish to donate time, money or otherwise get involved in making QGIS more awesome, please wander along to http://qgis.org and lend a hand!

Finally we would like to thank our official sponsors for the invaluable financial support they provide to this project:

Gold Sponsor:
Asia Air Survey, Japan (http://www.asiaairsurvey.com/)

Silver Sponsors:
Sourcepole AG, Switzerland (http://www.sourcepole.com/)
Office of Public Works, Ireland, Ireland (http://www.opw.ie/)
AGH University of Science and Technology, Poland (http://www.agh.edu.pl/en)
State of Vorarlberg, Austria (http://www.vorarlberg.at/)

Bronze Sponsors:
Nicholas Pearson Associates, UK (http://www.npaconsult.co.uk/)
QGIS Poland, Poland (http://qgis-polska.org/)
http://www.terrelogiche.com, Italy (http://www.terrelogiche.com)>
http://www.geosynergy.com.au, Australia (http://www.geosynergy.com.au/)
Gaia3D, Inc., South Korea (http://www.gaia3d.com/)
Royal Borough of Windsor and Maidenhead, UK (http://www.rbwm.gov.uk/)
Chartwell Consultants Ltd., Canada (http://www.chartwell-consultants.com/)
Trage Wegen vzw, Belgium (http://www.tragewegen.be/)
GFI – Gesellschaft für Informationstechnologie mbH, Germany (http://www.gfi-gis.de/)
GKG Kassel,(Dr.-Ing. Claas Leiner), Germany (http://www.eschenlaub.de/)
GIS-Support, Poland (http://www.gis-support.com/)
ADLARES GmbH, Germany (http://www.adlares.com/)
http://www.molitec.it, Italy (http://www.molitec.it/)
http://www.argusoft.de, Germany (http://www.argusoft.de/)
Customer Analytics, USA (http://www.customeranalytics.com/)
Avioportolano Italia, Italy (http://www.avioportolano.it/)
Faculty of Geology, Geophysics and Environmental Protection,
AGH University of Science and Technology, Poland (http://www.wggios.agh.edu.pl/en)
Urbsol, Australia (http://www.urbsol.com.au/)
MappingGIS, Spain (http://www.mappinggis.com/>)
GIS3W, Italy (http://www.gis3w.it/)
Lutra Consulting, UK (http://www.lutraconsulting.co.uk/)

A current list of donors who have made financial contributions large and small to the project can be seen on our donors list (http://qgis.org/en/site/about/sponsorship.html#list-of-donors).

If you would like to become and official project sponsor, please visit our sponsorship page for details. Sponsoring QGIS helps us to fund our six monthly developer meetings, maintain project infrastructure and fund bug fixing efforts (http://qgis.org/en/site/about/sponsorship.html#sponsorship).

QGIS is Free software and you are under no obligation to pay anything to use it – in fact we want to encourage people far and wide to use it regardless of what your financial or social status is – we believe empowering people with spatial decision making tools will result in a better society for all of humanity.

Sponsoring QGIS helps us to fund our six monthly developer meetings, maintain project infrastructure and fund bug fixing efforts.

Happy QGISing!

Regards,

The QGIS Team!


QGIS 2.10 ‘Pisa’ released!

We are very pleased to announce the release of QGIS 2.10 ‘Pisa’. Pisa was the host city to our developer meet up in March 2010.

Latest Release

This is another release following our four monthly schedule.  It again brings many nice new features to QGIS.  With the release of 2.10 the previous release 2.8 ‘Wien’, which is designated a long term release (LTR) is moved to the long term package repositories and is the first to arrive there.  If you are working in a production environment where you wish to be more conservative about rolling out new features to your users, you will probably prefer those. Of course going with the feature frozen LTR also means that you’ll have to learn
to do without all the nice new things introduced in 2.10 and above until the next long term is released next year.

New Features in QGIS 2.10 ‘Pisa’

QGIS 2.10 includes many great new features, tweaks and enhancements to make the most popular Free desktop GIS even more feature filled and useful.  Visit the visual changelog that highlights some of the new additions (http://qgis.org/en/site/forusers/visualchangelog210/index.html).

Whenever new features are added to software they introduce the possibility of new bugs – if you encounter any problems with this release, please file a ticket on the QGIS Bug Tracker (http://hub.qgis.org).

The source code and binaries for Windows, Debian and Ubuntu are already available via the large download link on our home page: http://qgis.org.  More packages will follow as soon as the package maintainers finish their work. Please revisit the page if your platform is not available yet.

Thanks

We would like to thank the developers, documenters, testers and all the many folks out there who volunteer their time and effort (or fund people to do so).

From the QGIS community we hope you enjoy this release! If you wish to donate time, money or otherwise get involved in making QGIS more awesome, please wander along to qgis.org and lend a hand!

Finally we would like to thank our official sponsors for the invaluable financial support they provide to this project:

GOLD Sponsor: Asia Air Survey, Japan
SILVER Sponsor: Sourcepole AG, Switzerland
SILVER Sponsor: State of Vorarlberg, Austria
SILVER Sponsor: Office of Public Works, Ireland, Ireland
BRONZE Sponsor: GeoSynergy, Australia
BRONZE Sponsor: Gaia3D, South Korea
BRONZE Sponsor: Royal Borough of Windsor and Maidenhead, UK
BRONZE Sponsor: Chartwell Consultants Ltd, Canada
BRONZE Sponsor: Trage Wegen vzw, Belgium
BRONZE Sponsor: GFI – Gesellschaft für Informationstechnologie mbH, Germany
BRONZE Sponsor: GKG Kassel,(Dr.-Ing. Claas Leiner), Germany
BRONZE Sponsor: GIS-Support, Poland
BRONZE Sponsor: ADLARES GmbH, Germany
BRONZE Sponsor: www.molitec.it, Italy
BRONZE Sponsor: www.argusoft.de, Germany
BRONZE Sponsor: Customer Analytics, USA
BRONZE Sponsor: Avioportolano Italia, Italy
BRONZE Sponsor: Faculty of Geology, Geophysics and Environmental Protection, AGH, University of Science and Technology, Poland
BRONZE Sponsor: Urbsol, Australia
BRONZE Sponsor: MappingGIS, Spain
BRONZE Sponsor: GIS3W, Italy
BRONZE Sponsor: Lutra Consulting, UK
BRONZE Sponsor: www.openrunner.com, France

A current list of donors who have made financial contributions large and small to the project can be seen on our donors list. If you would like to become and official project sponsor, please visit our sponsorship page for details. Sponsoring QGIS helps us to fund our six monthly developer meetings, maintain project infrastructure and fund bug fixing efforts.

QGIS is Free software and you are under no obligation to pay anything to use it – in fact we want to encourage people far and wide to use it regardless of what your financial or social status is – we believe empowering people with spatial decision making tools will result in a better society for all of humanity.

Happy QGISing!

Regards,

The QGIS Team!


Ti piace avere QGIS ben tradotto in italiano? Ora puoi contribuire

Avere tutto QGIS, incluso il programma, i manuali e il sito web, tradotti in italiano è una bella comodità; questo richiede uno sforzo notevole, per cui il tuo aiuto è essenziale. Fai una donazione tramite: http://qgis.it/#translation

Importing CSV files into PostgreSQL using the DB Manager in QGIS

There is very useful tool in QGIS that can import very large CSV files into PostgreSQL rapidly and reliably. The DB Manager’s “Import Vector Layer” tool. Contrary to its highly misleading title it can import CSV files as well. Open the DB Manager (menu Database – DB Manager). Then select the database where you want to store your table and click the “Import layer/file” icon.

Icon_to_ClickFrom the Import Vector Layer GUI, locate our CSV file on disk and enter the name of your new table in the Table box and click OK. Yes, it’s that simple. Proceeding this, you may need to select an text encoding scheme, files created on Windows often use ISO-8859-1 (Latin-1) instead of UTF-8 encoding. In my case, I was able to import a large statistical data set describing the energy efficiency of 525,500 Irish homes (432 megabytes) into PostgreSQL in ~15 minutes. After the CSV file is imported, you can optionally add it to your project using the DB Manager, right-click the table and select Add to Canvas. Don’t use the “Add PostGIS Layers” menu, it’s not a PostGIS layer.

Import_GuiAnd one more useful tip. You can convert Tab delimited text to CSV using QGIS. Load a Tab delimited text file into QGIS using the Add Delimited Text Layer GUI, then right click the imported file in the layer panel and save it as a CSV file.

The Coastal Vignette

Vignette2

Coastal Vignette seen on an old Irish ‘6-Inch map’

Occasionally on old maps you may see a pleasing decorative effect on bodies of water called a “Coastal Vignette”, these are fine lines that highlight coastlines and lake shores. The example seen above is from a ca. 100 year old “6-inch map” of Lough Nafooey in County Galway, Ireland. I presume the Coastal Vignette effect in this example was hand drawn, it required considerable skill and patience.

These is no plugin for creating Coastal Vignettes in QGIS just yet, so I developed a simple technique to recreate the effect using the raster Proximity (Raster Distance)’ algorithm accessible in the Processing Toolbox.

In order to use the Proximity Analysis tool I first converted a Shapefile polygon depicting the sea off Dublin into a 10 by 10 metre resolution Raster using the menu command ‘Raster – Conversion – Rasterize (Vector to raster)’.

Box

This generated a Raster that coded the Sea as ‘1’ (white) and ‘0’ (black) for Land.

Next, I selected ‘Proximity (raster distance)’  from the Processing Toolbox – (GDAL/OGR) – [GDAL] Analysis – Proximity (raster distance). You can quickly find the command by typing the algorithm’s name in the box above the Processing Toolbox.

Screenshot5

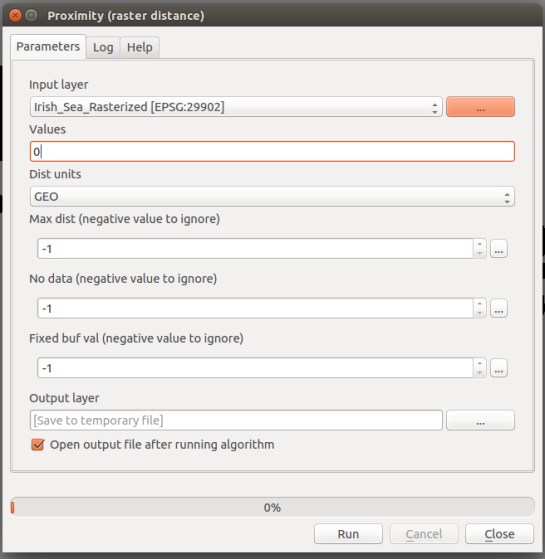
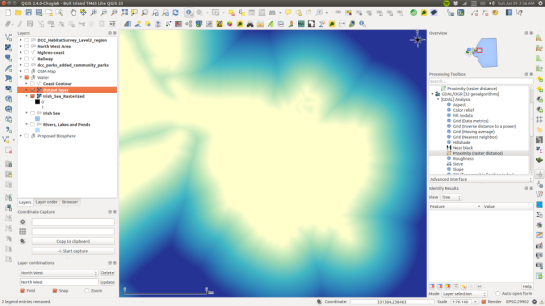
I entered 0 in the ‘Values’ box, this tells the Proximity algorithm to measure the distance away from land (a value of 0). The resulting Raster contains cell values that correspond to the distance away from the coast in metres, which I styled below.

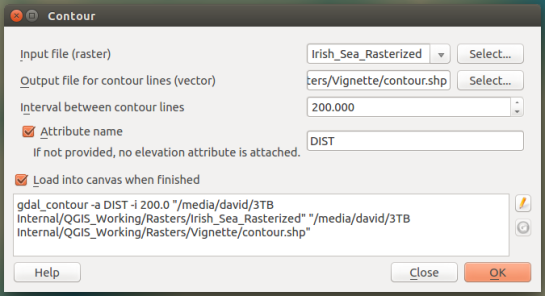
The final step is to create Contours Lines from the Proximity analysis result using the menu item Raster – Contour. In my case I used an “interval between the contour lines” of 200 metres and I added an Attribute name called “DIST”.

Screenshot7

The resulting contour lines have distance attributes attached to them can be used to create a Graduated colour style if needed, though in my cause I manually edited the attributes of 10 contour lines nearest the coast and I gradually increased the transparency of the mid-grey contour lines from opaque at the coast to fully transparent out at sea. I made the remaining contour lines transparent.

And here is the finished result, with the Sea and an OpenStreetMap base map styled to look just like Google Maps.

Finished Vignette 2


CartoDB wins best “high-growth web entrepreneur” at the 2014 European Web Entrepreneur of the Year Awards

CartoDB, the FOSS powered web mapping solution, was honoured at the 2014 European Web Entrepreneur of the Year Awards along with three other companies at Dublin’s Web Summit on November 7th. The awards, presented by a European Commission backed body, were announced after a six month competition that involved public voting across four categories. CartoDB won the award for best “high-growth web entrepreneur”. CartoDB now has a growth rate of over 15% per month and customers in over 30 countries.

In September, a partner company of CartoDB, Kudos Ltda., released a plug-in that allows QGIS users to view, create, edit and delete data stored on their CartoDB accounts. Here is a map I created with the help of the new CartoDB plug-in that shows mountains and hills across the contiguous United States in the form of a heat map.

CartoDB and QGIS illustrate the exciting convergence between web hosted and desktop GIS, where interactive maps created in QGIS can be quickly published on the web and viewed by a worldwide audience.

FinalCartoDB

Hack to adjust map symbols location in QGIS

EN | PT

Now and then I get too many map symbols (points) in the same place, and I thought how nice it would be if we could drag n’ drop them around without messing with their geometries position, just like we do with labels. That thought gave me an idea for a cool hack.

Choose your point layer and start by creating two new fields called symbX and symbY (Type: Decimal number; Size: 20; Precision: 5). Now go the layer properties and in the Style tab edit your symbol. For each level of your symbol select “map units” as the offset units, and set the following expression in the offset data define properties option:


CASE WHEN symbX IS NOT NULL AND symbY IS NOT NULL THEN
    tostring($x - symbX) + ',' + tostring($y - symbY)
ELSE
    '0,0'
END

Screenshot from 2015-02-22 18:18:43

Be aware that, if your coordinates have negative values, you need to adapt the code. E.g., If you have negative values in X you should use “tostring(symbX -$x)” instead.

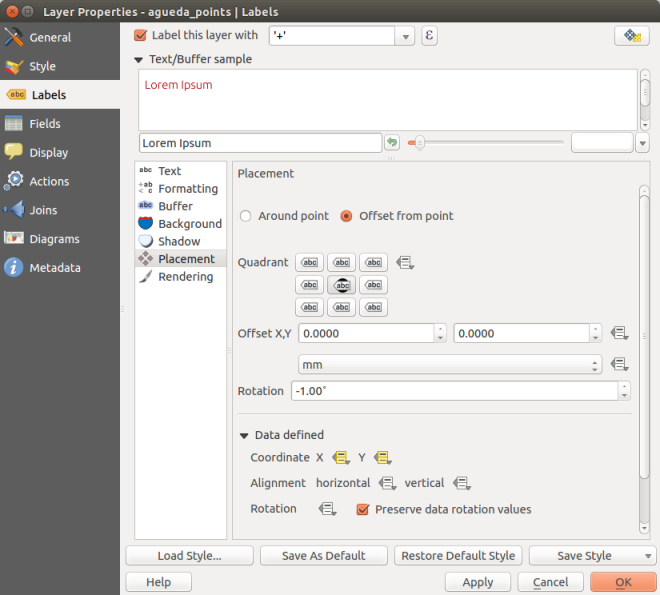
Now, temporarly  label your layer with a small convenient text (I used a centered ‘+’ (plus sign) with a white buffer) and set its coordinates to data defined using the symbX and symbY Fields.

Screenshot from 2015-02-22 22:42:07

From this point on, when you use the move label tool, not only the label position change but also the actual symbol! Pretty cool, isn’t it?

anim

Notice that the features geometries are not changed during the process. Also, remember that in this case you can also add leading lines to connect the symbols to the original position of the points.

Calculate polygon centroid’s coordinates

EN | PT

I had the need to add columns with the coordinates of polygons centroids. I came up with the following expressions to calculate X e Y, respectively:

xmin(centroid($geometry))
ymin(centroid($geometry))

The expression seems quite simple, but it toke me some time before I realize that, not having a x(geometry) and y(geometry) functions, I could use the xmin() and ymin() to get the coordinates of the polygons centroids. Since this wasn’t the first time I had to use this expressions, this post will work as a reminder for the future.

Labels leading lines with QGIS and Postgis

EN | PT

Recently I had the need to add labels to features with very close geometries, resulting in their collision.

Capturar_3

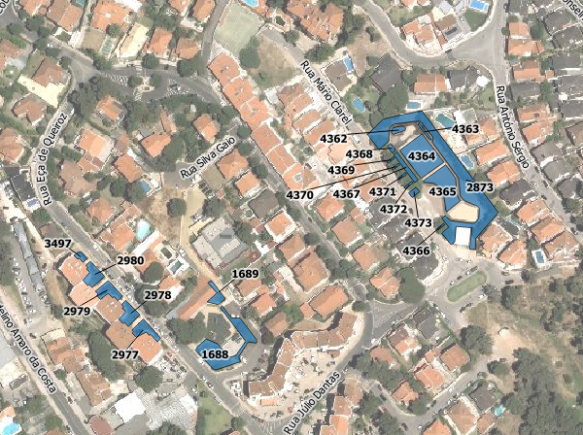
Using data-defined override for label’s position (I have used layer to labeled layer plugin to set this really fast) and the QGIS tool to move labels, it was quite easy to relocate them to better places. However, in same cases, it was difficult to understand to which geometry they belonged.

Capturar_2

I needed some kind of leading lines to connect, whenever necessary, label and feature. I knew another great plugin called “Easy Custom Labeling“, by Regis Haubourg, that did what I needed, but it would create a memory duplicate of the original layer, wish meant that any edition on the original layer wouldn’t be updated in the labels.

Since the data were stored in a PostgreSQL/Postgis database, I have decided to create a query that would return a layer with leading lines. I used the following query in DB manager:

SELECT
  gid,
  label,
  ST_Makeline(St_setSRID(ST_PointOnSurface(geom),27493), St_setSRID(St_Point(x_label::numeric, y_label::numeric),27493))
FROM
  epvu.sgev
WHERE
  x_label IS NOT NULL AND
  y_label IS NOT NULL AND
  NOT ST_Within(ST_Makeline(St_setSRID(ST_PointOnSurface(geom),27493), St_setSRID(St_Point(x_label::numeric, y_label::numeric),27493)),geom))

This query creates a line by using the feature centroid as starting point and the label coordinate as end point. The last condition on the WHERE statement assures that the lines are only created for labels outside the feature.

Capturar_1

With the resulting layer loaded in my project, all I need is to move my labels and save the edition (and press refresh) to show a nice leading line.

guidelines

Use o operador “IN” sff | Please use the “IN” operator

EN | PT

It’s not the first time I see people that, to select feature by their fields values, use expressions like this:

"field" = 'value1' OR "field" = 'value2' OR "field" = 'value3' [OR ...]

A more practical and pretty way of doing this is by using the IN operator instead.

"field" IN ('value1','value2','value3'[,...])

This operator is available in almost every GIS software I know. In QGIS, it can be used even if there isn’t a small little button to click.
Captura de tela 2014-04-23 16.50.40

In fact, this is an abbreviation of what is used in SQL, where the operator is used in the WHERE statement:

SELECT *
FROM parks
WHERE "tipo" IN ('PI','CM','PJ');

Old map in QGIS

EN | PT

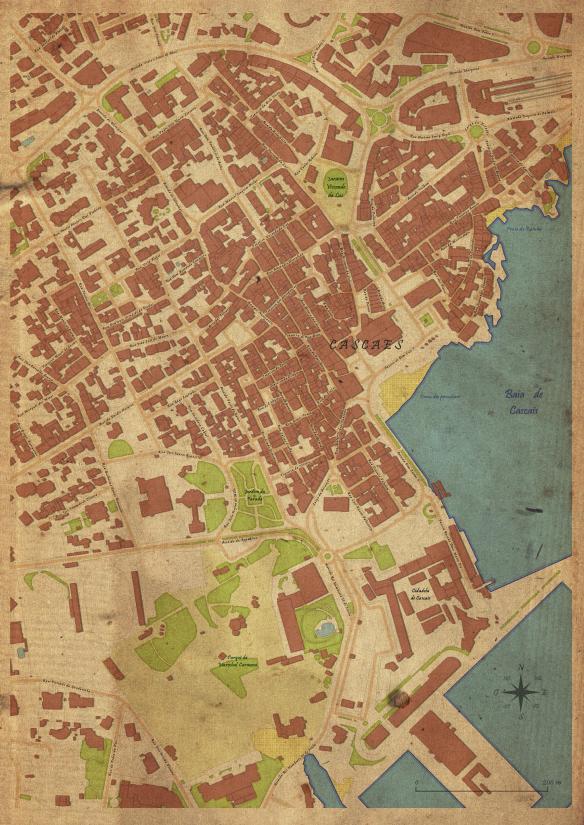
Inspired in a post by Anita Graser, I’ve tried to use QGIS to create a Cascais‘s old looking map, as if it have been drawn by hand in a methodical way.

Defining the styles

I have started by defining the styles for each elements to represent.

Buildings

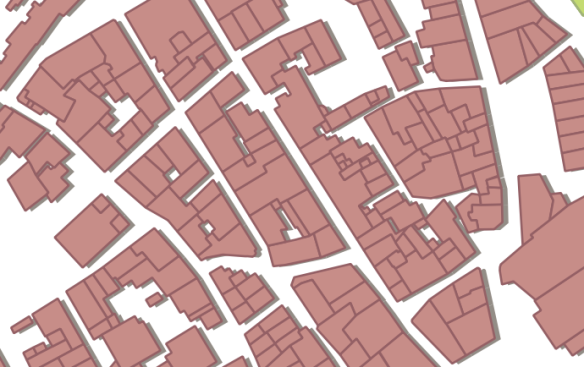
To fill the buildings, I have tried to use a color that reminds me the portuguese roofs, similar to the color commonly used in old maps of cities, with a slightly darker outline of the same color.

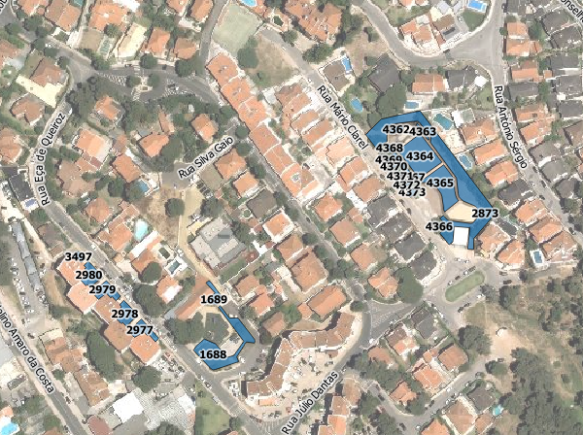
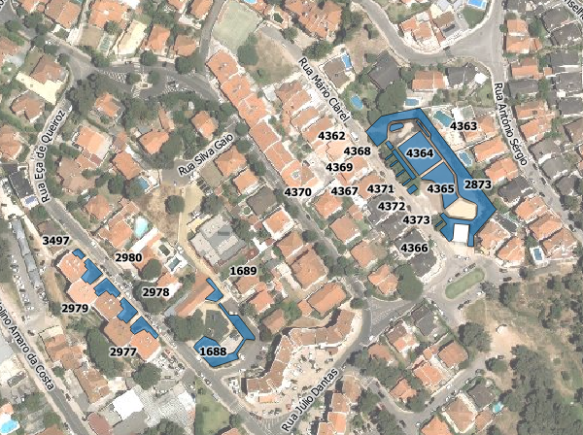
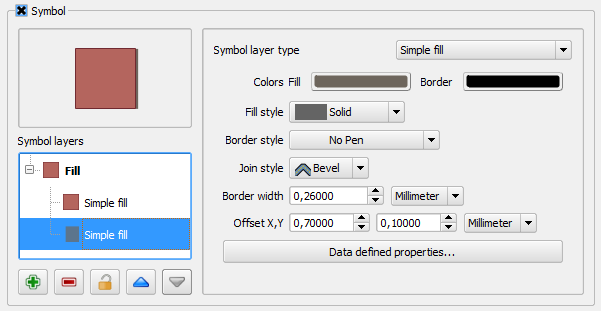
To give a bit of dimension, a shadow was created beneath, using a “simple fill” with dark colors and using a Offset X,Y. The values were chosen assuming the predominant direction of building’s facades, so that the effect could be seen all over the map area.

Capturar_4Capturar_6

Green spaces

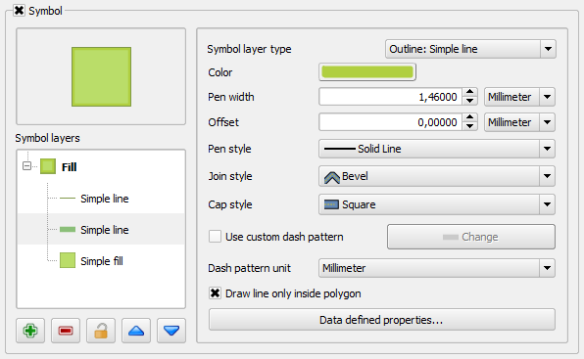
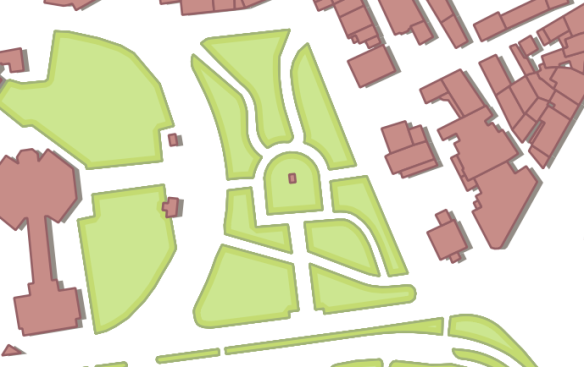
For the green spaces, 3 symbol layers were used. One with a green “simple fill”. A second one with a thick outline (outline: simple line) in a darker green, and using the new 2.2 functionality that allows one to show outlines only in the polygons inside.

Capturar_5The last symbol layer is just a tin line of a green even darker than the other two.

Capturar_7

The Sea

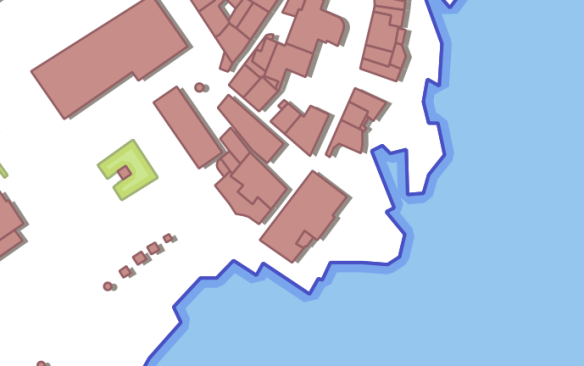
For the sea, the same effect as the green spaces was used, but in blues and with the middle outline even thicker.
Capturar_8

Roads

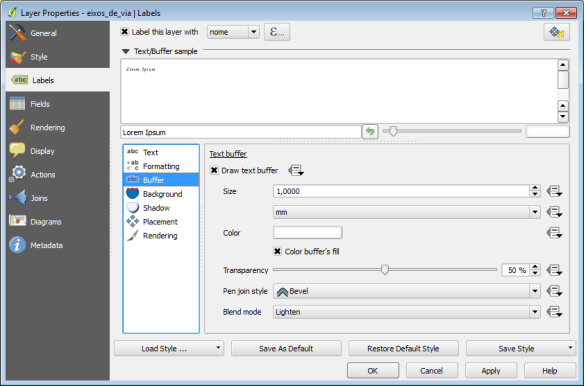
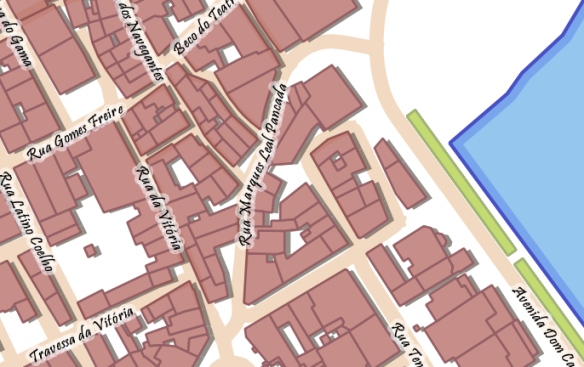
In the road, it was used a thick line with a orange pastel color. Some street names labels were created on top of the line using a script font (in have used Pristina Bold). To improve the label readability, a small white buffer with 50% transparency was added.
Captura de tela 2014-04-11 17.55.04Capturar_9

Beach

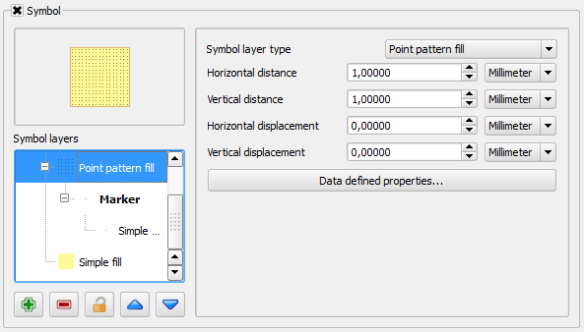
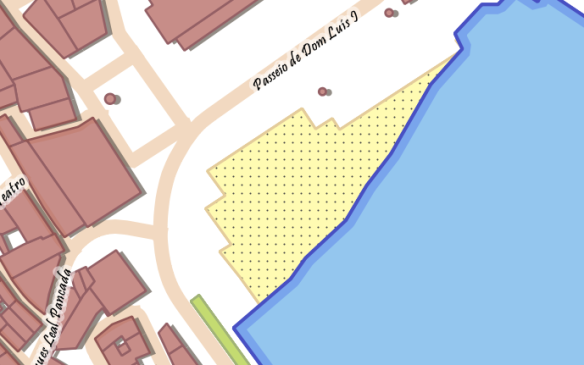
In the beaches, besides a simple fill as background, a point patern fill was used with a very small dot.
Capturar_11Capturar_10

Map composing

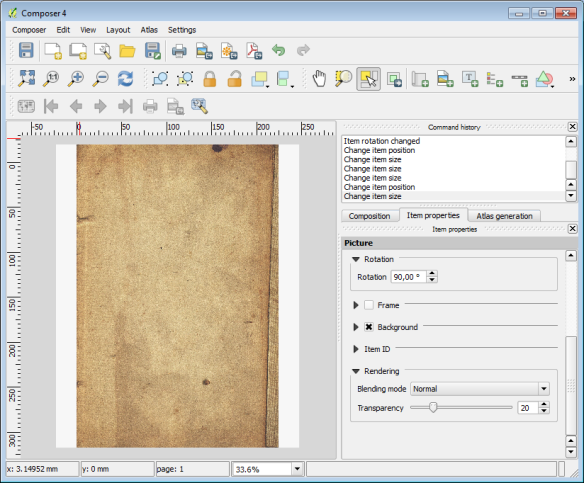
Though the map is looking almost done, it’s in the print composer that the final touches are given. First, the map sheet is totally covered with an image of an old papel (the same used by Anita). A bit of transparency is added (20%), so that the effect is not too strong.

Captura de tela 2014-04-14 11.24.53

Alterwards, the actual map is added, and in the map item properties, the rendering mode is changed from “normal” (by default) to “multiply”. This way it looks like if the map was draw directly on the old paper.

Captura de tela 2014-04-14 11.30.07

After this, it’s all about adding a few more labels (the beach and places names), a north arrow and the graphic scale (always using “multiply” rendering mode), and… Voilá, we have a map!

mapa_antigo


New QGIS plugin – “Walking time”

EN | PT

I have finally “finished” my new plugin. I uses some quotation marks, since I believe that there is still space for a few improvement. This plugin arised with the need to calculate the travel time for the Cascais oficial pedestrian routes, and started as a simple python script. I have then decided to create a graphic interface and publish it as a plugin in the hope that someone else finds it useful.

icon_largeWalking time is a QGIS python plugin that uses Tobbler’s hiking function to estimate the travel time along a line depending on the slope.

The input data required are a vector layer with lines and a raster layer with elevation values ​​(1). One can adjust the base velocity (on flat terrain) according to the type of walking or walker. By default, the value used is 5 km h (2). The plugin update or create fields with estimated time in minutes in forward and in reverse direction (3). One can run the plugin for all elements of the vector layer, or only on selected routes (4).

The plugin can also been used to prepare a network (graph) to perform network analysis when the use of travel walking time as cost is intended.

Captura de tela 2014-03-24 12.12.17-01

QGIS repository: http://plugins.qgis.org/plugins/walkingtime/

Code: https://github.com/SrNetoChan/WalkingTime

Bug report: https://github.com/SrNetoChan/WalkingTime/issues


Séries de mapas com formatos múltiplos em QGIS 2.6 – Parte 2 | Multiple format map series using QGIS 2.6 – Part 2

No último artigo, tentei mostrar como usei o QGIS 2.6 para criar séries de mapas cuja orientação da folha se adaptasse à forma do elemento do atlas. Esse método é útil quando a escala final dos mapas não é relevante, ou quando os elementos usados no atlas têm uma dimensão muito semelhante, permitindo a adopção de uma escala única. No entanto, quando é necessário manter a mesma escala de impressão dos mapas e os elementos do atlas apresentam diferenças de extensão, é necessário alterar o tamanho da folha. Nesta segunda parte do artigo, tentarei mostrar como cheguei a uma solução para isso.

In my last post, I have tried to show how I used QGIS 2.6 to create a map series where the page’s orientation adapted to the shape of the atlas features. This method is useful when the final scale of the maps is irrelevant, or when the size of the atlas elements is  similar, allowing one to use a fixed scale. On the other hand, when using a fixed scale is mandatory and the features size are too different, it is needed to change the size of the paper. In this second part ot the post, I will try to show how I came to a solution for that.

Como base usei o mapa criado na 1ª parte do artigo, do qual fiz um duplicado. Para exemplificar o método procurei criar uma série de mapas à escala 1:2.000.000. Uma vez que iria adaptar tanto a altura como a largura da folha aos elementos do atlas, não me precisava de preocupar com a orientação da folha em si e por isso comecei por desactivar as propriedades definidas por dados na opção orientação.

As a base, I used the map created in the previous post, from which I did a duplicate. To exemplify the method I tried to create a map series at 1:2.000.000 scale. Since I was going to change both width and height of the paper, I did not need to set an orientation, and therefore I deactivated the data defined properties of the orientation option:

Fiz algumas contas usando a escala, as dimensões do elemento do atlas e as margens definidas anteriormente e e cheguei às seguintes expressões a usar na  largura e altura da folha, respectivamente:

With some maths with the map scale, the size of the atlas feature and the already defined margins, I came up with the following expressions to use, respectively,  in width and height:

((bounds_width( $atlasgeometry ) / 2000000.0) * 1000.0) * 1.1 + 10
((bounds_height( $atlasgeometry ) / 2000000.0) * 1000.0) * 1.1 + 30

Passo a explicar. (bounds_width( $atlasgeometry ) / 2000000.0) é a largura do elemento do atlas representado à escala 1:2.000.000 em unidades do projecto (neste caso metros). Este resultado é multiplicado por 1000 para o converter em milímetros (unidade usada nas definições do compositor). Para que o elemento de atlas não ficasse resvés aos limites do mapa decidi dar 10% de margem em torno do mesmo, o que justifica a multiplicação por 1.1. E por fim adicionei a dimensão das margens do mapa que tinham sido definidas na 1ª parte do artigo (i.e., 20 mm, 5 mm, 10 mm, 5 mm).

Allow me to clarify. (bounds_width( $atlasgeometry ) / 2000000.0) is the atlas feature’s width in meters when represented at 1:2.000.000. This is multiplied by 1000 to convert it to millimeters (the composer’s settings units). In order to keep the atlas feature not to close to the margin, I have decided to add 10% of margin around it, hence the multiplication by 1.1. To finish I add the map margins value,that where already set in the previous post (i.e.,20 mm, 5 mm, 10 mm, 5 mm)
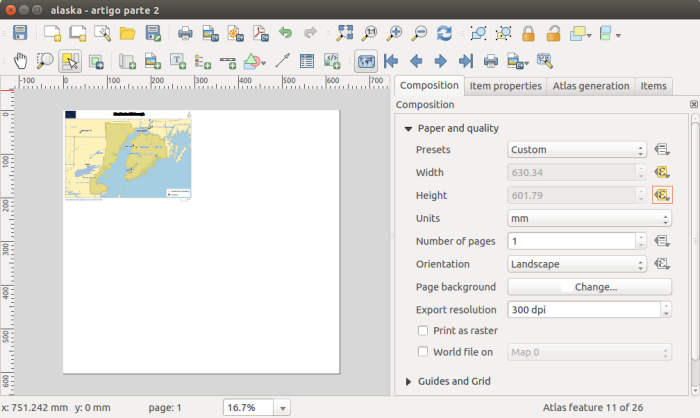
Screenshot from 2014-11-16 22:58:34

Como se pode ver pela imagem anterior, após a introdução das expressões nas opções de largura e altura da folha, a sua dimensão já se alterava em função do tamanho do elemento de atlas. No entanto, como seria de esperar, os itens do mapa mantiveram-se teimosamente na mesma posição. Foi por isso necessário alterar as expressões definidas para a dimensão e posição de cada um deles.

As one can see from the previous image, after setting the expressions in the paper width and height options, it’s size already changed according to the size of the atlas features. But, as expected, all the itens stubbornly kept their positions.For that reason, it has been necessary to change the size and position expressions for each of then.

Começado pelo tamanho do item de mapa, as expressões a usar na altura e largura não foram difíceis de perceber uma vez que seriam as dimensões da folha menos as margens:

Starting by the map item size, the expressions to use in width and height were not difficult to understand since they would be the paper size without the margins size:

((bounds_width( $atlasgeometry ) / 2000000.0) * 1000.0) * 1.1
((bounds_height( $atlasgeometry ) / 2000000.0) * 1000.0) * 1.1

Screenshot from 2014-11-16 23:07:43

Para posicionar correctamente os elementos, bastou substituir nas expressões das opções X e Y os “CASE WHEN … THEN … END” que determinavam o tamanho da largura ou altura da folha, pelas expressões descritas anteriormente. Por exemplo, as expressões usadas para a posição da legenda em X e Y:

To position the items correctly, all was needed was to replace the “CASE WHEN … THEN … END” statement by the expressions defined before. For instance, the expressions used in the X and Y options for the legend position:

(CASE WHEN  bounds_width(  $atlasgeometry ) >=  bounds_height( $atlasgeometry) THEN 297 ELSE 210 END) - 7
(CASE WHEN  bounds_width(  $atlasgeometry ) >=  bounds_height( $atlasgeometry) THEN 210 ELSE 297 END) - 12

Passaram a ser, respectivamente:
Became, respectively:

(((bounds_width( $atlasgeometry ) / 2000000.0) * 1000.0) * 1.1 + 10) - 7
(((bounds_height( $atlasgeometry ) / 2000000.0) * 1000.0) * 1.1 + 30) - 12

Screenshot from 2014-11-16 23:22:40

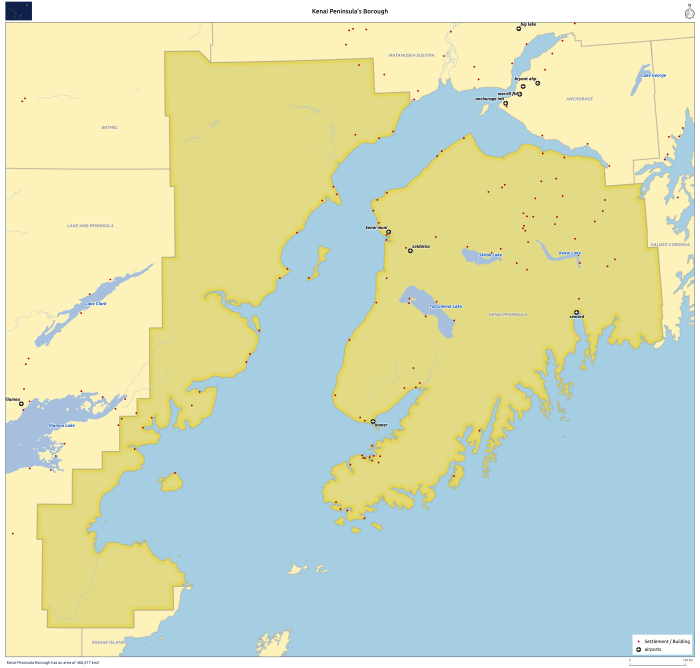
Alterando as expressões de posicionamento X e Y dos restantes itens do compositor cheguei à estrutura final.

Changing the expressions of the X and Y position options for the remaining composer’s items I have reached the final layout.
alaska_region_Kenai Peninsula

Depois disso, a impressão/exportação de todos os (25) mapas ficou, mais uma vez, à distância de um só clique.

Once again, printing/exporting all (25) maps was only one click away.

mosaico_regioes_fixed

Uma vez que o QGIS permite exportar imagens do compositor georreferenciadas, adicionando-as ao QGIS obtive este resultado interessante.

Since QGIS allows exporting the composer as georeferenced images, opening all maps in QGIS I got this interesting result.

Screenshot from 2014-11-17 00:02:38

Como se pode ver pelos resultados, através deste método, podemos obter mapas com formatos bastante estranhos. Por essa razão, na 3ª e última parte deste artigo, procurarei mostrar como criar uma série de mapas com escala fixa, mas usando formatos de folhas standard (A4, A3, A2, A1 e A0).

As one can see by the results, using this method, we can get some quite strange formats. That is why in the 3rd and last post of this article, I will try to show how to create a fixed scale map series using standard paper formats (A4, A3, A2, A1 e A0).

Disclaimer: I’m not an English native speaker, therefor I apologize for any errors, and I will thanks any advice on how to improve the text.


Dissolver polígonos em Postgres\Postgis

Trata-se de um cenário muito recorrente em análise espacial. Tendo uma camada\tabela composta por diversos polígonos, queremos “juntá-los” de acordo com valores distintos de um ou mais atributos (exemplo: de uma camada com os limites de freguesias, queremos obter os concelhos, ou, da COS ao 3º nível, obter o 2º ou o 1º)
Este artigo tem como objectivo mostrar como fazê-lo em Postgres\Postgis.

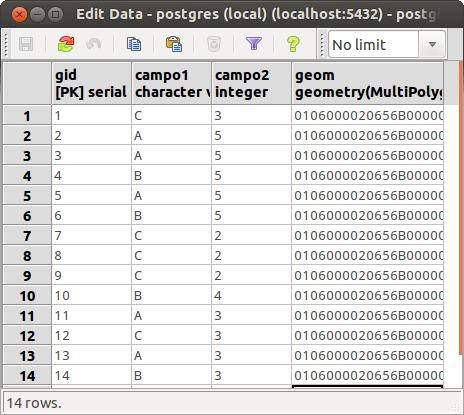
Tabela de exemplo

Como exemplo vou usar uma tabela como o seguinte formato:

CREATE TABLE tabela_1
    (gid serial PRIMARY KEY,
     campo1 character varying(128),
     campo2 integer,
     geom geometry(MultiPolygon,27493);

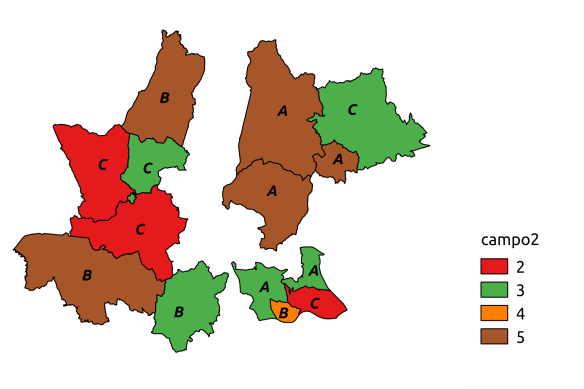
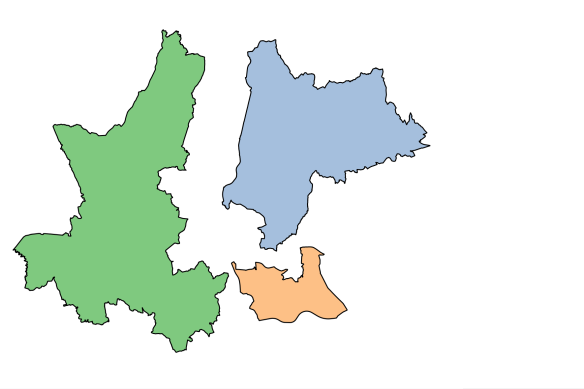
tabela1_original_tabela

tabela1_original

Dissolver todos os polígonos

Em primeiro lugar podemos simplesmente agregar todos os elementos num multi-polígono único. Para tal usamos a função ST_Union().

SELECT
    ST_Union(t.geom) as geom
FROM
    tabela_1 as t;

tabela1_union

Separar polígonos que não sejam contíguos

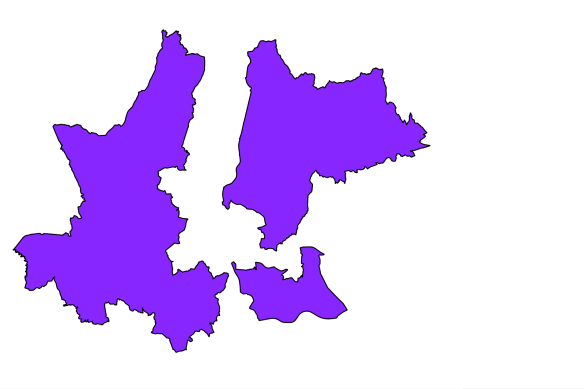
Se por outro lado não quisermos que o resultado apresente multi-polígonos usamos a função ST_Dump() recolhendo o campo da geometria.

SELECT
    (ST_Dump(ST_Union(t.geom))).geom as geom
FROM
    tabela_1 as t;

tabela1_union_dump

Dissolver polígonos com base em valores dos campos

Se quisermos dissolver os polígonos que tenham valores iguais num ou mais campos, basta incluí-los na cláusula GROUP BY. Se quisermos que esses campos apareçam no resultado (geralmente queremos) há que referi-los no início do SELECT.

SELECT
    campo1,
    campo2,
    (ST_Dump(ST_Union(t.geom))).geom as geom
FROM
    tabela_1 as t
GROUP BY
    campo1,
    campo2;

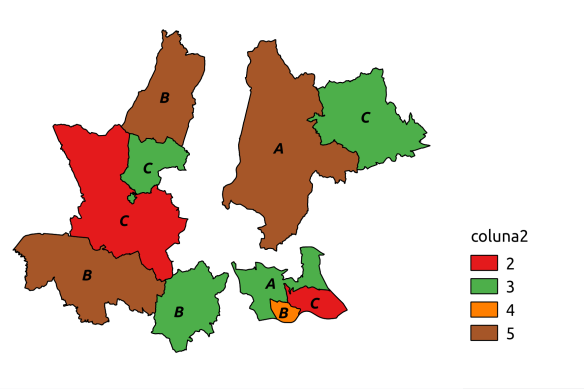
tabela1_union_by_value

Nota 1: Para quem prefere usar interfaces gráficos, preencher formulários e clicar em botões, o uso de SQL para fazer este tipo de operações pode parecer demasiado complicado e até um pouco retrógrado. Mas uma coisa garanto, com alguma prática as dificuldades iniciais são ultrapassadas e os benefícios que se retiram deste tipo de abordagem são muito recompensadores.

Nota 2: Visualizar o resultado deste tipos consultas de agregação (que usam a cláusula GROUP BY) no QGIS pode ser desafiante, este artigo explica como ultrapassar essa dificuldade.


Mapas de fluxos em QGIS

Hoje surgiu a questão “Como consigo fazer um mapa em que a sobreposição de símbolos aumente a opacidade?“. Fiz o meu melhor para descrever como fazê-lo em QGIS, que transcrevo agora para português.

Este tipo de mapas pode ser feito em QGISs usando a uma combinação da transparência e cor dos símbolos e o blending mode dos elementos.

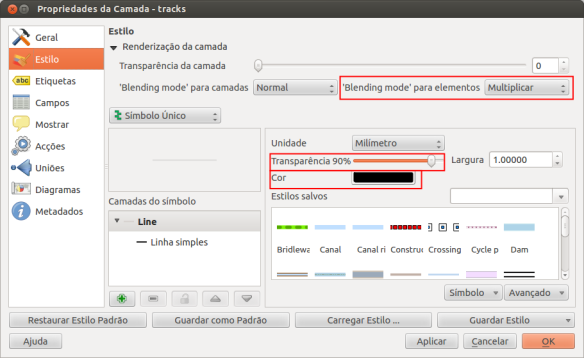
Note-se a diferença entre a transparência e blending mode da camada (que é aplicado a toda a camada) e a transparência do símbolo e blending dos elementos (que acumulam com outros elementos da mesma camada).

Esta opções estão disponíveis em Propriedades da camada > Estilo.

testes_opacidade_opcoes

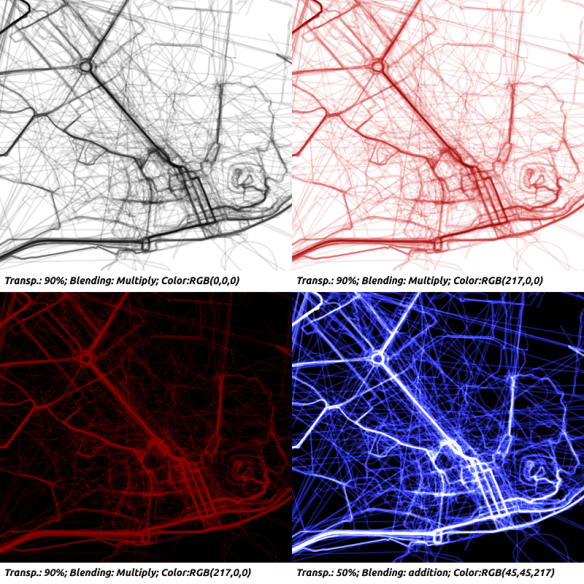
Com um valor de transparência do símbolo de 95%, a cor do elemento tornar-se à totalmente opaca quando pelo menos 20 elementos de sobrepuserem. Este número é limitado à sobreposição de 100 elementos(tranparencia 99%).

Usando diferentes modos de blending (como a multiplicação ou a adição) consegues-se obter outros efeitos.

Testes_com_opacidade_2

Duplicando a camada, usando diferentes cores (no exemplo abaixo o verde para uma camada e o vermelho para a imediatamente baixo) e usando blending mode dogde,consegue-se obter efeitos ainda mais interessantes.

opacity dodge


QGIS + Postgis: Consultas de agregação

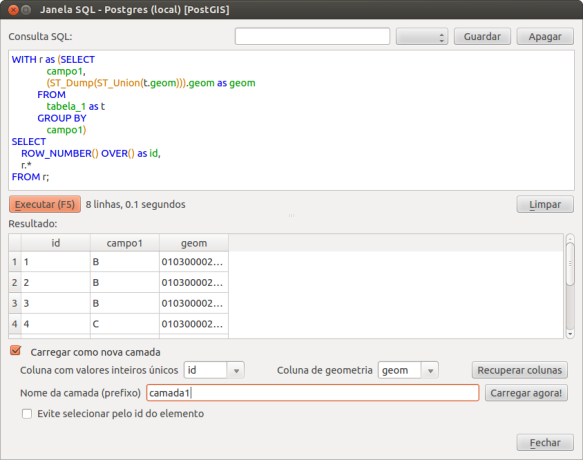
Quando através de uma consulta SQL a uma base de dados postgres\postgis se procede a uma agregação (através do uso da cláusula GROUP BY) é quase certo perder a chave primária da tabela original (geralmente o gid). No entanto, para visualizar o resultado de consultas SQL em QGIS é necessário que exista um campo com valores inteiros distintos para usar como identificadores únicos. Assim, para ultrapassar este contratempo, há que criar uma coluna com essas características.

Essa coluna pode ser feita usando a função ROW_NUMBER(), da seguinte forma:

WITH r as (SELECT
               campo1,
               (ST_Dump(ST_Union(t.geom))).geom as geom
           FROM
               tabela_1 as t
           GROUP BY
               campo1)
SELECT
    ROW_NUMBER() OVER() as id,
    r.*
FROM r;

Copiando toda para a expressão na janela SQL do DB Manager (Base de dados > Gestor BD > Janela SQL), é possível usar o campo id como identificador único.

QGIS_Janela_SQL

AgregacaoSQL_Qgis


  • <<
  • Page 5 of 6 ( 113 posts )
  • >>
  • uncategorized

Back to Top

Sustaining Members