Related Plugins and Tags

QGIS Planet

GRASS GIS 8.2.0 released

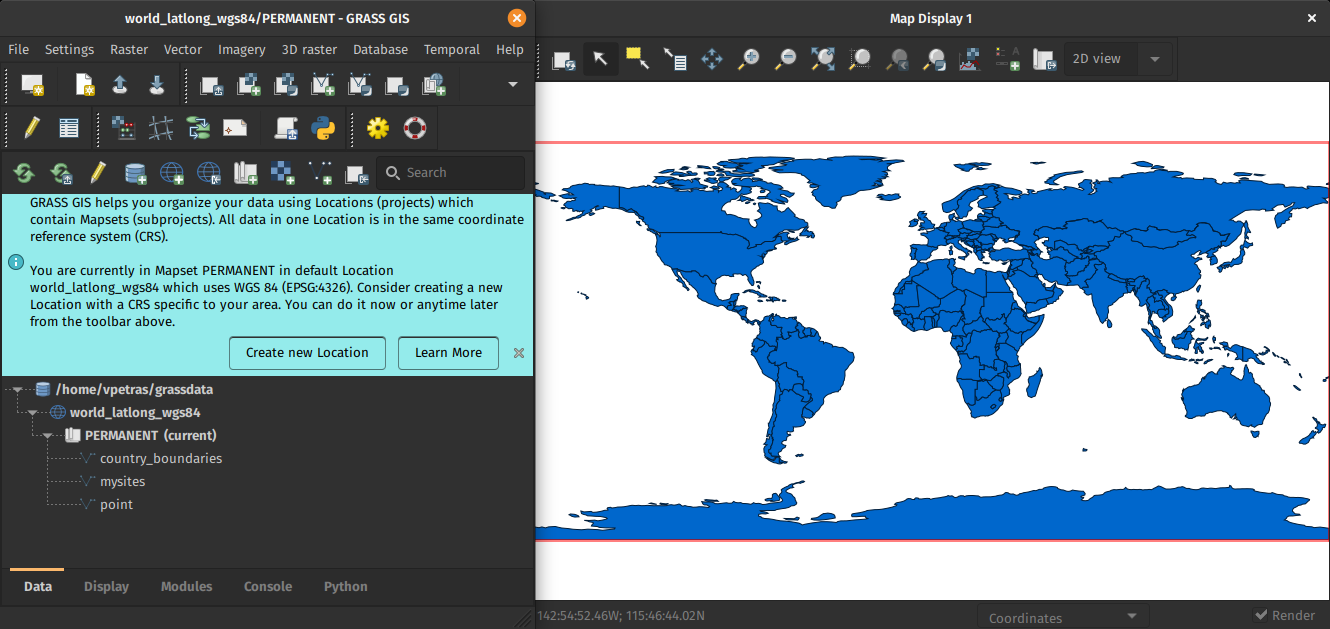
The 8.2.0 release of GRASS GIS is now available with results from the GSoC 2021 and many other additions. A new grass.jupyter package is now included for interacting with Jupyter notebooks. Single window graphical user interface is available in GUI settings. r.series and three other modules are newly parallelized. Additionally, the release includes a series […]

The post GRASS GIS 8.2.0 released appeared first on Markus Neteler Consulting.

GRASS GIS 8.0.1 released

This is an update release of the GRASS GIS 8.0 series. Download source code tarball at https://grass.osgeo.org/grass80/source/grass-8.0.1.tar.gz https://grass.osgeo.org/grass80/source/grass-8.0.1.md5sum For further release details (bug fixes and enhancements), see https://trac.osgeo.org/grass/wiki/Grass8/NewFeatures80 The GRASS GIS 8.0.1 release provides more than 20 fixes and improvements with respect to the release 8.0.0. What’s Changed Important fixes utils/mkhtml: fix print warning/fatal message […]

The post GRASS GIS 8.0.1 released appeared first on Markus Neteler Consulting.

GRASS GIS 8.0.0 released! Finally…

Overview of changes After more than 3 year of development the first stable release GRASS GIS 8.0.0 is available. Efforts have concentrated on making the user experience even better, providing many new useful additional functionalities to modules and further improving the graphical user interface. Breaking news: new graphical user interface with entirely rewritten startup sequence! […]

The post GRASS GIS 8.0.0 released! Finally… appeared first on Markus Neteler Consulting.

GRASS GIS 8.0.0RC2 released

Overview of changes

After more than 3 year of development the first stable release GRASS GIS 8.0.0 is available. Efforts have concentrated on making the user experience even better, providing many new useful additional functionalities to modules and further improving the graphical user interface.

Breaking news: new graphical user interface with entirely rewritten startup sequence!

This re-establishes user experience compatibility with QGIS and other connected software packages.

The GRASS GIS 8.0.0 release provides more than 1,300 fixes and improvements with respect to the release 7.8.6.

With the introduction of the semantic label raster metadata class, the temporal database was modified to version 3. Hence, to be able to read and process GRASS 7.x space-time datasets, users will be prompted to run t.upgrade. If users want to read newly created space-time datasets back in GRASS 7.x, they can run t.downgrade.

Launching the software

The user experience of the graphical user interface has been completely rewritten: no more clumsy selection screens – just enter the menu system directly!

And on command line, GRASS GIS now starts versionless, i.e. as grass.

Download and detailed list of changes

See https://github.com/OSGeo/grass/releases/tag/8.0.0RC2

Thanks to all contributors!

GRASS GIS 8.0.0RC2 contributors

The post GRASS GIS 8.0.0RC2 released appeared first on Markus Neteler Consulting.

GRASS GIS 7.8.5 released

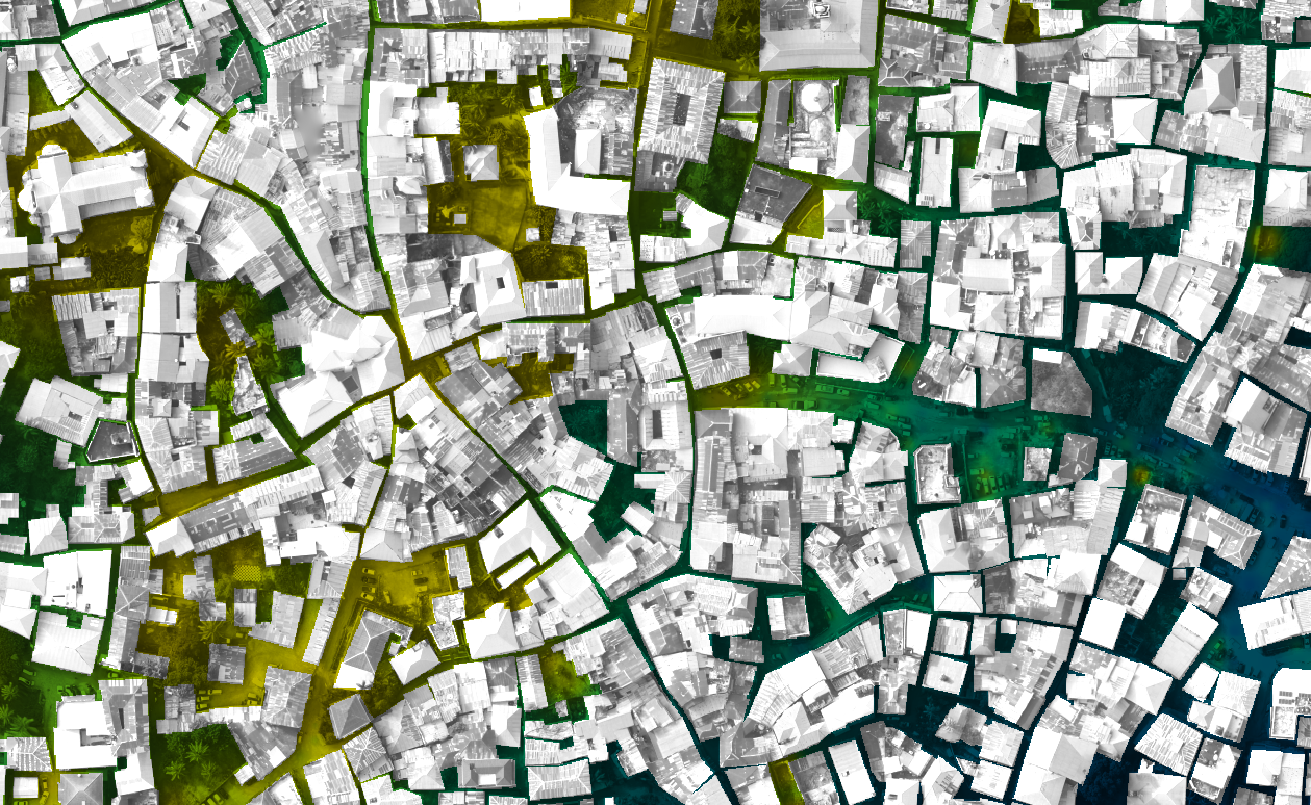
What’s new in a nutshell Zanzibar Mapping Initiative data processed in OpenDroneMap and interpolated respecting building footprints using v.surf.icw

As a follow-up to the previous GRASS GIS 7.8.4 we have published the new release GRASS GIS 7.8.5 with more than 80 improvements. This minor release offers new wxGUI fixes across the tree. Also the addon extension manager received various stability fixes. VRT raster map with tiled raster maps can now be properly exported and imported in the native GRASS GIS raster format.

The overview of new features in the 7.8 release series is available at new features in GRASS GIS 7.8. See also our detailed announcement with the full list of changes and bugs fixed at https://trac.osgeo.org/grass/wiki/Release/7.8.5-News.

Binaries/Installer download:

Source code download:

First time users may explore the first steps tutorial after installation.

About GRASS GIS

The Geographic Resources Analysis Support System (https://grass.osgeo.org/), commonly referred to as GRASS GIS, is an Open Source Geographic Information System providing powerful raster, vector and geospatial processing capabilities. It can be used either as a stand-alone application or as backend for other software packages such as QGIS and R geostatistics or in the cloud. It is distributed freely under the terms of the GNU General Public License (GPL). GRASS GIS is a founding member of the Open Source Geospatial Foundation (OSGeo).

The GRASS Development Team, Dec 2020

The post GRASS GIS 7.8.5 released appeared first on Markus Neteler Consulting.

OSGeo at FOSDEM 2021 (Online) – Call for Participation for the geospatial devroom

Call for Participation for FOSDEM 2021 geospatial devroom

Submission Deadline: 26.12.2020

FOSDEM is the largest free and open source developers meeting in Europe, with 8000+ participants. It normally takes place in Brussels (Belgium).

FOSDEM 2021 will be an online event. We will have a geospatial devroom again. The geospatial devroom will be on Saturday, 6 February 2021. In 2021 it will be our opportunity to bring our global community to FOSDEM.

The geospatial devroom is the place to talk about the state of the art of open, geo-related data, free and open source geospatial software and its ecosystem. This includes standards and tools, e.g. spatial databases, online mapping tools, geospatial services, used for collecting, storing, delivering, analysing, and visualizing geodata.

We are looking for you to be part of the geospatial devroom. The geospatial devroom aims to host talks about geospatial topics, GIS, and geodata projects, standards and open data.

Please submit your talk till 26. December 2020.

You find detailed information about the CfP at:
https://www.osgeo.org/foundation-news/osgeo-at-fosdem-2021-online-call-for-participation/

We hope you will submit a talk or come around at FOSDEM 2021.

See you at FOSDEM 2021

The post OSGeo at FOSDEM 2021 (Online) – Call for Participation for the geospatial devroom appeared first on Markus Neteler Consulting.

MapScaping podcast: GRASS GIS probably doesn’t get the attention it deserves

THE MAPSCAPING PODCAST, GRASS GIS episode

In episode 86 of MapScaping podcast, Markus Neteler talks about the functionality offered (the topological vector engine, 2D and 3D raster analysis, image processing and available programming interfaces), and whom GRASS GIS is for.

Markus is the cofounder of mundialis, a Bonn based business. He is also the Chairman of the GRASS GIS Project Steering Committee.

Enjoy the podcast and the transcript!

The post MapScaping podcast: GRASS GIS probably doesn’t get the attention it deserves appeared first on Markus Neteler | Geospatial Analysis | Remote sensing | GRASS GIS.

GRASS GIS 7.8.4 released

1. What’s new in a nutshell

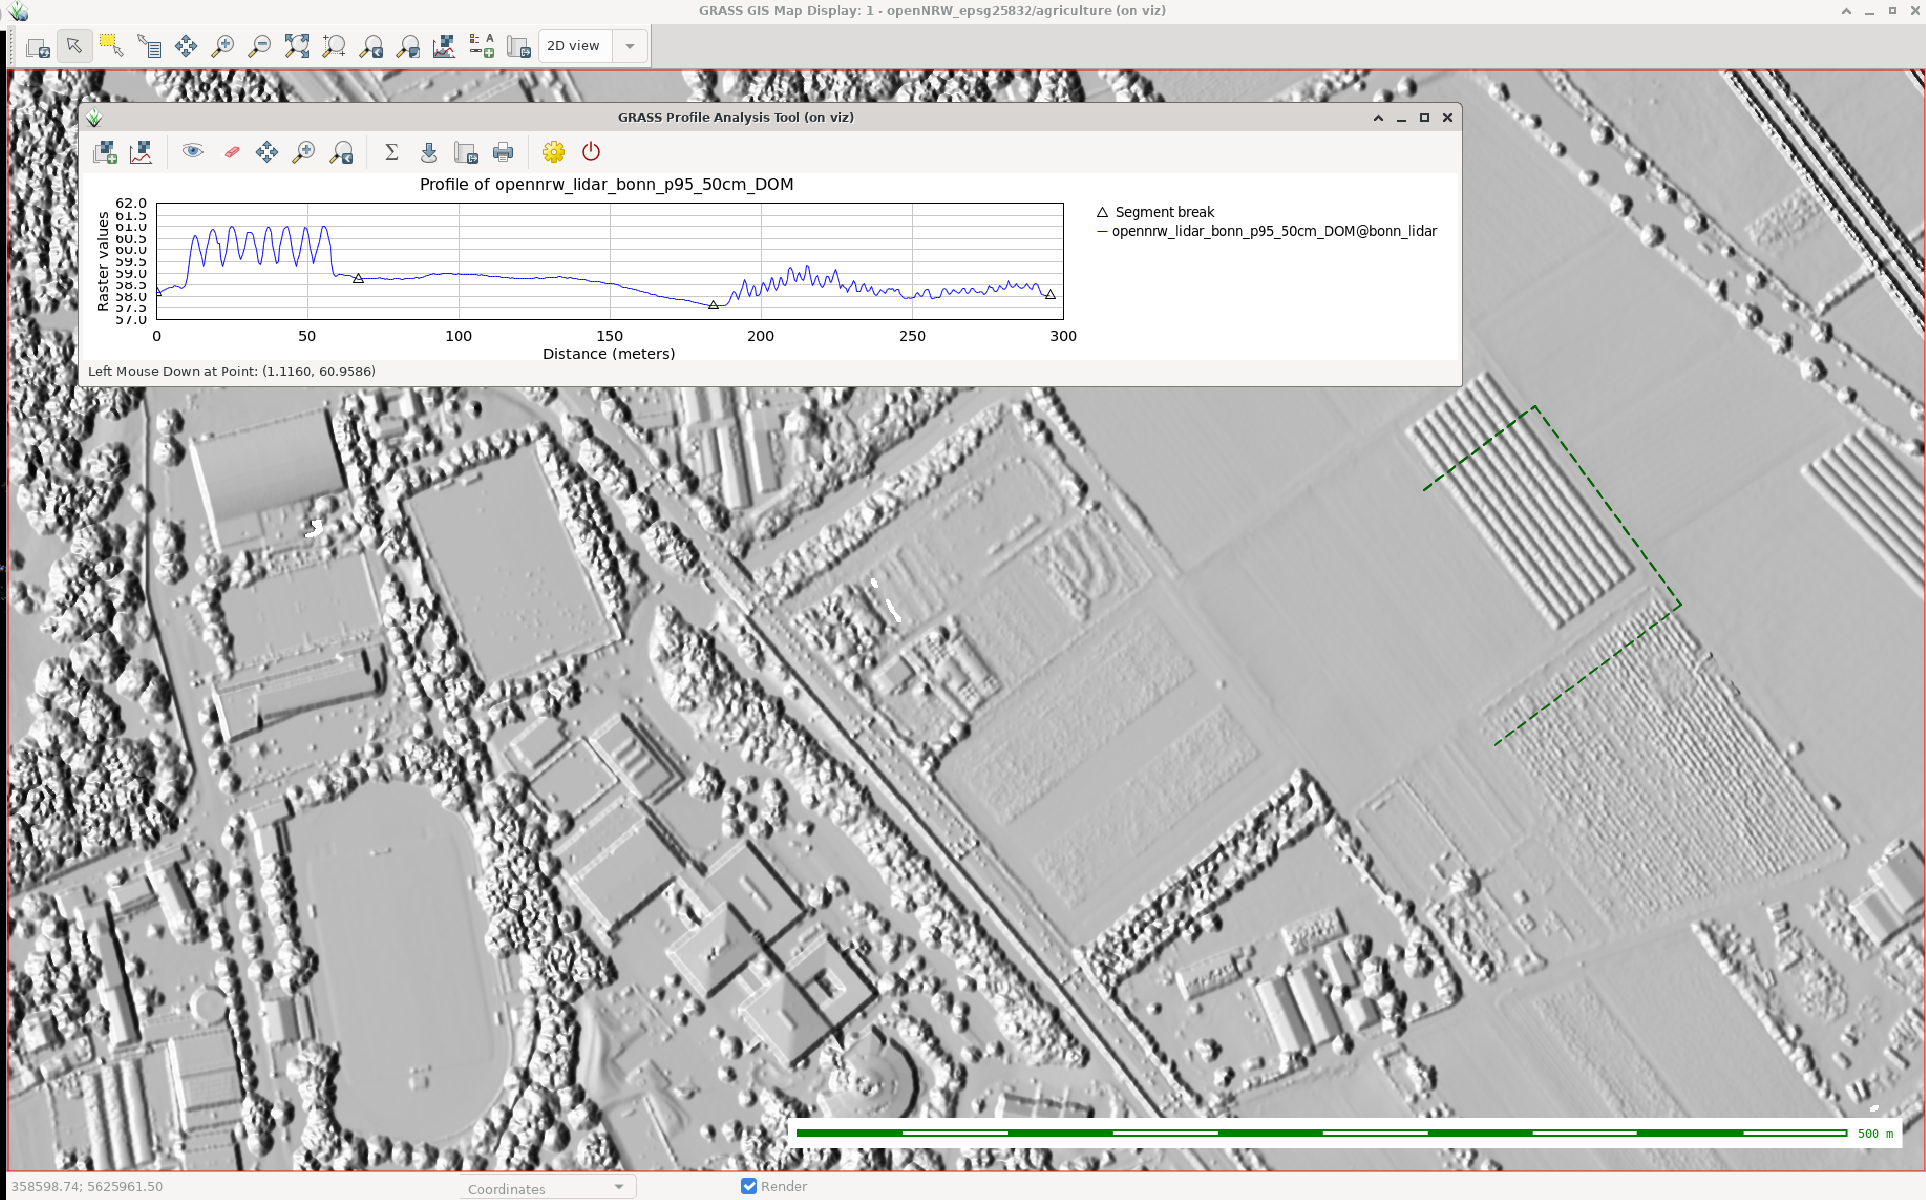
Processed LiDAR data in GRASS GIS (screenshot by @neteler)As a follow-up to the previous GRASS GIS 7.8.3 we have published the new release GRASS GIS 7.8.4 with more than 170 improvements. This minor release again focuses on wxGUI fixes, especially in the animation export, the layer management, 3D visualization and the data catalogue. Many display modules received fixes as well, and the vector digitizer now works as expected.

The overview of new features in the 7.8 release series is available at new features in GRASS GIS 7.8. See also our detailed announcement with the full list of changes and bugs fixed at https://trac.osgeo.org/grass/wiki/Release/7.8.4-News.

Binaries/Installer download:

Source code download:

First time users may explore the first steps tutorial after installation.

About GRASS GIS

The Geographic Resources Analysis Support System (https://grass.osgeo.org/), commonly referred to as GRASS GIS, is an Open Source Geographic Information System providing powerful raster, vector and geospatial processing capabilities. It can be used either as a stand-alone application or as backend for other software packages such as QGIS and R geostatistics or in the cloud. It is distributed freely under the terms of the GNU General Public License (GPL). GRASS GIS is a founding member of the Open Source Geospatial Foundation (OSGeo).

The GRASS Development Team, Oct 2020

The post GRASS GIS 7.8.4 released appeared first on GFOSS Blog | GRASS GIS and OSGeo News.

Sol Katz Award – Thank you

On Thursday, I was awarded the 2020 Sol Katz award for Free and Open Source Software for Geospatial. I feel very honored to have been selected for this award and I’d like to take this opportunity to share a few words of thanks:

As people working in open source projects, we are constantly reminded that we are all standing on the shoulders of giants. However, particularly this year, we also see just how important small personal connections are. For me, my involvement with open source communities really took off when I joined the QGIS hackfest in Vienna in 2009 and I felt that my participation was really appreciated and welcome. I couldn’t imagine being without these connections anymore.

Thank you to the whole QGIS community, particularly my fellow PSC members both current and former: Tim, Andreas, Jürgen, Richard, Paolo, Otto, Marco Hugentobler, Alessandro, our new chair Marco Bernasocchi, and of course QGIS founder Gary Sherman for starting this awesome project and for still being around and actively promoting geospatial open source by publishing so many great books covering multiple different OSGeo projects.

I’d also like to thank my partner and my family for being incredibly understanding whenever I’m spend my time geeking out over a new programming project, data analysis, forum question, or conference talk.

Thank you also to my friends, colleagues and fellow members of the larger OSGeo community for sharing ideas, providing valuable feedback, and spreading the word about all the great work that’s going on all around us.

I’m constantly amazed by all the innovation happening to nourish and grow our community. And I’m looking forward to continue being a part of these efforts.

Thank you!


Announcing SLYR Community Edition

North Road are proud to announce the official release of SLYR Community Edition, a new open-source version of our powerful SLYR ESRI to Open Source compatibility suite. The Community Edition is available for download from the official QGIS plugin repository today, for QGIS versions 3.4 and above. It supports automated conversion of ESRI .style symbol databases, including conversion of markers, fills, line styles and color ramps to their closest QGIS symbology equivalent, allowing users to instantly transition their style libraries into QGIS!

If you’ve followed our work in the past, it will come as no surprise to hear that North Road are passionate about open source geospatial, and for reducing the barriers which users encounter when moving to open-source software. We see our SLYR tool as an integral part of this process, and the licensed version of the plugin currently supports automated conversion of MXD, LYR, PMF, and other ESRI-specific formats to QGIS documents.

Our intention all along has been to make this tool freely available for all users of open-source geospatial software, and to release our work under a permissive, open-source license so that other projects can take advantage of our reverse engineering efforts. That’s why we made an “open source pledge” a fundamental part of our SLYR tool development! By the terms of this pledge, exactly six months after we hit staged preset funding levels we will open-source more components of the code and update the community version of the plugin accordingly. (This approach gives motivated organisations instant access to the full functionality of the SLYR tool via a license purchase, or free access to a subset of this functionality via the community edition of the plugin. It allows us to heavily invest in further reverse-engineering efforts and improvements to the plugin, to QGIS, and to the wider open-source geospatial community.)

If you’re keen to explore transitioning your workplace from ESRI to open-source, send us an email to discuss what we can offer! North Road staff have years of experience in implementing open-source geospatial solutions within commercial workplaces, and for setting up dual commercial-and-open-source friendly environments.

Securely accessing enterprise ArcGIS Portal sites through QGIS

An updated version of this guide is available!

We were recently contacted for advice regarding our recommendations for securely accessing content on an enterprise ArcGIS Portal deployment from within QGIS. Fortunately, this setup is fully supported and works seamlessly in QGIS, thanks to the native integration of “OAuth2” authentication in QGIS!

This post details step-by-step instructions in setting up both ArcGIS Portal and QGIS to enable this integration. First, we’ll create a new desktop application on the Portal site in order to obtain the application-specific access keys for OAuth2 authentication. We’ll then create an authentication configuration in QGIS and associate this with a connection to the Portal site. Let’s dive in by doing the Portal configuration first…

Creating an application

Logon to the Portal, and from the “Content” tab, click the “Add Item” option. Select “An application” from the drop down list of options:

Set the type of the application as “Desktop

You can fill out the rest of this dialog as you see fit. Suggested values are:

  • Purpose: Ready to Use
  • Platform: Qt
  • URL: http://qgis.org
  • Tags: QGIS, Desktop, etc

Now – here comes a trick. Portal will force you to attach a file for the application. It doesn’t matter what you attach here, so long as it’s a zip file. While you could attach a zipped copy of the QGIS installer, that’s rather wasteful of server space! We’d generally just opt for a zip file containing a text file with a download link in it.

Click Add Item when you’re all done filling out the form, and the new application should be created on the Portal.

Registering the Application

The next step is to register the application on Portal, so that you can obtain the keys required for the OAuth2 logon using it. From the newly created item’s page, click on the “Settings” tab:

Scroll right to the bottom of this page, and you should see a “Register” button. Press this. Set the “App type” to “Native“.

Add two redirect URIs to the list (don’t forget to click “Add” after entering each!):

  1. The Portal’s public address, e.g. https://mydomain.com/portal
  2. http://127.0.0.1:7070

Finally, press the “Register” button in the dialog. If all goes well then the App Registration section in the item settings should now be populated with details. From here, copy the “App ID” and “Secret” strings, we’ll need these later:

Determine Request URLs

One last configuration setting we’ll need to determine before we fire up QGIS is the Portal’s OAuth Request and Token URLs. These are usually found by appending /sharing/rest/oauth2/authorize and /sharing/rest/oauth2/token to the end of your Portal’s URL.

For instance, if your public Portal URL is http://mydomain.com/portal, then the URLs will be:

Request URL: http://mydomain.com/portal/sharing/rest/oauth2/authorize
Token URL: http://mydomain.com/portal/sharing/rest/oauth2/token

You should be able to open both URLs directly in a browser. The Request URL will likely give a “redirect URL not specified” error, and the Token URL will give a “client_id not specified” error. That’s ok — it’s enough to verify that the URLs are correct.

We’re all done on the Portal side now, so time to fire up QGIS!

Creating an QGIS OAuth2 Authentication Configuration

From your QGIS application, select Options from the Settings menu. Select the Authentication tab. We need to create a new authentication configuration, so press the green + button on the right hand side of the dialog. You’ll get a new dialog prompting you for Authentication details.

There’s a few tricks to this setup. Firstly, it’s important to ensure that you use the exact same settings on all your client machines. This includes the authentication ID field, which defaults to an auto-generated random string. (While it’s possible to automatically deploy the configuration as part of a startup or QGIS setup script, we won’t be covering that here!).

So, from the top of the dialog, we’ll fill in the “Name” field with a descriptive name of the Portal site. You then need to “unlock” the “Id” field by clicking the little padlock icon, and then you’ll be able to enter a standard ID to identify the Portal. The Id field is very strict, and will only accept a 7 letter string!

Drop down the Authentication Type combo box, and select “OAuth2 Authentication” from the list of options. There’s lots of settings we need to fill in here, but here’s what you’ll need:

  • Grant flow: set to “Authorization Code”
  • Request URL: enter the Request URL we determined in the previous step, e.g. http://mydomain.com/portal/sharing/rest/oauth2/authorize
  • Token URL: enter the Token URL from the previous step, e.g. http://mydomain.com/portal/sharing/rest/oauth2/token
  • Refresh Token URL: leave empty
  • Redirect URL: leave as the default http://127.0.0.1:7070 value
  • Client ID: enter the App ID from the Portal item’s App Registration information (see earlier steps)
  • Client Secret: enter the App Secret from the Portal item’s App Registration information (see earlier steps)
  • Scope: leave empty
  • API Key: leave empty

That’s it — leave all the rest of the settings at their default values, and click Save.

You can close down the Options dialog now.

Adding the Portal Connection Details

Lastly, we’ll need to setup the Portal connection as an “ArcGISFeatureServer” and “ArcGISMapServer” connection in QGIS. This is done through the QGIS “Data Source Manager” dialog, accessed through the Layer menu. Click the “ArcGIS Feature Server” tab to start with, and then press “New” in the Server Connections group at the top of this dialog.

Enter a descriptive name for the connection, and then enter the URL for the ArcGIS server REST endpoint associated with your Portal:

Lastly, select the new OAuth2 configuration you just created under the “Authentication” group:

Click OK, and you’re done! When you try to connect to the newly added connection, you’ll automatically be taken to the Portal’s logon screen in order to authenticate with the server. After entering your details, you’ll then be connected securely to the server and will have access to all items which are shared with your user account on the Portal!

You can then repeat this step for and create a similar connection under the “ArcGIS Map Server” tab.

We’ve regularly use this setup for our enterprise clients, and have found it to work flawlessly in recent QGIS versions! If you’ve found this useful and are interested in other “best-practice” recommendations for mixed Open-Source and ESRI workplaces, don’t hesitate to contact us to discuss your requirements… at North Road we specialise in ensuring flawless integration between ESRI based systems and the Open Source geospatial software stack.

QGIS Processing, Model Designer and ETL Campaign crowdfund launched!

QGIS Processing offers a rich and expandable set of algorithms which can operate on spatial data, along with a powerful Model Designer which allows users to string together these algorithms to create custom workflows.

Since its introduction in QGIS 2, the Processing framework has seen an intensive amount of development and optimisation efforts. In recent QGIS releases it offers a very user-friendly way of performing complex spatial data processing tasks, all without requiring ANY expensive third-party tools or software licenses!

At North Road we are passionate about the QGIS Processing framework, and have invested considerable effort in this framework over the past 5 years. We’re proud to announce that our latest crowd-funding campaign is focused on further expanding the capabilities and flexibility of Processing and the Processing Model Designer!

Unlike a typical crowdfunding campaign, where a specific funding target and deadline is set, we’re running this campaign a little differently. Instead, this campaign is taking the form of a “à la carte” menu of Processing enhancements. These range from small “paper-cut” style fixes, through to larger architectural improvements, and are each individually priced accordingly. We are asking backers to pick individual enhancements from this “menu of enhancements” and fund that enhancement’s development in full. In order to make this campaign affordable for a wide range of backers, we’ve included a huge range of enhancements which vary in price from smaller amounts to larger amounts.

You can read the full details of the campaign and browse the list of proposed enhancements at the campaign page.

GRASS GIS 7.8.2 released

GRASS GIS 7.8.2 released with updated PROJ 6 and GDAL 3 support

What’s new in a nutshell

As a follow-up to the recent GRASS GIS 7.8.1 we have pusblished the new stable release GRASS GIS 7.8.2.
Besides other improvements, the release contains important PROJ 4/5/6 related datum handling fixes, wxGUI fixes and a fix for the vector import from PostGIS databases.

An overview of the new features in the 7.8 release series is available at new features in GRASS GIS 7.8.

Binaries/Installer download:

Source code download:

See also our detailed announcement:

First time users may explore the first steps tutorial after installation.

About GRASS GIS

The Geographic Resources Analysis Support System (https://grass.osgeo.org/), commonly referred to as GRASS GIS, is an Open Source Geographic Information System providing powerful raster, vector and geospatial processing capabilities in a single integrated software suite. GRASS GIS includes tools for spatial modeling, visualization of raster and vector data, management and analysis of geospatial data, and the processing of satellite and aerial imagery. It also provides the capability to produce sophisticated presentation graphics and hardcopy maps. GRASS GIS has been translated into about twenty languages and supports a huge array of data formats. It can be used either as a stand-alone application or as backend for other software packages such as QGIS and R geostatistics. It is distributed freely under the terms of the GNU General Public License (GPL). GRASS GIS is a founding member of the Open Source Geospatial Foundation (OSGeo).

The GRASS Development Team, December 2019

The post GRASS GIS 7.8.2 released appeared first on GFOSS Blog | GRASS GIS and OSGeo News.

Remarks on SVN-trac to GitHub migration

GRASS GIS is an open source geoinformation system which is developed by a globally distributed team of developers. Besides the source code developers also message translators, people who write documentation, those who report bugs and wishes and more are involved.

1. Early days… from pre-Internet to CVS and SVN

While GRASS GIS is under development since 1982 (no typo!) it has been put into a centralized source code management system in December 1999. Why so late? Because the World Wide Web (WWW) became available in the 1990s along with tools like browsers and such, followed by the development of distributed source code management tools. We moved on 29th Dec 1999 (think Y2K bug) the entire code into our instance of CVS (Concurrent Versioning System). With OSGeo being founded in 2006, we migrated the CVS repository to SVN (Subversion for the source code management) and trac (bug and wish tracker) on 8 Dec 2007. See here for historic details on our various bug trackers.

2. Time to move on: git

Now, after more than 10 years using SVN/trac time had come to move on and join the large group of projects managing their source code in git (see also our related Wiki page on migration). Git comes with numerous advantages, yet we needed to decide which hosting platform to use. Options where github.com, gitlab.com, gitlab or gitea on OSGeo infrastructure, or other platforms. Through a survey we found out that the preference among contributors is GitHub. While not being open source itself it offers several advantages: it is widely known (good to get new developers interested and involved), numerous OSGeo projects are hosted there under the GitHub “OSGeo organization“.

If all fails (say, one day GitHub no longer being a reasonable choice) the import of our project from GitHub to GitLab is always possible. Indeed, we meanwhile mirror our code on OSGeo’s gitea server.

Relevant script code and migration ticket:

Relevant steps:

  • migrated SVN trunk -> git master
  • migrated and tagged release branches (milestones)
  • deleted “develbranch6” (we compared it to “releasebranch_6_4” and didn’t discover relevant differences)
  • Fix commit messages (yes, we really wanted to be brave, updating decades of commit messages!):
    • references to old RT tracker tickets (used Dec 2000 – Dec 2006)
    • references to old GForge tracker tickets (used Jan 2007 – Dec 2008)
    • references to other trac tickets (#x -> https://trac.osgeo.org/…)

3. Source code migration: the new git repositories

  • github repository “grass” (repo)

    • Source code from 1999 to present day (SVN-trunk -> git-master)
    • all 7.x release branches
  • github repository “grass-legacy” (repo)

    • separate repository for older GRASS GIS releases (3.2, 4.x, 5.x, 6.x), hence source code now available in git since 1987!
  • github repository “grass-addons” (repo)

    • repository for addons
  • github repository “grass-promo” (repo)
    • repository for promotional material
  • github repository “grass-website” (repo)
    • repository for upcoming new Website

4. Remarks on the “grass-legacy” repository

What special about it:

  • the source code goes back to 1987!
  • file timestamps (which I tried to preserve for decades :-) have been used to reconstruct the source code history (e.g., releasebranch_3_2)
  • junk files removed (plenty of leftover old binary files, files consisting of a special char only etc)
  • having this grass-legacy repo available in parallel to the main grass repo which contains the  recent source code we have a continuous source code coverage from 1987 to today in git.
  • size is about 250MB

What’s missing

  • the 4.3 source code doesn’t have distinct timestamps. Someone must have once packaged without mtime preservation… a pity. Perhaps a volunteer may fix that by carrying over the timestamps from GRASS GIS 4.2 in case the md5sum of a file is identical (or so).

5. Trac issue migration

A series of links had to be updated. Martin Landa invested days and days on that (thanks!!). He used the related GDAL efforts as a basis (Even Rouault: thanks!). As the date for the trac migration we selected 2007-12-09 (r25479) as it was the first SVN commit (after the years in CVS). The migration of trac bugs to github (i.e. transfer of trac ticket content) required several steps:

Link updates in the ticket texts:

  • links to other tickets (now to be pointed to full trac URL). Note that there were many styles of referring in the commit log message which had to be parsed accordingly
  • links to trac wiki (now to be pointed to full trac URL)
  • links source code in SVN (now to be pointed to full trac URL)
  • images and attachments (now to be pointed to full trac URL)

Transferring:

  • “operating system” trac label into the github issue text itself (following the new issue reporting template)
  • converting milestones/tickets/comments/labels
  • converting trac usernames to Github usernames
  • setting assignees if possible, set new “grass-svn2git” an assignee otherwise
  • slowing down transfer to match the 60 requests per second API limit rate at github

6. Fun with user name mapping

Given GRASS GIS’ history of 35+ years we had to invest major effort in identifying and mapping user names throughout the decades (see also bug tracker history). The following circumstances could be identified:

  • user present in CVS but not in SVN
  • user present in SVN but not in CVS
  • user present in both with identical name
  • user present in both with different name (well, in our initial CVS days in 1999 we often naivly picked our surnames like “martin”, “helena”, “markus”, “michael” … cute yet no scaling very much over the years!) as some were changed in the CVS to SVN migration in 2007, leading to
    • colliding user names
  • some users already having a github account (with mostly different name again)

We came up with several lookup tables, aiming at catching all variants. Just a “few” hours to dig in old source code files and in emails for finding all the missing email addresses…

7. Labels for issues

We cleaned up the trac component of the bug reports, coming up with the following categories which have to be visually grouped by color since the label list is just sorted alphabetically in github/gitlab:

  • Issue category:
    • bug
    • enhancement
  • Issue solution (other than fixing and closing it normally):
    • duplicate
    • invalid
    • wontfix
    • worksforme
  • Priority:
    • blocker
    • critical
    • feedback needed
  • Components:
    • docs
    • GUI
    • libs
    • modules
    • packaging
    • python
    • translations
    • unittests
    • Windows specific

Note that the complete issue migration is still to be done (as of Nov. 2019). Hopefully addressed at the GRASS GIS Community Sprint Prague 2019.

8. Setting up the github repository

In order to avoid users being flooded by emails due to the parsing of user contributions which normally triggers an email from github) we reached out to GitHub support in order to temporarily disable these notifications until all source code and selected issues were migrated.

The issue conversion rate was 4 min per trac bug to be converted and uploaded to github. Fairly slow but likely due to the API rate limit imposed and the fact that the migration script above generates a lot of API requests rather than combined ones..
Note to future projects to be migrated: use the new gihub import API (unfortunately we got to know about its existence too late in our migration process).

Here out timings which occurred during the GRASS GIS project migration from SVN to github:

  • grass repo: XX hours (all GRASS GIS 7.x code)
  • grass-legacy repo: XX hours (all GRASS GIS 3.x-6.x code)
  • NNN issues: XX hours – forthcoming.

9. New issue reporting template

In order to guide the user when reporting new issues, we will develop a small template – forthcoming.

10. Email notifications: issues to grass-dev and commits to grass-commit

We changed the settings from SVN post-hook to Github commit notifications and they flow in smoothly into the grass-commit mailing list. Join it to follow the development.

Overall, after now several months of using our new workflow we can state that things work fine.

The post Remarks on SVN-trac to GitHub migration appeared first on GFOSS Blog | GRASS GIS and OSGeo News.

QGIS Print Layouts Graphs and Charts Campaign – Complete!

Last week saw the exciting release of version 3 of the QGIS DataPlotly plugin, which incorporates all the work done as a result of our Print Layouts Graphs and Charts crowdfunding campaign crowd funding campaign. Now, beautiful charts and graphs are available directly within QGIS print layouts, and all it takes is the easy installation of the “DataPlotly” plugin from your QGIS install!

In this post we’ll showcase the functionality which has been added during this campaign, and which is available today in the plugin.

UI modernisation and tweaks

First up, during our work on this plugin we’ve invested some time in refreshing the plugin’s UI to ensure it follows all the widget conventions used elsewhere in QGIS. Now, the plugin blends seamlessly into your QGIS window, and all the chart setting widgets behave in just the way you’re used to. We’ve also used this opportunity to fix a number of issues the plugin had when running on hi-dpi displays (such as Apple retina displays)!


Dynamic charting of selected and visible features

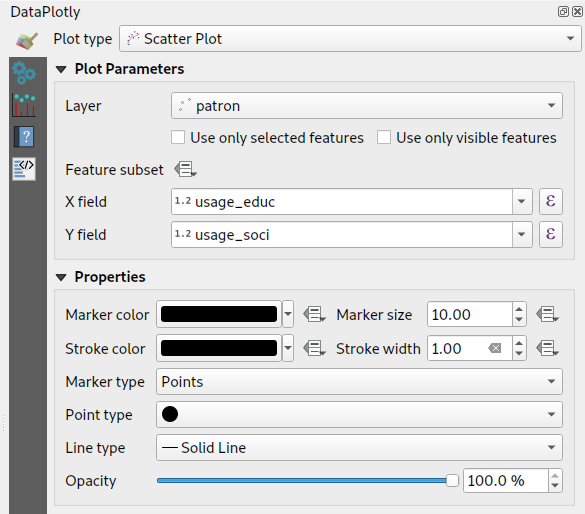
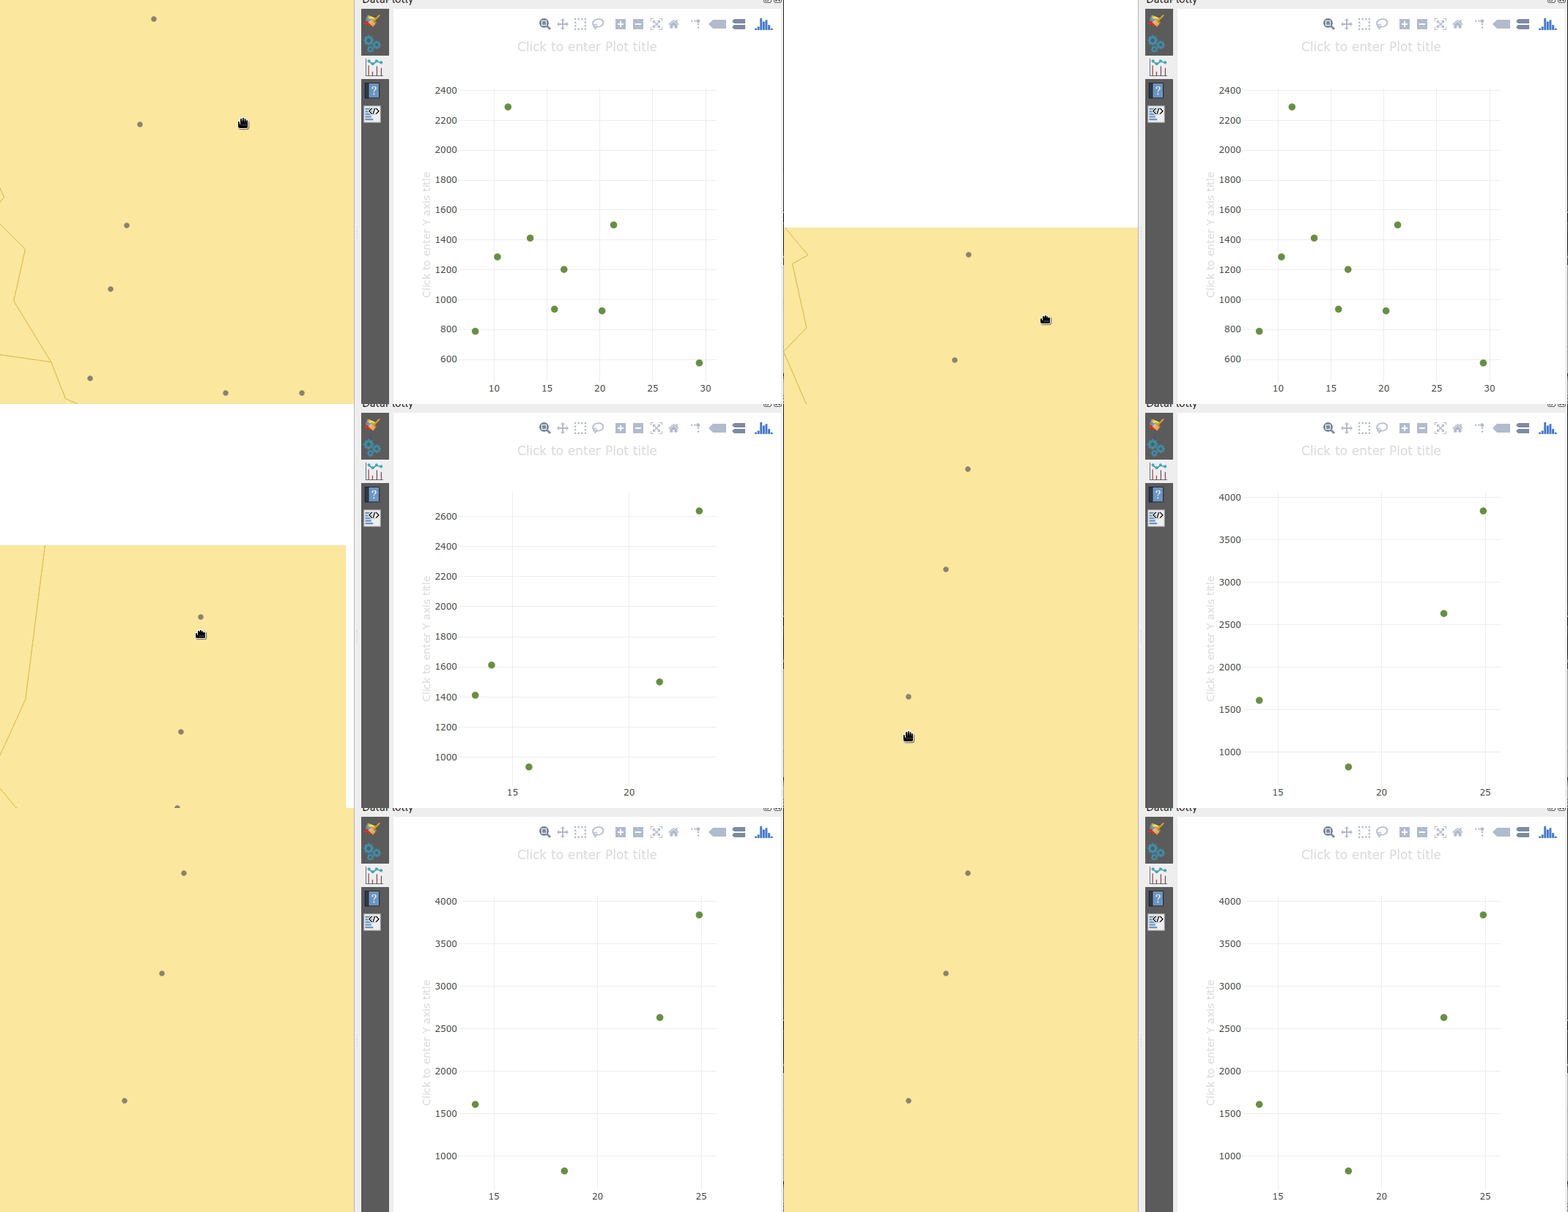
If you’ve used earlier versions of the DataPlotly plugin, you’ll likely notice that there’s many new options shown in the screenshot above. Possibly the most exciting of these is the new “Use only selected features” and “Use only visible features” checkboxes. When either of these options are enabled, then your chart will immediately respond to changes in layer selections or changes to the visible map canvas extent respectively. Previously, interactivity in the plugin only went one way (from the chart to the canvas) – but now the charts are truly interactive, and respond dynamically to changes in the canvas too!


Improved handling of “data defined” settings

During the plugin refactoring, we reworked how “data defined” settings are handled within charts. If you’re not familiar with these, “data defined” settings are QGIS’ approach for exposing per-feature control over the map rendering process. In DataPlotly charts, we expose this functionality to allow per-feature control over the chart appearance (e.g., showing different scatter plot dot colors based on feature attributes). The new code uses the same code model as QGIS itself, so data-defined settings in your charts now have full access to the whole suite of QGIS expression functions and variables that you’re used to! Additionally, QGIS data-defined assistants are fully supported in the charts too. Ultimately, this enables some very advanced styling options, such as charts which dynamically change color and appearance on every page of your print atlas…

Charts in print layouts

We’ve previously covered this feature in depth, but the DataPlotly v3 release brings print-layout based charts to the masses! When a chart is inserted into a print layout, some additional options are available for controlling the plot behavior:

These new options allow you to link the chart to a map item within the layout, which lets you filter the content of the chart to only include features visible within the map. If your print layout is setup as an atlas export, you can also filter out included features to only show those which are geographically located inside the current atlas feature.

Our partners from Faunalia demonstrate this in the screencast below:


Saving plot configuration

An often-requested functionality previous missing from the plugin was the ability to save and restore plot configuration. Now, plot configuration is automatically saved within your QGIS project and restored when you reopen the project. You no longer have to re-create all your charts from scratch at every session (ouch!). We also added the ability to export chart configuration to XML files, allowing you to share and reuse chart configuration across projects.

Behind the scenes work

Aside from all the wonderful new features added to the plugin, we’ve extensively refactored most of the plugin backend. Unit tests and CI infrastructure have been added, which will ensure the plugin remains stable and regression-free in future releases. The code cleanup and simplification has drastically lowered the barrier of contribution to the project, and we’ve already seen new contributors adding more new features to the plugin as a result of this! (Kudos to Simon Gröchenig, who added the new “Feature subset” expression option you can see in the above screenshots!).

Project sponsors

All this work is thanks to the backers of our crowdfunding campaign. Without their contributions this work would not have been possible! In no particular order, our thanks go out to:

  • Federico Gianoli
  • Papercraft Mountains
  • Liam McCrae
  • Henry Walshaw
  • Raúl Sangonzalo
  • Ferdinando Urbano
  • pitsch-ing.ch
  • Carbon-X
  • Gabriel Diosan
  • Rene Giovanni Borella
  • Enrico Bertonati
  • Guido Ingwer
  • David Addy
  • Gerd Jünger
  • Andreas Neumann
  • Stefano Campus
  • Michael Jabot
  • Korto
  • Enrico Ferreguti
  • Carlo A. Nicolini
  • Salvatore Fiandaca
  • Alberto Grava
  • Hans van der Kwast
  • Ben Hur Pintor
  • Silvio Grosso
  • Nobusuke Iwasaki
  • Alasdair Rae
  • Manori Senanayake
  • Canton de Neuchâtel
  • Matthias Daues
  • Alteri Seculo
  • SunGIS Ltd.
  • Stu Smith
  • Keolis Rennes
  • Gabriel Diosan
  • Aiden Price
  • Giacomo Ponticelli
  • Diane Fritz
  • Gemio Bissolati
  • Claire Birnie
  • Nicolas Roelandt
  • Rocco Pispico
  • Gabriel Bengtsson
  • Birds Eye View
  • Barend Köbben
  • Roberto Marzocchi (GTER)
  • Yoichi Kayama
  • Alessandro Sarretta
  • Luca Angeli
  • Luca Bellani
  • giswelt
  • Stefan Giese
  • Ben Harding
  • Joao Gaspar
  • Romain Lacroix
  • Ryan Cooper
  • Daniele Bonaposta
  • QGIS Swedish User Group
  • Nino Formica
  • Michael Gieding
  • Amedeo Fadini
  • Andrew Hannell
  • Stefano
  • Phil Wyatt
  • Brett Edmond Carlock
  • Transitec

Keep an eye out on the North Road blog for future crowd-funding initiatives. Coming soon: a QGIS Processing grab-bag of ETL modelling improvements!

SLYR ESRI to QGIS compatibility suite – October 2019 update

Recently, staff at North Road have been hard at work on our SLYR “ESRI to QGIS compatiblity suite“, and we thought it’s time to share some of the latest exciting updates with you.

While SLYR begun life as a simple “LYR to QGIS conversion tool”, it quickly matured into a full ArcGIS compatibility suite for QGIS. Aside from its original task of converting ESRI LYR files, SLYR now extends the QGIS interface and adds seamless support for working with all kinds of ArcGIS projects and data files. It’s rapidly becoming a must-have tool for any organisation which uses a mix of ESRI and open source tools, or for any organisation exploring a transition away from ArcGIS to QGIS.

Accordingly, we thought it’s well past time we posted an update detailing the latest functionality and support we’ve added to SLYR over the past couple of months! Let’s dive in…

  • Full support for raster LYR file conversion, including unique value renderers, color map renderers, classified renderers, RGB renderers and stretched color ramp renderers:

    From ArcMap…

    …to QGIS!
  • Support for conversion of fill symbol outlines with complex offsets, decorations and dashed line templates
  • Conversion of 3D marker and simple 3D lines to their 2d equivalent, matching ArcMap’s 2D rendering of these symbol types
  • Beta support for converting map annotations and drawings, including custom text labels and reference scale support
  • Label and annotation callout support*
  • Support for converting bookmarks stored in MXD documents*
  • Support for converting ESRI bookmark “.dat” files via drag and drop to QGIS*
  • Correct conversion of OpenStreetMap and bing maps basemap layers
  • SLYR now presents users with a friendly summary of warnings generated during the LYR or MXD conversion process (e.g. due to settings which can’t be matched in QGIS)
  • Added support for MXD documents generated in very early ArcMap versions
  • We’ve added QGIS Processing algorithms allowing for bulk LYR to QLR and MXD to QGS conversion. Now you can run a batch conversion process of ALL MXD/LYR files held at your organisation in one go!
  • Greatly improved matching of converted symbols to their original ArcGIS appearance, including more support for undocumented ArcGIS symbol rendering behavior
  • Support for conversion of text symbols and label settings stored in .style databases*
  • Directly drag and drop layers and layer groups from ArcMap to QGIS to add them to the current QGIS project (maintaining their ArcGIS symbology and layer settings!)*
  • Directly drag and drop layers from ArcCatalog to QGIS windows to open in QGIS*
  • Support for ESRI MapServer layers

(*requires QGIS 3.10 or later)

Over the remainder of 2019, we’ll be hard at work further improving SLYR’s support for MXD document conversion, and adding support for automatic conversion of ArcMap print layouts to QGIS print layouts.

While SLYR is not currently an open-source tool, we believe strongly in the power of open source software, and accordingly we’ve been using a significant portion of the funds generated from SLYR sales to extend the core QGIS application itself. This has directly resulted in many exciting improvements to QGIS, which will become widely available in the upcoming QGIS 3.10 release. Some of the features directly funded by SLYR sales include:

  • A “Segment Center” placement mode for marker line symbols
  • Reworked bookmark handling in QGIS, with a greatly enhanced workflow and usability, and a stable API for 3rd party plugins and scripts to hook into
  • Improved handling of layer symbology for layers with broken paths
  • Auto repair of all other broken layers with a matching data source whenever a single layer path is fixed in a project
  • Support for managing text formats and label settings in QGIS style libraries, allowing storage and management of label and text format presets
  • A new Processing algorithm “Combine Style Databases“, allowing multiple QGIS style databases to be merged to one
  • Adding a “Save layer styles into GeoPackage” option for the “Package Layers” algorithm
  • New expression functions which return file info, such as file paths and base file names
  • Adding new options to autofill the batch Processing dialog, including adding input files using recursive filter based file searches
  • Coming in QGIS 3.12: A new option to set the color to use when rendering nodata pixels in raster layers
  • Coming in QGIS 3.12: A new “random marker fill” symbol layer type, which fills polygons by placing point markers in random locations

You can read more about our SLYR ESRI to QGIS compatibility tool here, or email [email protected] to discuss licensing arrangements for your organisation! Alternatively, send us an email if you’d like to discuss your organisations approach to open-source GIS and for assistance in making this transition as painless as possible.

QGIS Print Layouts Graphs and Charts — Beta Out Now!

Thanks to the success of our recent QGIS Print Layouts Graphs and Charts crowdfunding campaign, staff at North Road and Faunalia have been busy updating and improving the QGIS “DataPlotly” plugin with the goal of allowing beautiful charts inside your print layouts.

We’re super-excited to announce that the beta release of this new functionality is now available! With this beta installed, you’ll see a new icon in your QGIS Print Layout designer window:

Clicking this button will allow you to draw a new plot onto your print layout, just like you would any other standard layout item (like legends, scalebars, etc). Any print layout chart can be customised by right-clicking the chart and selecting “Item Properties“. This will open a panel with settings like position, size, frame, and other standard options. All the magic happens when you click the “Setup Plot” button inside this panel:

This exposes the vast array of styling and charting options available for use. If you’re an existing user of the DataPlotly QGIS plugin, you’ll recognise that these are the same settings you have available when creating interactive plots alongside the main map canvas. Every setting is now available for use in print layouts!


To grab the beta, head over to https://github.com/ghtmtt/DataPlotly/releases/tag/v3.9-beta and download the DataPlotly.zip file. Then, inside QGIS, select the Manage and Install Plugins option from the Plugins menu. Click on the “Install from ZIP” section, and point the dialog at your downloaded DataPlotly.zip file. Click “Install Plugin“, and then restart QGIS for good measure. When QGIS restarts you should see the new chart icon inside the print layout designer.

Note that you’ll need a recent QGIS release for this to work correctly — either QGIS 3.8.3 or 3.4.12. (The print layout functionality may not be compatible with earlier releases, as we’ve had to fix several issues inside QGIS itself to get this feature working as designed!). 

We are actively seeking feedback and user testing on this beta release. If you encounter any issues, just head over to https://github.com/ghtmtt/DataPlotly/issues and let us know.

We’ll be further refining this functionality, with the goal of releasing the final non-beta version of the plugin to coincide with the upcoming QGIS 3.10 release.

Happy charting!

QGIS 3.10 Loves GeoPDF!

Recently, we’ve been working on an exciting development which is coming soon in QGIS 3.10… support for Geospatial PDF exports! This has been a long-desired feature for many QGIS users, and it was only made possible thanks to a group of financial backers (listed below). In this post, we’re going to explore these new features and how they improve your QGIS PDF outputs.

Geospatial PDFs can now be created either by exporting the main QGIS map canvas, or by creating and exporting a custom print layout. For instance, when you select the “Save Map as PDF” option from the main QGIS window, you’ll see a new group of Geospatial PDF related options:

At its most basic, Geospatial PDF is a standard extension to the PDF format which allows for vector spatial datasets to be embedded in PDF files. If the “Include vector feature information” checkbox is ticked when creating a Geospatial PDF output, then QGIS will automatically include all the geometry and attribute information from features visible within the page. So if we export a simple map to PDF, we’ll get an output file which looks just like any old regular PDF map output…

…but, we can also pull this PDF back into QGIS and treat it just like any other vector data source! In the screenshot below we’re using the Identify tool to query on of the polygons and see all the attribute information from the original source layer.

This ability adds a lot of value to PDF exports. Anyone who has ever been supplied a non-spatial PDF as a “spatial dataset” will attest to the frustrations these cause… but if you create proper Geospatial PDFs instead, then there’s no loss of the valuable underlying spatial information or feature attributes! Furthermore, if these PDFs are opened within Acrobat Reader, tools are enabled which allow users to query features interactively.

Another nice benefit which comes with Geospatial PDF output is that layers can be interactively toggled on or off in the PDF viewer. The screenshot below shows a Geospatial PDF file created from a simple QGIS map. On the left we have a list of the layers in the PDF, each of which can be turned on or off inside the PDF viewer!

The really nice thing here is that, thanks to the underlying smarts in the GDAL library which is responsible for the actual Geospatial PDF creation, the PDF renders identically to our original QGIS map. While labels turn on and off alongside their corresponding map layer, they are still correctly stacked in the exact same way as you see in the QGIS window. Furthermore, the created PDFs keep labels and vector features as vector artwork… so there’s absolutely no loss in quality when zooming in to the map! These files look GREAT!

On that same note… the sponsorship allowed us to tackle another related issue, which is that in previous QGIS versions PDF (or SVG) exports would always export every single vertex from any visible feature! Ouch! This meant that if you had a complex polygon boundary layer, you would potentially be creating a PDF with millions of vertices per feature, even though most of these would be overlapping and completely redundant at the exported map’s scale. Now, QGIS automatically simplifies vector features while exporting them (using an appropriate, effectively invisible, level of simplification). The dramatically reduces the created file sizes and speeds up opening them and navigating them in other applications (especially Inkscape). (There’s an option at export time to disable this simplification, if you have a specific reason to!).

Creating Geospatial PDFs from print layouts gives even more options. For a start, whenever a print layout is exported to Geospatial PDFs, we ensure that the created PDF correctly handles stacking of layers alongside any other print layout items you have. In the image below we see a custom print layout which includes interactive layer visibility controls. If a layer is toggled, it’s hidden only from the map item — all the other surrounding elements like the title, north arrow and scalebar remain visible:

That’s not all though! When exporting a print layout to Geospatial PDF, QGIS also hooks into any map themes you’ve setup in your project. If you select to include these themes in your output, then the result is magical! The screenshot below shows the export options for a project with a number of themes, and we’ve chosen to export these themes in the PDF:

Opening the resultant PDF shows that our layer control on the left now lists the map themes instead of individual layers. Viewers can switch between these themes, changing the visibility of layers and their styling to match the QGIS map theme from the project! Additionally, you can even expand out a theme and expose layer-by-layer visibility control. Wow! This means you could create a single PDF output file which includes an environmental, social, cadastral, transport, …. view of your map, all in the one file.

Lastly, there’s even control for fine-tuning the combination of layers which are exposed in the output PDF file and which ones should be toggled on and off together. In the screenshot below we’ve opted to group the “Aircraft” and “Roads” map layers into a single logical PDF group called “Transport”. 

The resultant PDF respects this, showing an entry in the interactive layer tree for “Transport” which toggles both the aircraft and roads layers together:

So there you go — the power of Geospatial PDF, coming your way in QGIS 3.10!

One semi-related benefit of this work is that it gave us an opportunity to rework how “layered” exports from print layouts are created. This has had a significant flow-on impact on the existing ability to create layered SVG outputs from QGIS. Previously, this was a rather fragile feature, which created SVGs with lots of issues – overlapping labels, incorrectly stacked layers, and last-but-not-least, non-descriptive layer names! Now, just like Geospatial PDF exports, the layered SVG exports correctly respect the exact look of your map, and have much more friendly, descriptive layer names:

This should significantly reduce the amount of housekeeping required when working on these layered SVG exports. 

This work was funded by:

  • Land Vorarlberg
  • Municipality of Vienna
  • Municipality of Dornbirn
  • Biodiversity Information Service for Powys and BBNP Local
  • Kanton Zug
  • Canton de Neuchâtel
  • Canton de Thurgovia

North Road are leading experts in extending the QGIS application to meet your needs. If you’d like to discuss how you can sponsor development of features or fixes which you want in QGIS, just contact us for further details!


Funding for selective masking in QGIS is now complete!

Few months ago, Oslandia launched QGIS lab’s , a place to advertise our new ideas for QGIS, but also a place to help you find co funders to make dreams become reality.

The first initiative is about label selective masking, a feature that will allow us to achieve even more professional rendering for our maps.

Selective masking


Thanks to the commitment of the Swiss QGIS user group and local authorities, this work is now funded !

We now can start working hard to deliver you this great feature for QGIS 3.10

Thanks again to our funders

A last word, this is not a classical crowd funding initiative, but a classical contract for each funder.

No more reason not to contribute to free and open source software!

QGIS Print Layouts Graphs and Charts — target reached!

We’ve just passed the extended deadline for our recent QGIS Print Layouts Graphs and Charts campaign, and the great news is that thanks to a large number of generous backers we’ve successfully hit the target for this campaign! This has only been possible thanks to the tireless work of the QGIS community and user groups in promoting this campaign and spreading the word.

The Print Layouts Graphs and Charts campaign is a joint effort with our friends at Faunalia, so we’ll soon be starting work together on all the wonderful new functionality heading to the QGIS DataPlotly plugin as a result. The work will be commencing late June, just after the QGIS 3.8.0 final release. Keep an eye out for further updates on the development from this time! You can read more about what’s coming in detail at the campaign page.

We’d like to take this opportunity to extend our heartfelt thanks to all the backers who have pledged to support this project:

  • Federico Gianoli
  • Papercraft Mountains
  • Liam McCrae
  • Henry Walshaw
  • Raúl Sangonzalo
  • Ferdinando Urbano
  • pitsch-ing.ch
  • Carbon-X
  • Gabriel Diosan
  • Rene Giovanni Borella
  • Enrico Bertonati
  • Guido Ingwer
  • David Addy
  • Gerd Jünger
  • Andreas Neumann
  • Stefano Campus
  • Michael Jabot
  • Korto
  • Enrico Ferreguti
  • Carlo A. Nicolini
  • Salvatore Fiandaca
  • Alberto Grava
  • Hans van der Kwast
  • Ben Hur Pintor
  • Silvio Grosso
  • Nobusuke Iwasaki
  • Alasdair Rae
  • Manori Senanayake
  • Canton de Neuchâtel
  • Matthias Daues
  • Alteri Seculo
  • SunGIS Ltd.
  • Stu Smith
  • Keolis Rennes
  • Gabriel Diosan
  • Aiden Price
  • Giacomo Ponticelli
  • Diane Fritz
  • Gemio Bissolati
  • Claire Birnie
  • Nicolas Roelandt
  • Rocco Pispico
  • Gabriel Bengtsson
  • Birds Eye View
  • Barend Köbben
  • Roberto Marzocchi (GTER)
  • Yoichi Kayama
  • Alessandro Sarretta
  • Luca Angeli
  • Luca Bellani
  • giswelt
  • Stefan Giese
  • Ben Harding
  • Joao Gaspar
  • Romain Lacroix
  • Ryan Cooper
  • Daniele Bonaposta
  • QGIS Swedish User Group
  • Nino Formica
  • Michael Gieding
  • Amedeo Fadini
  • Andrew Hannell
  • Stefano
  • Phil Wyatt
  • Brett Edmond Carlock
  • Transitec


  • <<
  • Page 2 of 9 ( 169 posts )
  • >>
  • osgeo

Back to Top

Sustaining Members