Related Plugins and Tags

QGIS Planet

Where's my .qgis3 Folder?

There's been several posts to GIS StackExchange along the lines of:

Where's my .qgis3 folder?

Prior to QGIS 3, the .qgis/.qgis2 folder was found under your home directory. At version 3, the folder has moved to a more standard profile location for your operating system.

There are a couple of ways to determine where the folder is located:

  • Use the Settings->User Profiles->Open active profile folder menu item
  • Use QgsApplication.qgisSettingsDirPath from Python or the console

Here are the "standard" locations for Linux, Mac, and Windows, as found under your HOME directory:

  • Linux:
    • .local/share/QGIS/QGIS3/profiles/default
  • Mac OS X:
    • Library/Application Support/QGIS/QGIS3/profiles/default
  • Windows:
    • AppData\Roaming\QGIS\QGIS3\profiles\default

To get the location of your plugins directory, just add python/plugins to the appropriate location above. For example:

AppData\Roaming\QGIS\QGIS3\profiles\default\python\plugins

From the Settings->User Profiles menu, you'll notice a New profile item. This allows you to have multiple configurations of QGIS 3. Each new profile is created in the same "base" location as listed above. For example:

AppData\Roaming\QGIS\QGIS3\profiles\new_profile

Implementing an in-house “New Project Wizard” for QGIS

Recently, we were required to implement a custom “New Project Wizard” for use in a client’s internal QGIS installation. The goal here was that users would be required to fill out certain metadata fields whenever they created a new QGIS project.

Fortunately, the PyQGIS (and underlying Qt) libraries makes this possibly, and relatively straightforward to do. Qt has a powerful API for creating multi-page “wizard” type dialogs, via the QWizard and QWizardPage classes. Let’s have a quick look at writing a custom wizard using these classes, and finally we’ll hook it into the QGIS interface using some PyQGIS magic.

We’ll start super simple, creating a single page wizard with no settings. To do this we first create a Page1 subclass of QWizardPage, a ProjectWizard subclass of QWizard, and a simple runNewProjectWizard function which launches the wizard. (The code below is designed for QGIS 3.0, but will run with only small modifications on QGIS 2.x):


class Page1(QWizardPage):

    def __init__(self, parent=None):
        super().__init__(parent)
        self.setTitle('General Properties')
        self.setSubTitle('Enter general properties for this project.')


class ProjectWizard(QWizard):
    
    def __init__(self, parent=None):
        super().__init__(parent)
        
        self.addPage(Page1(self))
        self.setWindowTitle("New Project")


def runNewProjectWizard():
    d=ProjectWizard()
    d.exec()

If this code is executed in the QGIS Python console, you’ll see something like this:

Not too fancy (or functional) yet, but still not bad for 20 lines of code! We can instantly make this a bit nicer by inserting a custom logo into the widget. This is done by calling setPixmap inside the ProjectWizard constructor.


class ProjectWizard(QWizard):
    
    def __init__(self, parent=None):
        super().__init__(parent)
        
        self.addPage(Page1(self))
        self.setWindowTitle("New Project")

        logo_image = QImage('path_to_logo.png')
        self.setPixmap(QWizard.LogoPixmap, QPixmap.fromImage(logo_image))

That’s a bit nicer. QWizard has HEAPS of options for tweaking the wizards — best to read about those over at the Qt documentation. Our next step is to start adding some settings to this wizard. We’ll keep things easy for now and just insert a number of text input boxes (QLineEdits) into Page1:


class Page1(QWizardPage):

    def __init__(self, parent=None):
        super().__init__(parent)
        self.setTitle('General Properties')
        self.setSubTitle('Enter general properties for this project.')

        # create some widgets
        self.project_number_line_edit = QLineEdit()
        self.project_title_line_edit = QLineEdit()
        self.author_line_edit = QLineEdit()        
        
        # set the page layout
        layout = QGridLayout()
        layout.addWidget(QLabel('Project Number'),0,0)
        layout.addWidget(self.project_number_line_edit,0,1)
        layout.addWidget(QLabel('Title'),1,0)
        layout.addWidget(self.project_title_line_edit,1,1)
        layout.addWidget(QLabel('Author'),2,0)
        layout.addWidget(self.author_line_edit,2,1)
        self.setLayout(layout)

There’s nothing particularly new here, especially if you’ve used Qt widgets before. We make a number of QLineEdit widgets, and then create a grid layout containing these widgets and accompanying labels (QLabels). Here’s the result if we run our wizard now:

So now there’s the option to enter a project number, title and author. The next step is to force users to populate these fields before they can complete the wizard. Fortunately, QWizardPage has us covered here and we can use the registerField() function to do this. By calling registerField, we make the wizard aware of the settings we’ve added on this page, allowing us to retrieve their values when the wizard completes. We can also use registerField to automatically force their population by appending a * to the end of the field names. Just like this…

class Page1(QWizardPage):
    def __init__(self, parent=None):
        super().__init__(parent)
        ...
        self.registerField('number*',self.project_number_line_edit)
        self.registerField('title*',self.project_title_line_edit)
        self.registerField('author*',self.author_line_edit)

If we ran the wizard now, we’d be forced to enter something for project number, title and author before the Finish button becomes enabled. Neat! By registering the fields, we’ve also allowed their values to be retrieved after the wizard completes. Let’s alter runNewProjectWizard to retrieve these values and do something with them:

def runNewProjectWizard():
   d=ProjectWizard()
   d.exec()

   # Set the project title
   title=d.field('title')
   QgsProject.instance().setTitle(d.field('title'))

   # Create expression variables for the author and project number
   number=d.field('number')
   QgsExpressionContextUtils.setProjectVariable(QgsProject.instance(),'project_number', number)
   author=d.field('author')
   QgsExpressionContextUtils.setProjectVariable(QgsProject.instance(),'project_author', author)
 

Here, we set the project title directly and create expression variables for the project number and author. This allows their use within QGIS expressions via the @project_number and @project_author variables. Accordingly, they can be embedded into print layout templates so that layout elements are automatically populated with the corresponding author and project number. Nifty!

Ok, let’s beef up our wizard by adding a second page, asking the user to select a sensible projection (coordinate reference system) for their project. Thanks to improvements in QGIS 3.0, it’s super-easy to embed a powerful pre-made projection selector widget into your scripts, which even includes a handy preview of the area of the world that the projection is valid for.


class Page2(QWizardPage):

    def __init__(self, parent=None):
        super().__init__(parent)
        self.setTitle('Project Coordinate System')
        self.setSubTitle('Choosing an appropriate projection is important to ensure accurate distance and area measurements.')
        
        self.proj_selector = QgsProjectionSelectionTreeWidget()
        layout = QVBoxLayout()
        layout.addWidget(self.proj_selector)
        self.setLayout(layout)
        
        self.registerField('crs',self.proj_selector)
        self.proj_selector.crsSelected.connect(self.crs_selected)
        
    def crs_selected(self):
        self.setField('crs',self.proj_selector.crs())
        self.completeChanged.emit()
        
    def isComplete(self):
        return self.proj_selector.crs().isValid()

There’s a lot happening here. First, we subclass QWizardPage to create a second page in our widget. Then, just like before, we add some widgets to this page and set the page’s layout. In this case we are using the standard QgsProjectionSelectionTreeWidget to give users a projection choice. Again, we let the wizard know about our new setting by a call to registerField. However, since QWizard has no knowledge about how to handle a QgsProjectionSelectionTreeWidget, there’s a bit more to do here. So we make a connection to the projection selector’s crsSelected signal, hooking it up to a function which sets the wizard’s “crs” field value to the widget’s selected CRS. Here, we also emit the completeChanged signal, which indicates that the wizard page should re-validate the current settings. Lastly, we override QWizardPage’s isComplete method, checking that there’s a valid CRS selection in the selector widget. If we run the wizard now we’ll be forced to choose a valid CRS from the widget before the wizard allows us to proceed:

Lastly, we need to adapt runNewProjectWizard to also handle the projection setting:


def runNewProjectWizard():
    d=ProjectWizard()
    d.exec()

    # Set the project crs
    crs=d.field('crs')
    QgsProject.instance().setCrs(crs)

    # Set the project title
    title=d.field('title')
    ...

Great! A fully functional New Project wizard. The final piece of the puzzle is triggering this wizard when a user creates a new project within QGIS. To do this, we hook into the iface.newProjectCreated signal. By connecting to this signal, our code will be called whenever the user creates a new project (after all the logic for saving and closing the current project has been performed). It’s as simple as this:


iface.newProjectCreated.connect(runNewProjectWizard)

Now, whenever a new project is made, our wizard is triggered – forcing users to populate the required fields and setting up the project accordingly!

There’s one last little bit to do – we also need to prevent users cancelling or closing the wizard before completing it. That’s done by changing a couple of settings in the ProjectWizard constructor, and by overriding the default reject method (which prevents closing the dialog by pressing escape).


class ProjectWizard(QWizard):
    
    def __init__(self, parent=None):
        super().__init__(parent)
        ...
        self.setOption(QWizard.NoCancelButton, True)
        self.setWindowFlags(self.windowFlags() | QtCore.Qt.CustomizeWindowHint)
        self.setWindowFlags(self.windowFlags() & ~QtCore.Qt.WindowCloseButtonHint)

    def reject(self):
        pass

Here’s the full version of our code, ready for copying and pasting into the QGIS Python console:


icon_path = '/home/nyall/nr_logo.png'

class ProjectWizard(QWizard):
    
    def __init__(self, parent=None):
        super().__init__(parent)
        
        self.addPage(Page1(self))
        self.addPage(Page2(self))
        self.setWindowTitle("New Project")
        
        logo_image=QImage('path_to_logo.png')
        self.setPixmap(QWizard.LogoPixmap, QPixmap.fromImage(logo_image))
        
        self.setOption(QWizard.NoCancelButton, True)
        self.setWindowFlags(self.windowFlags() | QtCore.Qt.CustomizeWindowHint)
        self.setWindowFlags(self.windowFlags() & ~QtCore.Qt.WindowCloseButtonHint)
    def reject(self):
        pass
class Page1(QWizardPage):
    
    def __init__(self, parent=None):
        super().__init__(parent)
        self.setTitle('General Properties')
        self.setSubTitle('Enter general properties for this project.')

        # create some widgets
        self.project_number_line_edit = QLineEdit()
        self.project_title_line_edit = QLineEdit()
        self.author_line_edit = QLineEdit()        
        
        # set the page layout
        layout = QGridLayout()
        layout.addWidget(QLabel('Project Number'),0,0)
        layout.addWidget(self.project_number_line_edit,0,1)
        layout.addWidget(QLabel('Title'),1,0)
        layout.addWidget(self.project_title_line_edit,1,1)
        layout.addWidget(QLabel('Author'),2,0)
        layout.addWidget(self.author_line_edit,2,1)
        self.setLayout(layout)
        
        self.registerField('number*',self.project_number_line_edit)
        self.registerField('title*',self.project_title_line_edit)
        self.registerField('author*',self.author_line_edit)
 
 
class Page2(QWizardPage):
    
    def __init__(self, parent=None):
        super().__init__(parent)
        self.setTitle('Project Coordinate System')
        self.setSubTitle('Choosing an appropriate projection is important to ensure accurate distance and area measurements.')
        
        self.proj_selector = QgsProjectionSelectionTreeWidget()
        layout = QVBoxLayout()
        layout.addWidget(self.proj_selector)
        self.setLayout(layout)
        
        self.registerField('crs',self.proj_selector)
        self.proj_selector.crsSelected.connect(self.crs_selected)
        
    def crs_selected(self):
        self.setField('crs',self.proj_selector.crs())
        self.completeChanged.emit()
        
    def isComplete(self):
        return self.proj_selector.crs().isValid()
 
        
def runNewProjectWizard():
    d=ProjectWizard()
    d.exec()
    
    # Set the project crs
    crs=d.field('crs')
    QgsProject.instance().setCrs(crs)
    
    # Set the project title
    title=d.field('title')
    QgsProject.instance().setTitle(d.field('title'))

    # Create expression variables for the author and project number
    number=d.field('number')
    QgsExpressionContextUtils.setProjectVariable(QgsProject.instance(),'project_number', number)
    author=d.field('author')
    QgsExpressionContextUtils.setProjectVariable(QgsProject.instance(),'project_author', author)
    
    
iface.newProjectCreated.connect(runNewProjectWizard)

Working with QGIS 3D - Part 1

In QGIS 3, we have introduced support for 3D canvas. Most of the functionalities are intuitive and easy to use. But there are some configuration options which are hidden and require a bit of more in-depth explanation for users and developers.

This blog post and the follow-up ones will discuss a range of topics: data sources, 3D canvas navigation, configuration, working with various types of layers, styling and more!

Data Sources

To work with QGIS 3D, you need data: rasters and vectors. We will use digital terrain model rasters for 3D visualisation purpose. You can download SRTM data from the SRTM Tile Downloader.

For vectors, you can use any point, line and polygon data. There are different methods of creating 3D objects from each data type in the 3D canvas. If you want true 3D data representing buildings, you can download CityGML data from the list of open CityGML datasets.

For the purpose of these blog posts, we will use SRTM data for Mont Blanc and CityGML data for Berlin.

Note: You need to use a projected coordinate reference system in metres (or feet in case you belong to one of these countries) for your data and canvas to be able to use QGIS 3D.

3D Canvas and Navigation

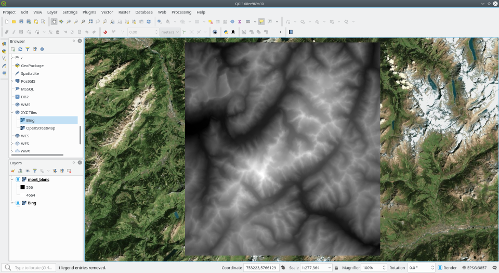
To start with, we are going to add the terrain model for Mont Blanc to the QGIS canvas. Bing Aerial photo (as XYZ tiles layer) was also loaded in QGIS.

Mont Blanc terrain model with Bing aerial in QGIS.
(Click to enlarge)

To view the 3D canvas, in the main menu select View > New 3D Map View

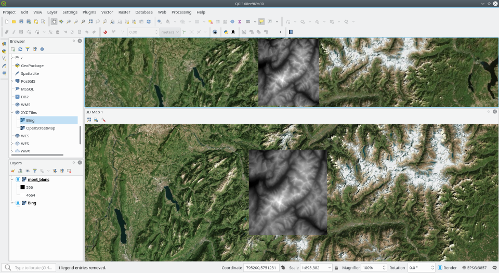
A floating QGIS panel will appear. You can drag the panel to the bottom part of your canvas to dock it.

3D and 2D canvases in QGIS 3.
(Click to enlarge)

To start with, the 3D view shows the same extent and view as seen in the 2D canvas. Also note that there is no dedicated toolbar for navigation in the 3D canvas. You can zoom in/out and pan in the 3D canvas in the same way as in the main 2D canvas:

  • Move around map
    • by dragging the map with left mouse button pressed
    • by using up/down/left/right keys
  • Zoom map in/out
    • by using the mouse wheel
    • by dragging mouse up/down with right mouse button pressed

The following additional options allow you to explore the map in 3D:

  • Tilt / rotate camera
    • by dragging the mouse with middle mouse button pressed
    • by pressing Shift and dragging the mouse with left mouse button pressed
    • by pressing Shift and using up/down/left/right keys

To reset the camera view, click Zoom Full button in the 3D canvas panel.

Terrain Configuration

You can use a terrain raster to represent 3D elevation in your canvas. It is expected that such raster layer contains one band where each raster cell represents elevation. To do that, click Options button to open a new window with 3D view configuration. After selecting your raster layer for Elevation and clicking OK, you should be able to see Mont Blanc in the 3D view:
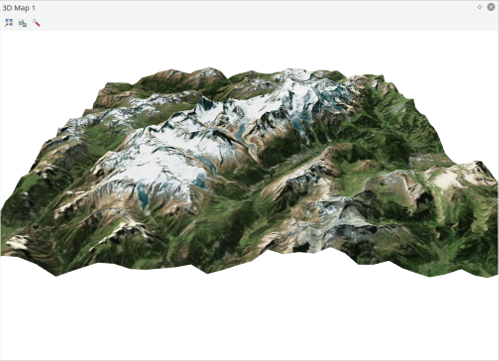
3D view of Mont Blanc.
(Click to enlarge)

Advanced Configuration

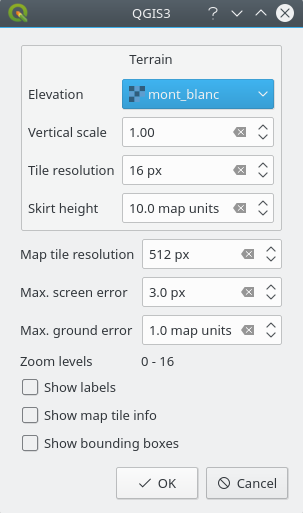
In the configuration window there are various other options to fine-tune the 3D scene - let’s have a closer look at their meaning. Before diving into the details, it is worth noting that terrain in 3D view is represented by a hierarchy of terrain tiles and as the camera moves closer to the terrain, existing tiles that do not have sufficient detail are replaced by smaller tiles with more details. Each tile has mesh geometry derived from the elevation raster layer and texture created by rendering 2D map for the extent of the tile.

QGIS 3D configuration

Here is the complete list of the configuration options and their meaning:

  • Elevation: Raster to be used for generation of terrain.
  • Vertical scale: Scale factor for vertical axis. Raising the scale will make even small hills look like mountains!
  • Tile resolution: How many samples from the terrain raster layer to use for each tile. The value of 16 px means that geometry of each tile will be built from 16x16 elevation samples. Higher number creates more detailed terrain tiles at the expense of increased rendering complexity.
  • Skirt height: Sometimes it is possible to see small cracks between tiles of the terrain. Raising this value will add vertical walls (“skirts”) around terrain tiles to hide the cracks.
  • Map tile resolution: Width and height of 2D map images used as textures for terrain tiles. The value of 256 px means that each tile will have map rendered into image of 256x256 pixels. Higher number creates more detailed terrain tiles at the expense of increased rendering complexity.
  • Max. screen error: Determines threshold when existing terrain tiles are swapped to more detailed ones (and vice versa) - i.e. how soon 3D view will use higher quality tiles. Lower number means more details in the scene at the expense of increased rendering complexity.
  • Max. ground error: Tells the 3D view at what resolution of terrain tiles it is fine to stop dividing them into more detailed tiles (because splitting them would not introduce any extra detail anyway). This value limits the depth of the hierarchy of tiles: lower value makes the hierarchy depth, increasing rendering complexity.
  • Zoom levels: Show how many zoom levels will be used (depends on map tile resolution and max. ground error).
  • Show labels: Toggles the map labels on/off
  • Show map tile info: Adds border and tile numbers to terrain tiles (useful for troubleshooting terrain issues)
  • Show bounding boxes: Shows 3D bounding boxes of terrain tiles (useful for troubleshooting terrain issues)

You may also like...

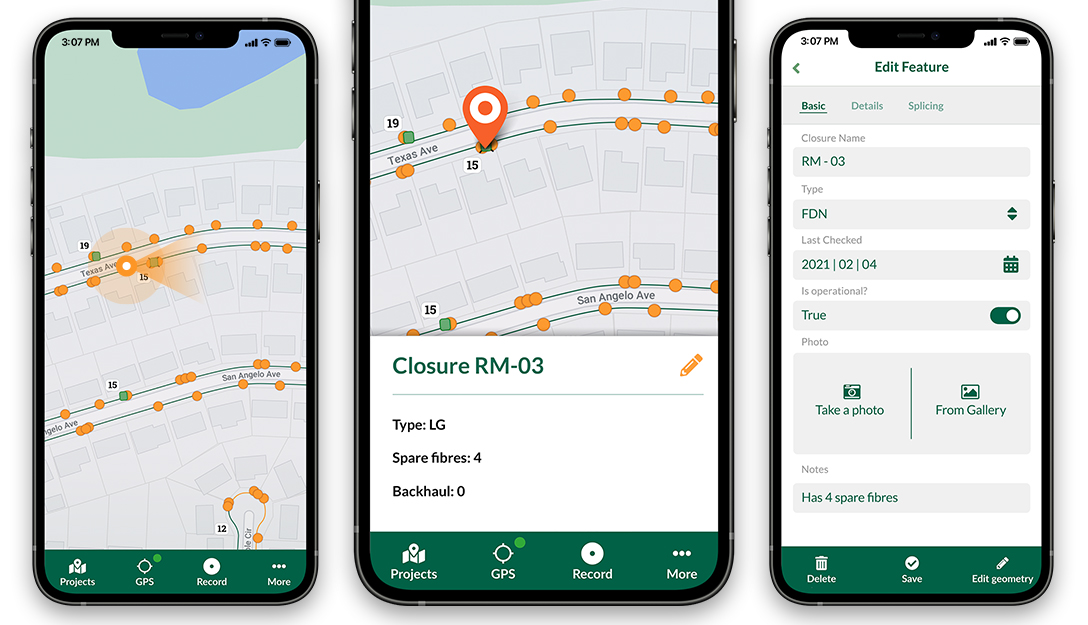
Mergin Maps, a field data collection app based on QGIS. Mergin Maps makes field work easy with its simple interface and cloud-based sync. Available on Android, iOS and Windows. Screenshots of the Mergin Maps mobile app for Field Data Collection
Get it on Google Play Get it on Apple store

Welcome QGIS 3 and bye bye Madeira

Last week I’ve been in Madeira at the hackfest, like all the past events this has been an amazing happening, for those of you who have never been there, a QGIS hackfest is typically an event where QGIS developers and other pasionate contributors like documentation writers, translators etc. gather together to discuss the future of their beloved QGIS software. QGIS hackfest are informal events where meetings are scheduled freely and any topic relevant to the project can be discussed. This time we have brought to the table some interesting topics like:

  • the future of processing providers: should they be part of QGIS code or handled independently as plugins?
  • the road forward to a better bug reporting system and CI platform: move to gitlab?
  • the certification program for QGIS training courses: how (and how much) training companies should give back to the project?
  • SWOT analysis of current QGIS project: very interesting discussion about the status of the project.
  • QGIS Qt Quick modules for mobile QGIS app
Tehre were also some mentoring sessions where I presented:
  • How to set up a development environment and make your first pull request
  • How to write tests for QGIS (in both python and C++)
  At this link you can find all the video recordings of the sessions: https://github.com/qgis/QGIS/wiki/DeveloperMeetingMadeira2018   Here is a link to the Vagrant QGIS developer VM I’ve prepared for the session: https://github.com/elpaso/qgis-dev-vagrant/   I’ve got a good feedback from other devs about my sessions and I’m really happy that somebody found them useful, one of the main goals of a QGIS hackfest should really be to help other developers to ramp up quicly into the project. Other than that, I’ve also find the time to update to QGIS 3.0 some of my old plugins like GeoCoding and QuickWKT.   Thanks to Giovanni Manghi and to Madeira Government for the organizazion and thanks to all QGIS sponsors and donors!   About me: I started as a QGIS plugin author, continued as the developer of the plugin official repository at https://plugins.qgis.org and now I’m one of the top 5 QGIS core contributors. After almost 10 years that I’m in the QGIS project I’m now not only a proud member of the QGIS community but also an advocate for the open source GIS software movement.

The post Welcome QGIS 3 and bye bye Madeira first appeared on Open Web Solutions, GIS & Python Development.

QGIS 3.0 has been released

We are very pleased to convey the announcement of the  QGIS 3.0 major release called “Girona”.

The whole QGIS community has been working hard on so many changes for the last two years. This version is a major step in the evolution of QGIS. There are a lot of features, and many changes to the underlying code.

At Oslandia, we pushed some great new features, a lot of bugfixes and made our best to help in synchronizing efforts with the community.

Please note that the installers and binaries are still currently being built for all platforms, Ubuntu and Windows are already there,  and Mac packages are still building.

The ChangeLog and the documentation are still being worked on so please start testing that brand new version and let’s make it stronger and stronger together. The more contributors, the better!

While QGIS 3.0 represent a lot of work, note that this version is not a “Long Term Release” and may not be as stable as required for production work.

We would like to thank all the contributors who helped making QGIS 3 a reality.

Oslandia contributors should acknowledged too : Hugo Mercier, Paul Blottière, Régis Haubourg, Vincent Mora and Loïc Bartoletti.

We also want to thank some those who supported directly important features of QGIS3 :

Orange

The QWAT / QGEP organization

The French Ministry for an Ecological and Inclusive Transition

ESG

and also Grenoble Alpes Métropole

blog:qgis_3.0_juz_w_piekarniku

W dniach 21-25 lutego 2018 na Maderze odbywa się spotkanie programistów (hackfest) projektu QGIS. Najbardziej oczekiwaną przez wszystkich użytkowników informacją jest wydanie nowej wersji QGIS 3.0 o nazwie kodowej Girona. Kod źródłowy jest już „umieszczony w piekarniku” i niebawem ciepłe paczki instalacyjne będą gotowe do pobrania. Nowa linia programu niesie ze sobą wiele zmian, począwszy od tych związanych z bibliotekami i API, na związanych ze zmianami interfejsu i nowymi funkcjami kończąc.…

QGIS 3.0 Girona is released!

We are pleased to announce the release of QGIS 3.0 ‘Girona’. The city of Girona was the location of our 15th developer meeting.

This is the first release in the 3.x series. It comes with tons of new features (see our visual changelog) and under-the-hood updates. As such, we do not expect it to be as reliable as the 2.18 LTR just yet.

From now on, 2.18 is the only Long Term Release (LTR) and 2.14 is retired.

Once the release is done, our packagers will start preparing packages for different operating systems. We’ll keep you updated when different packages and installers become available.

We would like to thank the developers, documenters, testers and all the many folks out there who volunteer their time and effort (or fund people to do so). From the QGIS community we hope you enjoy this release! If you wish to donate time, money or otherwise get involved in making QGIS more awesome, please wander along to qgis.org and lend a hand!

QGIS is supported by donors and sponsors. A current list of donors who have made financial contributions large and small to the project can be seen on our donors list. If you would like to become and official project sponsor, please visit our sponsorship page for details. Sponsoring QGIS helps us to fund our six monthly developer meetings, maintain project infrastructure and fund bug fixing efforts. A complete list of current sponsors is provided below – our very great thank you to all of our sponsors!

QGIS is Free software and you are under no obligation to pay anything to use it – in fact we want to encourage people far and wide to use it regardless of what your financial or social status is – we believe empowering people with spatial decision making tools will result in a better society for all of humanity.


(Nederlands) Waarden in samengestelde velden gebruiken

Sorry, this entry is only available in the Dutch language

Resources for QGIS3

The release of 3.0 is really close now. If you want to know what’s new or are just looking for interesting ways to pass the time until the packages land, check out the following QGIS3 resources.

For users

For more recordings from the developer meeting in Madeira check my Youtube playlist.

For developers

If you have further reading recommendations, please post them in the comments below.


Diagrams for features

Imagine you have a list of different features at locations and you want to display those on a map like this: The QGIS diagrams expect a column for each pie or bar, but our features are all listed in one column: And our geometry is stored in a good old shapefile: So, we can use … Continue reading Diagrams for features

Quick Guide to Getting Started with PyQGIS 3 on Windows

Getting started with Python and QGIS 3 can be a bit overwhelming. In this post we give you a quick start to get you up and running and maybe make your PyQGIS life a little easier.

There are likely many ways to setup a working PyQGIS development environment---this one works pretty well.

Contents

Requirements

  • OSGeo4W Advanced Install of QGIS
  • pip (for installing/managing Python packages)
  • pb_tool (cross-platform tool for compiling/deploying/distributing QGIS plugin)
  • A customized startup script to set the environment (pyqgis.cmd)
  • IDE (optional)
  • Emacs (just kidding)
  • Vim (just kidding)

We'll start with the installs.

Installing

Almost everything we need can be installed using the OSGeo4W installer available on the QGIS website.

OSGeo4W

From the QGIS website, download the appropriate network installer (32 or 64 bit) for QGIS 3.

  • Run the installer and choose the Advanced Install option
  • Install from Internet
  • Choose a directory for the install---I prefer a path without spaces such as C:\OSGeo4W
  • Accept default for local package directory and Start menu name
  • Tweak network connection option if needed on the Select Your Internet Connection screen
  • Accept default download site location
  • From the Select packages screen, select: Desktop -> qgis: QGIS Desktop

When you click Next a bunch of additional packages will be suggested---just accept them and continue the install.

Once complete you will have a functioning QGIS install along with the other parts we need. If you want to work with the nightly build of QGIS, choose Desktop -> qgis-dev instead.

If you installed QGIS using the standalone installer, the easiest option is to remove it and install from OSGeo4W. You can run both the standalone and OSGeo4W versions on the same machine, but you need to be extra careful not to mix up the environment.

Setting the Environment

To continue with the setup, we need to set the environment by creating a .cmd script. The following is adapted from several sources, and trimmed down to the minimum. Copy and paste it into a file named pyqgis.cmd and save it to a convenient location (like your HOME directory).

@echo off
SET OSGEO4W_ROOT=C:\OSGeo4W3
call "%OSGEO4W_ROOT%"\bin\o4w_env.bat
call "%OSGEO4W_ROOT%"\apps\grass\grass-7.4.0\etc\env.bat
@echo off
path %PATH%;%OSGEO4W_ROOT%\apps\qgis-dev\bin
path %PATH%;%OSGEO4W_ROOT%\apps\grass\grass-7.4.0\lib
path %PATH%;C:\OSGeo4W3\apps\Qt5\bin
path %PATH%;C:\OSGeo4W3\apps\Python36\Scripts

set PYTHONPATH=%PYTHONPATH%;%OSGEO4W_ROOT%\apps\qgis-dev\python
set PYTHONHOME=%OSGEO4W_ROOT%\apps\Python36

set PATH=C:\Program Files\Git\bin;%PATH%

cmd.exe

You should customize the set PATH statement to add any paths you want available when working from the command line. I added paths to my git install.

The last line starts a cmd shell with the settings specified above it. We'll see an example of starting an IDE in a bit.

You can test to make sure all is well by double-clicking on our pyqgis.cmd script, then starting Python and attempting to import one of the QGIS modules:

C:\Users\gsherman>python3
Python 3.6.0 (v3.6.0:41df79263a11, Dec 23 2016, 07:18:10) [MSC v.1900 32 bit (In tel)] on win32
Type "help", "copyright", "credits" or "license" for more information.
>>> import qgis.core
>>> import PyQt5.QtCore

If you don't get any complaints on import, things are looking good.

Installing pb_tool

Open your customized shell (double-click on pyqgis.cmd to start it) to install pb_tool:

python3 -m pip install pb_tool

Check to see if pb_tool is installed correctly:

C:\Users\gsherman>pb_tool
Usage: pb_tool [OPTIONS] COMMAND [ARGS]...

  Simple Python tool to compile and deploy a QGIS plugin. For help on a
  command use --help after the command: pb_tool deploy --help.

  pb_tool requires a configuration file (default: pb_tool.cfg) that declares
  the files and resources used in your plugin. Plugin Builder 2.6.0 creates
  a config file when you generate a new plugin template.

  See http://g-sherman.github.io/plugin_build_tool for for an example config
  file. You can also use the create command to generate a best-guess config
  file for an existing project, then tweak as needed.

  Bugs and enhancement requests, see:
  https://github.com/g-sherman/plugin_build_tool

Options:
  --help  Show this message and exit.

Commands:
  clean       Remove compiled resource and ui files
  clean_docs  Remove the built HTML help files from the...
  compile     Compile the resource and ui files
  config      Create a config file based on source files in...
  create      Create a new plugin in the current directory...
  dclean      Remove the deployed plugin from the...
  deploy      Deploy the plugin to QGIS plugin directory...
  doc         Build HTML version of the help files using...
  help        Open the pb_tools web page in your default...
  list        List the contents of the configuration file
  translate   Build translations using lrelease.
  update      Check for update to pb_tool
  validate    Check the pb_tool.cfg file for mandatory...
  version     Return the version of pb_tool and exit
  zip         Package the plugin into a zip file suitable...

If you get an error, make sure C:\OSGeo4W3\apps\Python36\Scripts is in your PATH.

More information on using pb_tool is available on the project website.

Working on the Command Line

Just double-click on your pyqgis.cmd script from the Explorer or a desktop shortcut to start a cmd shell. From here you can use Python interactively and also use pb_tool to compile and deploy your plugin for testing.

IDE Example

By adding one line to our pyqgis.cmd script, we can start our IDE with the proper settings to recognize the QGIS libraries:

start "PyCharm aware of Quantum GIS" /B "C:\Program Files (x86)\JetBrains\PyCharm 3.4.1\bin\pycharm.exe" %*

We added the start statement with the path to the IDE (in this case PyCharm). If you save this to something like pycharm.cmd, you can double-click on it to start PyCharm. The same method works for other IDEs, such as PyDev.

Within your IDE settings, point it to use the Python interpreter included with OSGeo4W---typically at: %OSGEO4W_ROOT%\bin\python3.exe. This will make it pick up all the QGIS goodies needed for development, completion, and debugging. In my case OSGEO4W_ROOT is C:\OSGeo4W3, so in the IDE, the path to the correct Python interpreter would be: C:\OSGeo4W3\bin\python3.exe.

Make sure you adjust the paths in your .cmd scripts to match your system and software locations.

Workflow

Here is an example of a workflow you can use once you're setup for development.

Creating a New Plugin

  1. Use the Plugin Builder plugin to create a starting point [1]
  2. Start your pyqgis.cmd shell
  3. Use pb_tool to compile and deploy the plugin (pb_tool deploy will do it all in one pass)
  4. Activate it in QGIS and test it out
  5. Add code, deploy, test, repeat

Working with Existing Plugin Code

The steps are basically the same was creating a new plugin, except we start by using pb_tool to create a new config file:

  1. Start your pyqgis.cmd shell
  2. Change to the directory containing your plugin code
  3. Use pb_tool create to create a config file
  4. Edit pb_tool.cfg to adjust/add things create may have missed
  5. Start at step 3 in Creating a New Plugin and press on

Troubleshooting

Assuming you have things properly installed, trouble usually stems from an incorrect environment.

  • Make sure QGIS runs and the Python console is available and working
  • Check all the paths in your pygis.cmd or your custom IDE cmd script
  • Make sure your IDE is using the Python interpreter that comes with OSGeo4W


[1] Plugin Builder 3.x generates a pb_tool config file

TimeManager 2.5 published

TimeManager 2.5 is quite likely going to be the final TimeManager release for the QGIS 2 series. It comes with a couple of bug fixes and enhancements:

  • Fixed #245: updated help.htm
  • Fixed #240: now hiding unmanageable WFS layers
  • Fixed #220: fixed issues with label size
  • Fixed #194: now exposing additional functions: animation_time_frame_size, animation_time_frame_type, animation_start_datetime, animation_end_datetime

Besides updating the help, I also decided to display it more prominently in the settings dialog (similarly to how the help is displayed in the field calculator or in Processing):

So far, I haven’t started porting to QGIS 3 yet. If you are interested in TimeManager and want to help, please get in touch.

On this note, let me leave you with a couple of animation inspirations from the Twitterverse:

Crowdfunding: More QGIS 3D

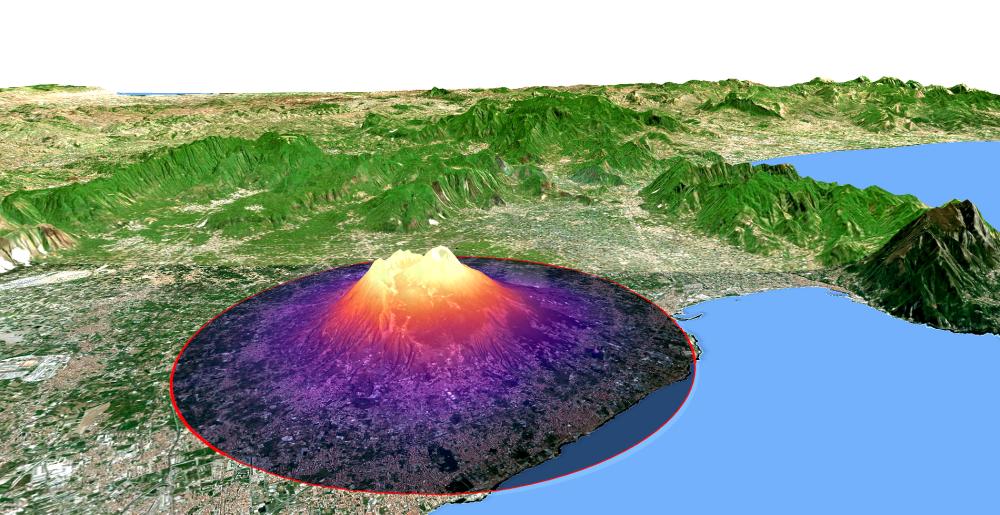
We are excited to launch a new crowdfunding campaign to bring lots of new features to QGIS 3D!

QGIS 3D

Here is a brief summary of what to expect if the campaign will be successful:

  • Print layout support
  • Camera animation support
  • Better camera control
  • Rule-based 3D rendering
  • Earth as a globe
  • Global terrain coverage
  • Skybox
  • Map themes for terrain
  • Configuration of lights
  • Loading map tiles in parallel

The target amount is 12,500 € and the campaign will be active until 16 March 2018.

Please have a look at the dedicated page More QGIS 3D for further details and help us spread the word!

You may also like...

Mergin Maps, a field data collection app based on QGIS. Mergin Maps makes field work easy with its simple interface and cloud-based sync. Available on Android, iOS and Windows. Screenshots of the Mergin Maps mobile app for Field Data Collection
Get it on Google Play Get it on Apple store

GRASS GIS 7.4.0 released

We are pleased to announce the GRASS GIS 7.4.0 release

GRASS GIS 7.4.0: Wildfire in Australia, seen by Sentinel-2B

What’s new in a nutshell

After a bit more than one year of development the new update release GRASS GIS 7.4.0 is available. It provides more than 480 stability fixes and improvements compared to the previous stable version 7.2. An overview of the new features in the 7.4 release series is available at New Features in GRASS GIS 7.4.

Efforts have concentrated on making the user experience even better, providing many small, but useful additional functionalities to modules and further improving the graphical user interface. Users can now directly download pre-packaged demo data locations in the GUI startup window. Several modules were migrated from addons to the core GRASS GIS package and the suite of tools for ortho-rectification was re-implemented in the new GRASS 7 GUI style. In order to support the treatment of massive datasets, new compression algorithms were introduced and NULL (no-data) raster files are now also compressed by default. For a detailed overview, see the list of new features. As a stable release series, 7.4.x enjoys long-term support.

Binaries/Installer download:

Source code download:

More details:

See also our detailed announcement:

About GRASS GIS

The Geographic Resources Analysis Support System (https://grass.osgeo.org/), commonly referred to as GRASS GIS, is an Open Source Geographic Information System providing powerful raster, vector and geospatial processing capabilities in a single integrated software suite. GRASS GIS includes tools for spatial modeling, visualization of raster and vector data, management and analysis of geospatial data, and the processing of satellite and aerial imagery. It also provides the capability to produce sophisticated presentation graphics and hardcopy maps. GRASS GIS has been translated into about twenty languages and supports a huge array of data formats. It can be used either as a stand-alone application or as backend for other software packages such as QGIS and R geostatistics. It is distributed freely under the terms of the GNU General Public License (GPL). GRASS GIS is a founding member of the Open Source Geospatial Foundation (OSGeo).

The GRASS Development Team, Feb 2018

The post GRASS GIS 7.4.0 released appeared first on GFOSS Blog | GRASS GIS and OSGeo News.

Porting Processing scripts to QGIS3

I’ll start with some tech talk first. Feel free to jump to the usage example further down if you are here for the edge bundling plugin.

As you certainly know, QGIS 3 brings a lot of improvements and under-the-hood changes. One of those changes affects all Python scripts. They need to be updated to Python 3 and the new PyQGIS API. (See the official migration guide for details.)

To get ready for the big 3.0 release, I’ve started porting my Processing tools. The edge bundling script is my first candidate for porting to QGIS 3. I also wanted to use this opportunity to “upgrade” from a simple script to a plugin that integrates into Processing.

I used Alexander Bruy’s “prepair for Processing” plugin as a template but you can also find an example template in your Processing folder. (On my system, it is located in C:\OSGeo4W64\apps\qgis-dev\python\plugins\processing\algs\exampleprovider.)

Since I didn’t want to miss the advantages of a good IDE, I set up PyCharm as described by Heikki Vesanto. This will give you code completion for Python 3 and PyQGIS which is very helpful for refactoring and porting. (I also tried Eclipse with PyDev but if you don’t have a favorite IDE yet, I find PyCharm easier to install and configure.)

My PyCharm startup script qgis3_pycharm.bat is a copy of C:\OSGeo4W64\bin\python-qgis-dev.bat with the last line altered to start PyCharm:

@echo off
call "%~dp0\o4w_env.bat"
call qt5_env.bat
call py3_env.bat
@echo off<span data-mce-type="bookmark" style="display: inline-block; width: 0px; overflow: hidden; line-height: 0;" class="mce_SELRES_start"></span>
path %OSGEO4W_ROOT%\apps\qgis-dev\bin;%PATH%
set QGIS_PREFIX_PATH=%OSGEO4W_ROOT:\=/%/apps/qgis-dev
set GDAL_FILENAME_IS_UTF8=YES
rem Set VSI cache to be used as buffer, see #6448
set VSI_CACHE=TRUE
set VSI_CACHE_SIZE=1000000
set QT_PLUGIN_PATH=%OSGEO4W_ROOT%\apps\qgis-dev\qtplugins;%OSGEO4W_ROOT%\apps\qt5\plugins
set PYTHONPATH=%OSGEO4W_ROOT%\apps\qgis-dev\python;%PYTHONPATH%
start /d "C:\Program Files\JetBrains\PyCharm\bin\" pycharm64.exe

In PyCharm File | Settings, I configured the OSGeo4W Python 3.6 interpreter and added qgis-dev and the plugin folder to its path:

With this setup done, we can go back to the code.

I first resolved all occurrences of import * in my script to follow good coding practices. For example:

from qgis.core import *

became

from qgis.core import QgsFeature, QgsPoint, QgsVector, QgsGeometry, QgsField, QGis<span data-mce-type="bookmark" style="display: inline-block; width: 0px; overflow: hidden; line-height: 0;" class="mce_SELRES_start"></span>

in this PR.

I didn’t even run the 2to3 script that is provided to make porting from Python 2 to Python 3 easier. Since the edge bundling code is mostly Numpy, there were almost no changes necessary. The only head scratching moment was when Numpy refused to add a map() return value to an array. So (with the help of Stackoverflow of course) I added a work around to convert the map() return value to an array as well:

flocal_x = map(forcecalcx, subtr_x, subtr_y, distance)
electrostaticforces_x[e_idx, :] += np.array(list(flocal_x))

The biggest change related to Processing is that the VectorWriter has been replaced by a QgsFeatureSink. It’s defined as a parameter of the edgebundling QgsProcessingAlgorithm:

self.addParameter(QgsProcessingParameterFeatureSink(
   self.OUTPUT,
   self.tr("Bundled edges"),
   QgsProcessing.TypeVectorLine)
)

And when the algorithm is run, the sink is filled with the output features:

(sink, dest_id) = self.parameterAsSink(
   parameters, self.OUTPUT, context,
   source.fields(), source.wkbType(), source.sourceCrs()
)

# code that creates features

sink.addFeature(feat, QgsFeatureSink.FastInsert)

The ported plugin is available on Github.

The edge bundling plugin in action

I haven’t uploaded the plugin to the official plugin repository yet, but you can already download if from Github and give it a try:

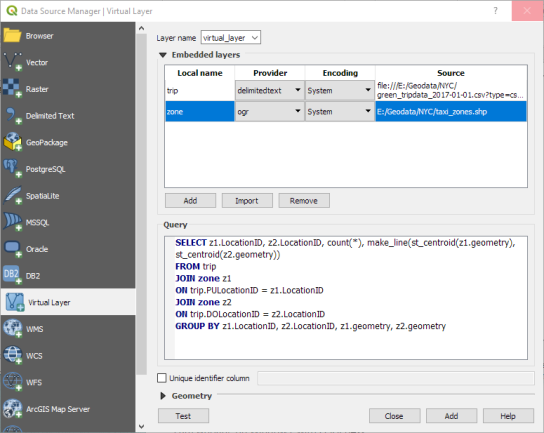
For this example, I’m using taxi pick-up and drop-off data provided by the NYC Taxi & Limousine Commission. I downloaded the January 2017 green taxi data and extracted all trips for the 1st of January. Then I created origin-destination (OD) lines using the QGIS virtual layer feature:

To get an interesting subset of the data, I extracted only those OD flows that cross the East River and have a count of at least 5 taxis:

Now the data is ready for bundling.

If you have installed the edge bundling plugin, the force-directed edge bundling algorithm should be available in the Processing toolbox. The UI of the edge bundling algorithm looks pretty much the same as it did for the QGIS 2 Processing script:

Since this is a small dataset with only 148 OD flows, the edge bundling processes is pretty quick and we can explore the results:

Beyond this core edge bundling algorithm, the repository also contains two more scripts that still need to be ported. They include dependencies on sklearn, so it will be interesting to see how straightforward it is to convert them.

Exploring Reports in QGIS 3.0 – the Ultimate Guide!

In 2017 North Road ran a crowd funding campaign for extending QGIS’ Print Composer and adding a brand new reporting framework to QGIS. Thanks to numerous generous backers, this campaign was a success. With the final QGIS 3.0 release just around the corner, we thought this was a great time to explore the new reporting engine and what it offers.

We’ll start with a relatively simple project, containing some administrative boundaries, populated places, ports and airports.

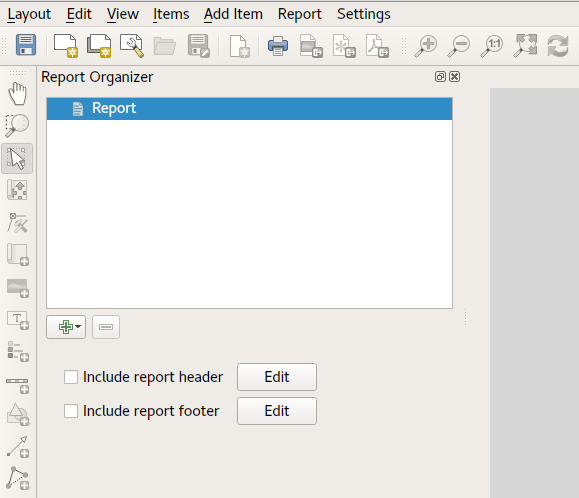
Using the “Project” – “New Report” command, we then create a new blank report. Initially, there’s not much to look at – the dialog which is displayed looks much like the QGIS 3.0 Layout Designer, except for the new “Report Organizer” panel shown on the left:

QGIS reports can consist of multiple, nested sections. In our new blank report we initially have only the main report section. The only options present for this report section is to include an optional header and footer for the report. If we enable these, the header will be included as the very first page (or pages… individual parts of reports can be multi-page if desired) in the report, and the footer would be the last page. Let’s go ahead and enable the header, and hit the “Edit” button next to it:

A few things happen as a result. Firstly, an edit pencil is now shown next to the “Report” section in the Report Organizer, indicating that the report section is currently being edited in the designer. We also see a new blank page shown in the designer itself, with the small “Report Header” title. In QGIS reports, every component of the report is made up of individual layouts. They can be created and modified using the exact same tools as are available for standard print layouts – so you can use any desired combination of labels, pictures, maps, tables, etc. Let’s add some items to our report header to demonstrate:

We’ll also create a simple footer for the report, by checking the “Include report footer” option and hitting “Edit“.

Before proceeding further, let’s export this report and see what we get. Exporting is done from the Report menu – in this case we select “Export Report as PDF” to render the whole report to a PDF file. Here’s the not-very-impressive result – a two page PDF consisting of our header and footer:

Let’s make things more interesting. By hitting the green “+” button in the Report Organizer, we’re given a choice of new sections to add to our report.

Currently there’s two options – a “Single section” and a “Field group“. Expect this list to grow in future QGIS releases, but for now we’ll add a Field Group to our report. At its most basic level, you can think of a Field Group as the equivalent of a print atlas. You select a layer to iterate over, and the report will insert a section for each feature found. Selecting the new Field Group section reveals a number of new related settings:

In this case we’ve setup our Field Group so that we iterate over all the states from the “Admin Level 1” layer, using the values from the “adm1name” field. The same options for header and footer are present, together with a new option to include a “body” for this section. We’ll do that, and edit the body:

We’ve setup this body with a map (set to follow the current report feature – just like how a map item in an atlas can follow the current atlas feature), and a label showing the state’s name. If we went ahead and exported our report now, we’d get something like this:

First, the report header, than a page for each state, and finally the report footer. So more or less an atlas, but with a header and footer page. Let’s make things more interesting by adding a subsection to our state group. We do this by first selecting the state field group in the organizer, then hitting the + button and adding a new Field Group:

When a field group is iterating over its features, it will automatically filter these features to match the feature attributes from its parent groups. In this case, the subsection we added will iterate over a “Populated Places” layer, including a body section for each place encountered. The magic here is that the Populated Places layer has an attribute named “adm1name“, tagging each place with the state it’s contained within (if you’re lucky your data will already be structured like this – if not, run the Processing “Join by Location” algorithm and create your own field). When we export this report, QGIS will grab the first state from the Admin Level 1 layer, and then iterate over all the Populated Places with a matching “adm1name” value. Here’s what we get:

(Here we created a basic body for the Populated Places group, including a map of the place and a table of some place attributes). So our report is now a report header, a page for each state followed by a page for every populated place within that state, and finally the report footer. If we were to add a header for the Populated Places group, it would be included just before listing the populated places for each state:

Similarly, a footer for the Populated Places group would be inserted after the final place for each state is included.

In addition to nested subsections, subsections in a report can also be included consecutively. If we add a second subsection to the Admin Level 1 group for Airports, then our report will first list ALL the populated places for each state, followed by all the airports within that state, before proceeding to the next state. In this case our report would be structured like this:

(The key point here is that our Airports group is a subsection of the Admin Level 1 group – not the Populated Places group). Here’s what our report could look like now:

Combining nested and consecutive sections, together with section headers and footers allows for tons of flexibility. For instance, in the below report we add another field group as a child of the main report for the Ports layer. Now, after listing the states together with their populated places and airports, we’ll get a summary list of all the ports in the region:

This results in the last part of our report exporting as:

As you can start to imagine, reports in QGIS are extremely powerful and flexible! We’re extremely thankful for all the backers of our crowd funding campaign, without whom this work would not have been possible.

Stay tuned for more reporting and layouts work we have planned for QGIS 3.2!


(Nederlands) Programma gebruikersmiddag compleet!

Sorry, this entry is only available in the Dutch language

  • <<
  • Page 49 of 141 ( 2819 posts )
  • >>

Back to Top

Sustaining Members