Related Plugins and Tags

QGIS Planet

Leaflet Day 7 - Coordinates

In this post, we’ll do a couple of things: Clean up the display of coordinate precision in our popups Add the current coordinates to the map as the mouse moves Coordinate Precision Display The current map displays the latitude and longitude with seven decimal places. This is more than we need to see when displaying information about locations: Fixing this is easy to do using the JavaScript function toFixed.

Leaflet Day 5 - Working with Features

Today we’ll add towns along the trail route that are mentioned in the novels. I hesitate to call them towns, because in 1902, many of them consisted of a view indigenous people and sometimes a roadhouse. The method to add these locations will be to add a GeoJSON layer and loop through each town, adding a marker and popup with some info. The Data The data for the locations is from the GNIS database for Alaska, containing over 35,000 locations.

Leaflet Day 9 - Calculating Distance with Turf.js

Today we’re going to use Turf.js to calculate the distance between any two points along the trail. Turf.js is billed as providing “Advanced geospatial analysis for browsers and Node.js.” The distance calculated is a straight line (“as the crow flies”) distance rather than actual trail miles. Including Turf.js To calculate the distance we need to include Turf.js. Rather than install it locally, just add this line to the head of your HTML:

Leaflet Day 3 - The Trail

Background In 1902 the only way from the port of Valdez to the Fortymile gold fields was a nearly 400 mile trail through the Alaska wilderness. The Valdez-Eagle trail plays a key role in novels two and three. Adding the Trail to a Leaflet Map To add the trail to our map, we will convert it from a shapefile to GeoJSON. There is more than one way to do this—you could use ogr2ogr, but we chose to use QGIS, since it would not only convert it, but transform the coordinate system at the same time.

Leaflet Day 4 - Basemaps and Overlays

Today we’ll add some basemaps and a couple of controls to our map. So far we’ve been using OpenStreetMap as our back drop. There are a couple of tile servers that will give us a little more of a “back in the day” look. We’ll also add attribution to the map so we give credit where credit is due, as well as a scale bar. Complete code for the map can be viewed at the bottom of this post.

Leaflet Day 2 - Adding a Marker

I’m starting off slow, so today we’ll add a marker with some extra features. Since the map from yesterday is already centered on the big earthquake, lets add a marker there. Adding a Marker To create a marker, Leaflet uses the L.marker class: var earthquakeMarker = L.marker([61.346, -149.955]); This creates the marker, but it needs to be added to the map: earthquakeMarker.addTo(map); This gives us: Good so far, but looking at the map tells us nothing about the marker.

Leaflet Day 8 - Zoom to Feature

In this post we’ll add a zoom button to pan the map to one of the towns in the trail stops layer. Adding a Dropdown Box and Button The first thing to do is add the select element and a button to the HTML: <select id='zoombox'> </select> <input type="button" id="zoomTo" value="Zoom to town"> We’ll populate the options for the select element using the town GeoJSON. Creating a Dictionary and Populating the Select Box Next we loop through the towns in the GeoJSON layer and create a dictionary that maps the town name to its data, then add each as an option to a select element:

Leaflet Day 6 - GeoPackage Layers

In this post we’ll switch gears and install Leaflet locally, then add a layer from a GeoPackage file. Installing Leaflet Up until now we’ve been using a hosted version of Leaflet. In other words, each time we load the map, a request is made to fetch the Leaflet CSS and JavaScript. There are a couple of ways to install Leaflet: download it from the website or install with npm. In both cases you’ll need to move leaflet.

Happy birthday OSGeo!

On February 4, 2006 OSGeo held its first meeting in Chicago, with 25 participants representing 18 groups and over 20 different Open Source GIS projects, and 39 others participating via Internet Relay Chat. During the meeting, participants made important decisions in the formation and organization of the foundation, including the name, structure and purpose. The consensus reached in Chicago opened the way for the establishment of a productive and representative foundation.

Today we are happy to announce that the we have meanwhile over 32,800 unique subscribers in the huge list of over 290 OSGeo mailing lists!

And: check out the web site of the OSGeo foundation.

1. More to come this year!

… see here for the growing list of events

The post Happy birthday OSGeo! appeared first on GFOSS Blog | GRASS GIS and OSGeo News.

Announcing our SLYR (MXD to QGIS) funding drive!

One product which North Road had the chance to develop last year, and which we are super-proud of, is our SLYR ESRI style to QGIS conversion tool. If you haven’t heard of it before, this tool allows automatic conversion of ESRI .style database files to their equivalent QGIS symbology equivalent. It works well for the most part, and now we’re keen to take this to the next stage.

The good news is that North Road have been conducting extensive research and development over the past 12 months, and we’re pleased to announce our plans for extending SLYR to support ESRI LYR and MXD documents. The LYR and MXD formats are proprietary ESRI-only formats, with no public specifications allowing their use. This is a huge issue for organisations who want to move from an ESRI environment to the open geospatial world, yet are held back by hundreds (or thousands!) of existing ESRI MXD map documents and layer styles which they currently cannot utilise outside of the ESRI software ecosystem. Furthermore, many providers of spatial data only include ESRI specific layer formatting files with their data supplies. This leaves users with no means of utilising these official, pre-defined styles in non-ESRI tools.

In order for us to continue development of the SLYR tool and unlock use of LYR and MXD formats outside of ESRI tools, we are conducting a funding campaign. Sponsors of the campaign will receive access to the tools as they are developed and gain access to official support channels covering their use. At the conclusion of this drive we’ll be releasing all the tools and specifications under a free, open-source license.

You can read the full details of the campaign here, including pricing to become a project sponsor and gain access to the tools as they develop. As a campaign launch promo, we’re offering the first 10 sponsors a super-special discounted rate (as a reward for jumping on the development early).

The mockup below shows what the end goal is: seamless, fully integrated, automatic conversion of MXD and LYR files directly within the QGIS desktop application!

Movement data in GIS #20: Trajectools v1 released!

In previous posts, I already wrote about Trajectools and some of the functionality it provides to QGIS Processing including:

There are also tools to compute heading and speed which I only talked about on Twitter.

Trajectools is now available from the QGIS plugin repository.

The plugin includes sample data from MarineCadastre downloads and the Geolife project.

Under the hood, Trajectools depends on GeoPandas!

If you are on Windows, here’s how to install GeoPandas for OSGeo4W:

  1. OSGeo4W installer: install python3-pip
  2. Environment variables: add GDAL_VERSION = 2.3.2 (or whichever version your OSGeo4W installation currently includes)
  3. OSGeo4W shell: call C:\OSGeo4W64\bin\py3_env.bat
  4. OSGeo4W shell: pip3 install geopandas (this will error at fiona)
  5. From https://www.lfd.uci.edu/~gohlke/pythonlibs/#fiona: download Fiona-1.7.13-cp37-cp37m-win_amd64.whl
  6. OSGeo4W shell: pip3 install path-to-download\Fiona-1.7.13-cp37-cp37m-win_amd64.whl
  7. OSGeo4W shell: pip3 install geopandas
  8. (optionally) From https://www.lfd.uci.edu/~gohlke/pythonlibs/#rtree: download Rtree-0.8.3-cp37-cp37m-win_amd64.whl and pip3 install it

If you want to use this functionality outside of QGIS, head over to my movingpandas project!

Call for testing: GRASS GIS with Python 3

Please help us testing the Python3 support in the yet unreleased GRASS GIS trunk (i.e., version “grass77” which will be released as “grass78” in the near future).

1. Why Python 3?

Python 2 is end-of-life (EOL); the current Python 2.7 will retire in 11 months from today (see https://pythonclock.org). We want to follow the “Moving to require Python 3” and complete the change to Python 3. And we need a broader community testing.

2. Download and test!

Packages are available at time:

3. Instructions for testing

4. Problems found? Please report them to us

Problems and bugs can be reported in the GRASS GIS trac. Code changes are welcome!

Thanks for testing grass77!

The post Call for testing: GRASS GIS with Python 3 appeared first on GFOSS Blog | GRASS GIS and OSGeo News.

Dealing with delayed measurements in (Geo)Pandas

Yesterday, I learned about a cool use case in data-driven agriculture that requires dealing with delayed measurements. As Bert mentions, for example, potatoes end up in the machines and are counted a few seconds after they’re actually taken out of the ground:

Therefore, in order to accurately map yield, we need to take this temporal offset into account.

We need to make sure that time and location stay untouched, but need to shift the potato count value. To support this use case, I’ve implemented apply_offset_seconds() for trajectories in movingpandas:

    def apply_offset_seconds(self, column, offset):
        self.df[column] = self.df[column].shift(offset, freq='1s')

The following test illustrates its use: you can see how the value column is shifted by 120 second. Geometry and time remain unchanged but the value column is shifted accordingly. In this test, we look at the row with index 2 which we access using iloc[2]:

    def test_offset_seconds(self):
        df = pd.DataFrame([
            {'geometry': Point(0, 0), 't': datetime(2018, 1, 1, 12, 0, 0), 'value': 1},
            {'geometry': Point(-6, 10), 't': datetime(2018, 1, 1, 12, 1, 0), 'value': 2},
            {'geometry': Point(6, 6), 't': datetime(2018, 1, 1, 12, 2, 0), 'value': 3},
            {'geometry': Point(6, 12), 't': datetime(2018, 1, 1, 12, 3, 0), 'value':4},
            {'geometry': Point(6, 18), 't': datetime(2018, 1, 1, 12, 4, 0), 'value':5}
        ]).set_index('t')
        geo_df = GeoDataFrame(df, crs={'init': '31256'})
        traj = Trajectory(1, geo_df)
        traj.apply_offset_seconds('value', -120)
        self.assertEqual(traj.df.iloc[2].value, 5)
        self.assertEqual(traj.df.iloc[2].geometry, Point(6, 6))

Movement data in GIS #19: splitting trajectories by date

Many current movement data sources provide more or less continuous streams of object locations. For example, the AIS system provides continuous locations of vessels (mostly ships). This continuous stream of locations – let’s call it track – starts when we first record the vessel and ends with the last record. This start and end does not necessarily coincide with the start or end of a vessel voyage from one port to another. The stream start and end do not have any particular meaning. Instead, if we want to see what’s going on, we need to split the track into meaningful segments. One such segmentation – albeit a simple one – is to split tracks by day. This segmentation assumes that day/night changes affect the movement of our observed object. For many types of objects – those who mostly stay still during the night – this will work reasonably well.

For example, the following screenshot shows raw data of one particular vessel in the Boston region. By default, QGIS provides a Points to Path to convert points to lines. This tool takes one “group by” and one “order by” field. Therefore, if we want one trajectory per ship per day, we’d first have to create a new field that combines ship ID and day so that we can use this combination as a “group by” field. Additionally, the resulting lines loose all temporal information.

To simplify this workflow, Trajectools now provides a new algorithm that creates day trajectories and outputs LinestringM features. Using the Day trajectories from point layer tool, we can immediately see that our vessel of interest has been active for three consecutive days: entering our observation area on Nov 5th, moving to Boston where it stayed over night, then moving south to Weymouth on the next day, and leaving on the 7th.

Since the resulting trajectories are LinestringM features with time information stored in the M value, we can also visualize the speed of movement (as discussed in part #2 of this series):

Two Weeks of Leaflet - Day 1

Background We at Locate Press have been working on a new book: Leaflet Cookbook, by Numa Gremling. The book is chock-full of over 300 pages of recipes and information to get the most of your web maps. The book is content complete and available as a preview. I’ve dabbled in Leaflet in the past, but only scratched the surface. So, I’ve decided to spend two weeks starting from the ground up and create a decent web map.

From CSV to GeoDataFrame in two lines

Pandas is great for data munging and with the help of GeoPandas, these capabilities expand into the spatial realm.

With just two lines, it’s quick and easy to transform a plain headerless CSV file into a GeoDataFrame. (If your CSV is nice and already contains a header, you can skip the header=None and names=FILE_HEADER parameters.)

usecols=USE_COLS is also optional and allows us to specify that we only want to use a subset of the columns available in the CSV.

After the obligatory imports and setting of variables, all we need to do is read the CSV into a regular DataFrame and then construct a GeoDataFrame.

import pandas as pd
from geopandas import GeoDataFrame
from shapely.geometry import Point

FILE_NAME = "/temp/your.csv"
FILE_HEADER = ['a', 'b', 'c', 'd', 'e', 'x', 'y']
USE_COLS = ['a', 'x', 'y']

df = pd.read_csv(
    FILE_NAME, delimiter=";", header=None,
    names=FILE_HEADER, usecols=USE_COLS)
gdf = GeoDataFrame(
    df.drop(['x', 'y'], axis=1),
    crs={'init': 'epsg:4326'},
    geometry=[Point(xy) for xy in zip(df.x, df.y)])

It’s also possible to create the point objects using a lambda function as shown by weiji14 on GIS.SE.

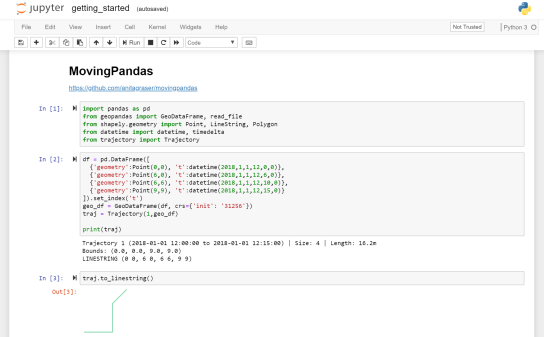
Movement data in GIS #21: new interactive notebook to get started with MovingPandas

MovingPandas is my attempt to provide a pure Python solution for trajectory data handling in GIS. MovingPandas provides trajectory classes and functions built on top of GeoPandas. 

To lower the entry barrier to getting started with MovingPandas, there’s now an interactive iPython notebook hosted on MyBinder. This notebook provides all the necessary imports and demonstrates how to create a Trajectory object.

Launch MyBinder for MovingPandas to get started!

Flow maps in QGIS – no plugins needed!

If you’ve been following my posts, you’ll no doubt have seen quite a few flow maps on this blog. This tutorial brings together many different elements to show you exactly how to create a flow map from scratch. It’s the result of a collaboration with Hans-Jörg Stark from Switzerland who collected the data.

The flow data

The data presented in this post stems from a survey conducted among public transport users, especially commuters (available online at: https://de.surveymonkey.com/r/57D33V6). Among other questions, the questionnair asks where the commuters start their journey and where they are heading.

The answers had to be cleaned up to correct for different spellings, spelling errors, and multiple locations in one field. This cleaning and the following geocoding step were implemented in Python. Afterwards, the flow information was aggregated to count the number of nominations of each connection between different places. Finally, these connections (edges that contain start id, destination id and number of nominations) were stored in a text file. In addition, the locations were stored in a second text file containing id, location name, and co-ordinates.

Why was this data collected?

Besides travel demand, Hans-Jörg’s survey also asks participants about their coffee consumption during train rides. Here’s how he tells the story behind the data:

As a nearly daily commuter I like to enjoy a hot coffee on my train rides. But what has bugged me for a long time is the fact the coffee or hot beverages in general are almost always served in a non-reusable, “one-use-only-and-then-throw-away” cup. So I ended up buying one of these mostly ugly and space-consuming reusable cups. Neither system seem to satisfy me as customer: the paper-cup produces a lot of waste, though it is convenient because I carry it only when I need it. With the re-usable cup I carry it all day even though most of the time it is empty and it is clumsy and consumes the limited space in bag.

So I have been looking for a system that gets rid of the disadvantages or rather provides the advantages of both approaches and I came up with the following idea: Installing a system that provides a re-usable cup that I only have with me when I need it.

In order to evaluate the potential for such a system – which would not only imply a material change of the cups in terms of hardware but also introduce some software solution with the convenience of getting back the necessary deposit that I pay as a customer and some software-solution in the back-end that handles all the cleaning, distribution to the different coffee-shops and managing a balanced stocking in the stations – I conducted a survey

The next step was the geographic visualization of the flow data and this is where QGIS comes into play.

The flow map

Survey data like the one described above is a common input for flow maps. There’s usually a point layer (here: “nodes”) that provides geographic information and a non-spatial layer (here: “edges”) that contains the information about the strength or weight of a flow between two specific nodes:
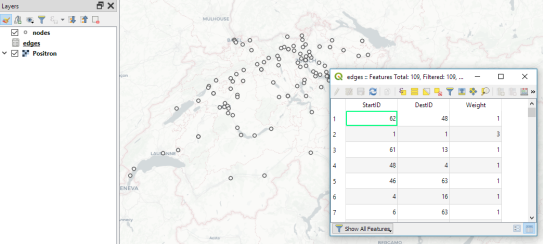
The first step therefore is to create the flow line features from the nodes and edges layers. To achieve our goal, we need to join both layers. Sounds like a job for SQL!

More specifically, this is a job for Virtual Layers: Layer | Add Layer | Add/Edit Virtual Layer

SELECT StartID, DestID, Weight, 
       make_line(a.geometry, b.geometry)
FROM edges
JOIN nodes a ON edges.StartID = a.ID
JOIN nodes b ON edges.DestID = b.ID
WHERE a.ID != b.ID 

This SQL query joins the geographic information from the nodes table to the flow weights in the edges table based on the node IDs. In the last line, there is a check that start and end node ID should be different in order to avoid zero-length lines.

By styling the resulting flow lines using data-driven line width and adding in some feature blending, it’s possible to create some half decent maps:
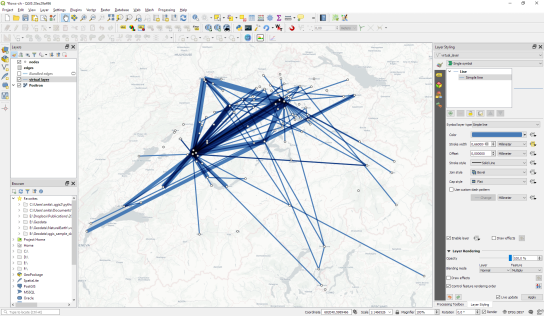
However, we can definitely do better. Let’s throw in some curved arrows!

The arrow symbol layer type automatically creates curved arrows if the underlying line feature has three nodes that are not aligned on a straight line.

Therefore, to turn our straight lines into curved arrows, we need to add a third point to the line feature and it has to have an offset. This can be achieved using a geometry generator and the offset_curve() function:

make_line(
   start_point($geometry),
   centroid(
      offset_curve(
         $geometry, 
         length($geometry)/-5.0
      )
   ),
   end_point($geometry)
)

Additionally, to achieve the effect described in New style: flow map arrows, we extend the geometry generator to crop the lines at the beginning and end:

difference(
   difference(
      make_line(
         start_point($geometry),
         centroid(
            offset_curve(
               $geometry, 
               length($geometry)/-5.0
            )
         ),
	 end_point($geometry)
      ),
      buffer(start_point($geometry), 0.01)
   ),
   buffer(end_point( $geometry), 0.01)
)

By applying data-driven arrow and arrow head sizes, we can transform the plain flow map above into a much more appealing map:
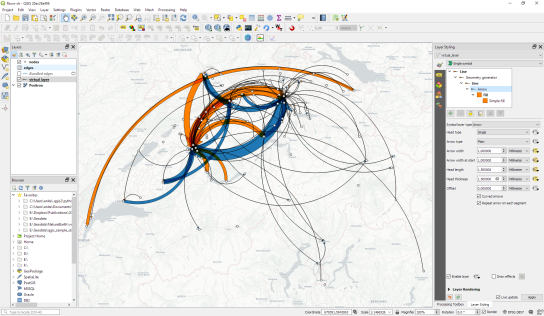
The two different arrow colors are another way to emphasize flow direction. In this case, orange arrows mark flows to the west, while blue flows point east.

CASE WHEN
 x(start_point($geometry)) - x(end_point($geometry)) < 0
THEN
 '#1f78b4'
ELSE
 '#ff7f00'
END

Conclusion

As you can see, virtual layers and geometry generators are a powerful combination. If you encounter performance problems with the virtual layer, it’s always possible to make it permanent by exporting it to a file. This will speed up any further visualization or analysis steps.

Movement data in GIS and the AI hype

This post looks into the current AI hype and how it relates to geoinformatics in general and movement data analysis in GIS in particular. This is not an exhaustive review but aims to highlight some of the development within these fields. There are a lot of references in this post, including some to previous work of mine, so you can dive deeper into this topic on your own.

I’m looking forward to reading your take on this topic in the comments!

Introduction to AI

The dream of artificial intelligence (AI) that can think like a human (or even outsmart one) reaches back to the 1950s (Fig. 1, Tandon 2016). Machine learning aims to enable AI. However, classic machine learning approaches that have been developed over the last decades (such as: decision trees, inductive logic programming, clustering, reinforcement learning, neural networks, and Bayesian networks) have failed to achieve the goal of a general AI that would rival humans. Indeed, even narrow AI (technology that can only perform specific tasks) was mostly out of reach (Copeland 2018).

However, recent increases in computing power (be it GPUs, TPUs or CPUs) and algorithmic advances, particularly those based on neural networks, have made this dream (or nightmare) come closer (Rao 2017) and are fueling the current AI hype. It should be noted that artificial neural networks (ANN) are not a new technology. In fact, they used to be not very popular because they require large amounts of input data and computational power. However, in 2012, Andrew Ng at Google managed to create large enough neural networks and train them with massive amounts of data, an approach now know as deep learning (Copeland 2018).

Fig. 1: The evolution of artificial intelligence, machine learning, and deep learning. (Image source: Tandon 2016)

Machine learning & GIS

GIScience or geoinformatics is not new to machine learning. The most well-known application is probably supervised image classification, as implemented in countless commercial and open tools. This approach requires labeled training and test data (Fig. 2) to learn a prediction model that can, for example, classify land cover in remote sensing imagery. Many classification algorithms have been introduced, ranging from maximum likelihood classification to clustering (Congedo 2016) and neural networks.

Fig. 2: With supervised machine learning, the algorithm learns from labeled data. (Image source: Salian 2018)

Like in other fields, neural networks have intrigued geographers and GIScientists for a long time. For example, Hewitson & Crane (1994) state that “Neural nets offer a fascinating new strategy for spatial analysis, and their application holds enormous potential for the geographic sciences.” Early uses of neural network in GIScience include, for example: spatial interaction modeling (Openshaw 1998) and hydrological modeling of rainfall runoff (Dawson & Wilby 2001). More recently, neural networks and deep learning have enabled object recognition in georeferenced images. Most prominently, the research team at Mapillary (2016-2019) works on object recognition in street-level imagery (including fusion with other spatial data sources). Even Generative adversarial networks (GANs) (Fig. 3) have found their application in GIScience: for example, Zhu et al. (2017) (at the Berkeley AI Research (BAIR) laboratory) demonstrate how GANs can generate road maps from aerial images and vice versa, and Zhu et al. (2019) generate artificial digital elevation models.

Fig. 3: In a GAN, the discriminator is shown images from both the generator and from the training dataset. The discriminator is tasked with determining which images are real, and which are fakes from the generator. (Image source: Salian 2018)

However, besides general excitement about new machine learning approaches, researchers working on spatial analysis (Openshaw & Turton 1996) caution that “conventional classifiers, as provided in statistical packages, completely ignore most of the challenges of spatial data classification and handle a few inappropriately from a geographical perspective”. For example, data transformation using principal component or factor scores is sensitive to non-normal data distribution common in geographic data and many methods ignore spatial autocorrelation completely (Openshaw & Turton 1996). And neural networks are no exception: Convolutional neural networks (CNNs) are generally regarded appropriate for any problem involving pixels or spatial representations. However, Liu et al. (2018) demonstrate that they fail even for the seemingly trivial coordinate transform problem, which requires learning a mapping between coordinates in (x, y) Cartesian space and coordinates in one-hot pixel space.

The integration of spatial data challenges into machine learning is an ongoing area of research, for example in geostatistics (Hengl & Heuvelink 2019).

Machine learning and movement data

More and more movement data of people, vehicles, goods, and animals is becoming available. Developments in intelligent transportation systems specifically have been sparked by the availability of cheap GPS receivers and many models have been built that leverage floating car data (FCD) to classify traffic situations (for example, using visual analysis (Graser et al. 2012)), predict traffic speeds (for example, using linear regression models (Graser et al. 2016)), or detect movement anomalies (for example, using Gaussian mixture models (Graser & Widhalm 2018)). Beyond transportation, Valletta et al. (2017) describe applications of machine learning in animal movement and behavior.

Of course deep learning is making its way into movement data analysis as well. For example, Wang et al. (2018) and Kudinov (2018) trained neural networks to predict travel times in a transport networks. In contrast to conventional travel time prediction models (based on street graphs with associated speeds or travel times), these are considerably more computationally intensive. Kudinov (2018) for example, used 300 million simulated trips (start and end location, start time, and trip duration) as input and “spent about eight months of running one of the GP100 cards 24-7 in a search for an efficient architecture, spatial and statistical distributions of the training set, good values for multiple hyperparameters”.  More recently, Zhang et al. (2019) (at Microsoft Research Asia) used deep learning to predict flows in spatio-temporal networks. It remains to be seen if deep learning will manage to out-perform classical machine learning approaches for predictions in the transportation sector.

What would a transportation AI look like? Would it be able to drive a car and follow data-driven route recommendations (e.g. from waze.com) or would it purposefully ignore them because other – more basic systems – blindly follow it? Logistics AI might build on these kind of systems while simultaneously optimizing large fleets of vehicles. Transport planning AI might replace transport planners by providing reliable mobility demand predictions as well as resulting traffic models for varying infrastructure and policy scenarios.

Conclusions

The opportunities for using ML in geoinformatics are extensive and have been continuously explored for a multitude of different research problems and applications (from land use classification to travel time prediction). Geoinformatics is largely playing catch-up with the quick development in machine learning (including deep learning) that promise new and previously unseen possibilities. At the same time, it is necessary that geoinformatics researchers are aware of the particularities of spatial data, for example, by developing models that take spatial autocorrelation into account. Future research in geoinformatics should incorporate learnings from geostatistics to ensure that resulting machine learning models incorporate the geographical perspective.

References

  • Congedo, L. (2016). Semi-Automatic Classification Plugin Documentation. DOI: http://dx.doi.org/10.13140/RG.2.2.29474.02242/1
  • Copeland, M. (2016) What’s the Difference Between Artificial Intelligence, Machine Learning, and Deep Learning? https://blogs.nvidia.com/blog/2016/07/29/whats-difference-artificial-intelligence-machine-learning-deep-learning-ai/
  • Dawson, C. W., & Wilby, R. L. (2001). Hydrological modelling using artificial neural networks. Progress in physical Geography, 25(1), 80-108.
  • Graser, A., Ponweiser, W., Dragaschnig, M., Brandle, N., & Widhalm, P. (2012). Assessing traffic performance using position density of sparse FCD. In Intelligent Transportation Systems (ITSC), 2012 15th International IEEE Conference on (pp. 1001-1005). IEEE.
  • Graser, A., Leodolter, M., Koller, H., & Brändle, N. (2016) Improving vehicle speed estimates using street network centrality. International Journal of Cartography. doi:10.1080/23729333.2016.1189298.
  • Graser, A., & Widhalm, P. (2018). Modelling Massive AIS Streams with Quad Trees and Gaussian Mixtures. In: Mansourian, A., Pilesjö, P., Harrie, L., & von Lammeren, R. (Eds.), 2018. Geospatial Technologies for All : short papers, posters and poster abstracts of the 21th AGILE Conference on Geographic Information Science. Lund University 12-15 June 2018, Lund, Sweden. ISBN 978-3-319-78208-9. Accessible through https://agile-online.org/index.php/conference/proceedings/proceedings-2018
  • Hengl, T. Heuvelink, G.B.M. (2019) Workshop on Machine learning as a framework for predictive soil mapping https://www.cvent.com/events/pedometrics-2019/custom-116-81b34052775a43fcb6616a3f6740accd.aspx?dvce=1
  • Hewitson, B., Crane, R. G. (Eds.) (1994) Neural Nets: Applications in Geography. Springer.
  • Kudinov, D. (2018) Predicting travel times with artificial neural network and historical routes. https://community.esri.com/community/gis/applications/arcgis-pro/blog/2018/03/27/predicting-travel-times-with-artificial-neural-network-and-historical-routes
  • Liu, R., Lehman, J., Molino, P., Such, F. P., Frank, E., Sergeev, A., & Yosinski, J. (2018). An intriguing failing of convolutional neural networks and the coordconv solution. In Advances in Neural Information Processing Systems (pp. 9605-9616).
  • Mapillary Research (2016-2019) publications listed on https://research.mapillary.com/
  • Openshaw, S., & Turton, I. (1996). A parallel Kohonen algorithm for the classification of large spatial datasets. Computers & Geosciences, 22(9), 1019-1026.
  • Openshaw, S. (1998). Neural network, genetic, and fuzzy logic models of spatial interaction. Environment and Planning A, 30(10), 1857-1872.
  • Rao, R. C.S. (2017) New Product breakthroughs with recent advances in deep learning and future business opportunities. https://mse238blog.stanford.edu/2017/07/ramdev10/new-product-breakthroughs-with-recent-advances-in-deep-learning-and-future-business-opportunities/
  • Salian, I. (2018) SuperVize Me: What’s the Difference Between Supervised, Unsupervised, Semi-Supervised and Reinforcement Learning? https://blogs.nvidia.com/blog/2018/08/02/supervised-unsupervised-learning/
  • Tandon, K. (2016) AI & Machine Learning: The evolution, differences and connections https://www.linkedin.com/pulse/ai-machine-learning-evolution-differences-connections-kapil-tandon/
  • Valletta, J. J., Torney, C., Kings, M., Thornton, A., & Madden, J. (2017). Applications of machine learning in animal behaviour studies. Animal Behaviour, 124, 203-220.
  • Wang, D., Zhang, J., Cao, W., Li, J., & Zheng, Y. (2018). When will you arrive? estimating travel time based on deep neural networks. In Thirty-Second AAAI Conference on Artificial Intelligence.
  • Zhang, J., Zheng, Y., Sun, J., & Qi, D. (2019). Flow Prediction in Spatio-Temporal Networks Based on Multitask Deep Learning. IEEE Transactions on Knowledge and Data Engineering.
  • Zhu, J. Y., Park, T., Isola, P., & Efros, A. A. (2017). Unpaired image-to-image translation using cycle-consistent adversarial networks. In Proceedings of the IEEE international conference on computer vision (pp. 2223-2232).
  • Zhu, D., Cheng, X., Zhang, F., Yao, X., Gao, Y., & Liu, Y. (2019). Spatial interpolation using conditional generative adversarial neural networks. International Journal of Geographical Information Science, 1-24.

This post is part of a series. Read more about movement data in GIS.

  • <<
  • Page 35 of 141 ( 2819 posts )
  • >>

Back to Top

Sustaining Members