Related Plugins and Tags

QGIS Planet

Drive-time Isochrones from a single Shapefile using QGIS, PostGIS, and Pgrouting

This is a guest post by Chris Kohler .

Introduction:

This guide provides step-by-step instructions to produce drive-time isochrones using a single vector shapefile. The method described here involves building a routing network using a single vector shapefile of your roads data within a Virtual Box. Furthermore, the network is built by creating start and end nodes (source and target nodes) on each road segment. We will use Postgresql, with PostGIS and Pgrouting extensions, as our database. Please consider this type of routing to be fair, regarding accuracy, as the routing algorithms are based off the nodes locations and not specific addresses. I am currently working on an improved workflow to have site address points serve as nodes to optimize results. One of the many benefits of this workflow is no financial cost to produce (outside collecting your roads data). I will provide instructions for creating, and using your virtual machine within this guide.

Steps:–Getting Virtual Box(begin)–

Intro 1. Download/Install Oracle VM(https://www.virtualbox.org/wiki/Downloads)

Intro 2. Start the download/install OSGeo-Live 11(https://live.osgeo.org/en/overview/overview.html).

Pictures used in this workflow will show 10.5, though version 11 can be applied similarly. Make sure you download the version: osgeo-live-11-amd64.iso. If you have trouble finding it, here is the direct link to the download (https://sourceforge.net/projects/osgeo-live/files/10.5/osgeo-live-10.5-amd64.iso/download)
Intro 3. Ready for virtual machine creation: We will utilize the downloaded OSGeo-Live 11 suite with a virtual machine we create to begin our workflow. The steps to create your virtual machine are listed below. Also, here are steps from an earlier workshop with additional details with setting up your virtual machine with osgeo live(http://workshop.pgrouting.org/2.2.10/en/chapters/installation.html).

1.  Create Virutal Machine: In this step we begin creating the virtual machine housing our database.

Open Oracle VM VirtualBox Manager and select “New” located at the top left of the window.

VBstep1

Then fill out name, operating system, memory, etc. to create your first VM.

vbstep1.2

2. Add IDE Controller:  The purpose of this step is to create a placeholder for the osgeo 11 suite to be implemented. In the virtual box main window, right-click your newly-created vm and open the settings.

vbstep2

In the settings window, on the left side select the storage tab.

Find “adds new storage controller button located at the bottom of the tab. Be careful of other buttons labeled “adds new storage attachment”! Select “adds new storage controller button and a drop-down menu will appear. From the top of the drop-down select “Add IDE Controller”.

vbstep2.2

vbstep2.3

You will see a new item appear in the center of the window under the “Storage Tree”.

3.  Add Optical Drive: The osgeo 11 suite will be implemented into the virtual machine via an optical drive. Highlight the new controller IDE you created and select “add optical drive”.

vbstep3

A new window will pop-up and select “Choose Disk”.

vbstep3.2

Locate your downloaded file “osgeo-live 11 amd64.iso” and click open. A new object should appear in the middle window under your new controller displaying “osgeo-live-11.0-amd64.iso”.

vbstep3.3

Finally your virtual machine is ready for use.
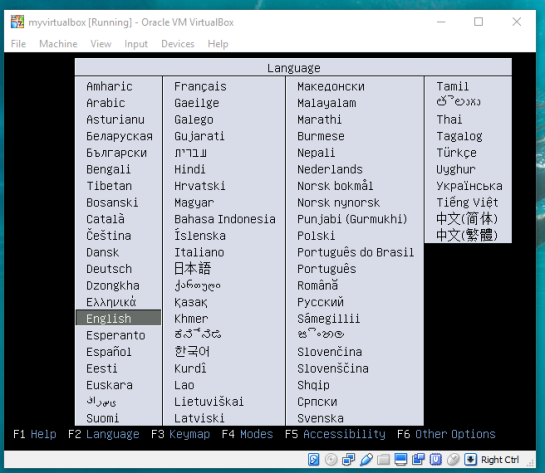
Start your new Virtual Box, then wait and follow the onscreen prompts to begin using your virtual machine.
vbstep3.4

–Getting Virtual Box(end)—

4. Creating the routing database, and both extensions (postgis, pgrouting): The database we create and both extensions we add will provide the functions capable of producing isochrones.

To begin, start by opening the command line tool (hold control+left-alt+T) then log in to postgresql by typing “psql -U user;” into the command line and then press Enter. For the purpose of clear instruction I will refer to database name in this guide as “routing”, feel free to choose your own database name. Please input the command, seen in the figure below, to create the database:

CREATE DATABASE routing;

You can use “\c routing” to connect to the database after creation.

step4

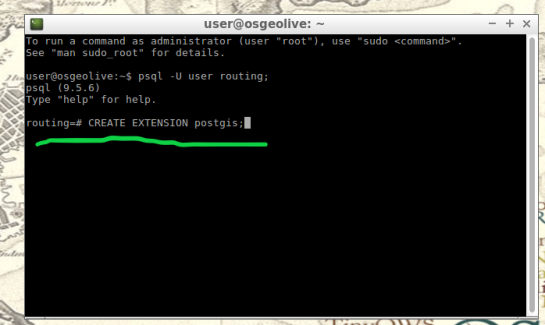
The next step after creating and connecting to your new database is to create both extensions. I find it easier to take two-birds-with-one-stone typing “psql -U user routing;” this will simultaneously log you into postgresql and your routing database.

When your logged into your database, apply the commands below to add both extensions

CREATE EXTENSION postgis;
CREATE EXTENSION pgrouting;
step4.2

step4.3

5. Load shapefile to database: In this next step, the shapefile of your roads data must be placed into your virtual machine and further into your database.

My method is using email to send myself the roads shapefile then download and copy it from within my virtual machines web browser. From the desktop of your Virtual Machine, open the folder named “Databases” and select the application “shape2pgsql”.

step5

Follow the UI of shp2pgsql to connect to your routing database you created in Step 4.

step5.2

Next, select “Add File” and find your roads shapefile (in this guide we will call our shapefile “roads_table”) you want to use for your isochrones and click Open.

step5.3

Finally, click “Import” to place your shapefile into your routing database.

6. Add source & target columns: The purpose of this step is to create columns which will serve as placeholders for our nodes data we create later.

There are multiple ways to add these columns into the roads_table. The most important part of this step is which table you choose to edit, the names of the columns you create, and the format of the columns. Take time to ensure the source & target columns are integer format. Below are the commands used in your command line for these functions.

ALTER TABLE roads_table ADD COLUMN "source" integer;
ALTER TABLE roads_table ADD COLUMN "target" integer;

step6

step6.2

7. Create topology: Next, we will use a function to attach a node to each end of every road segment in the roads_table. The function in this step will create these nodes. These newly-created nodes will be stored in the source and target columns we created earlier in step 6.

As well as creating nodes, this function will also create a new table which will contain all these nodes. The suffix “_vertices_pgr” is added to the name of your shapefile to create this new table. For example, using our guide’s shapefile name , “roads_table”, the nodes table will be named accordingly: roads_table_vertices_pgr. However, we will not use the new table created from this function (roads_table_vertices_pgr). Below is the function, and a second simplified version, to be used in the command line for populating our source and target columns, in other words creating our network topology. Note the input format, the “geom” column in my case was called “the_geom” within my shapefile:

pgr_createTopology('roads_table', 0.001, 'geom', 'id',
 'source', 'target', rows_where := 'true', clean := f)

step7

Here is a direct link for more information on this function: http://docs.pgrouting.org/2.3/en/src/topology/doc/pgr_createTopology.html#pgr-create-topology

Below is an example(simplified) function for my roads shapefile:

SELECT pgr_createTopology('roads_table', 0.001, 'the_geom', 'id')

8. Create a second nodes table: A second nodes table will be created for later use. This second node table will contain the node data generated from pgr_createtopology function and be named “node”. Below is the command function for this process. Fill in your appropriate source and target fields following the manner seen in the command below, as well as your shapefile name.

To begin, find the folder on the Virtual Machines desktop named “Databases” and open the program “pgAdmin lll” located within.

step8

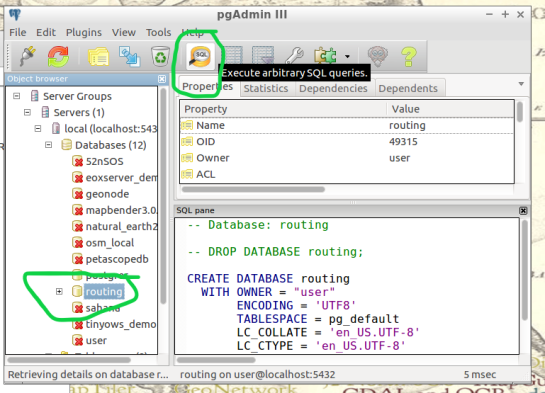
Connect to your routing database in pgAdmin window. Then highlight your routing database, and find “SQL” tool at the top of the pgAdmin window. The tool resembles a small magnifying glass.
step8.2

We input the below function into the SQL window of pgAdmin. Feel free to refer to this link for further information: (https://anitagraser.com/2011/02/07/a-beginners-guide-to-pgrouting/)

CREATE TABLE node AS
   SELECT row_number() OVER (ORDER BY foo.p)::integer AS id,
          foo.p AS the_geom
   FROM (     
      SELECT DISTINCT roads_table.source AS p FROM roads_table
      UNION
      SELECT DISTINCT roads_table.target AS p FROM roads_table
   ) foo
   GROUP BY foo.p;

step8.3

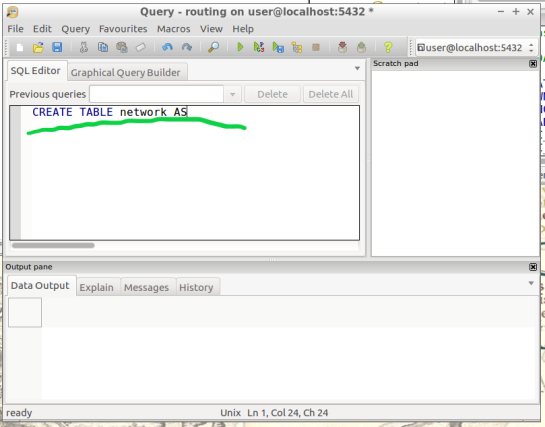
  1.  Create a routable network: After creating the second node table from step 8,  we will combine this node table(node) with our shapefile(roads_table) into one, new, table(network) that will be used as the routing network. This table will be called “network” and will be capable of processing routing queries.  Please input this command and execute in SQL pgAdmin tool as we did in step 8. Here is a reference for more information:(https://anitagraser.com/2011/02/07/a-beginners-guide-to-pgrouting/)   

step8.2


CREATE TABLE network AS
   SELECT a.*, b.id as start_id, c.id as end_id
   FROM roads_table AS a
      JOIN node AS b ON a.source = b.the_geom
      JOIN node AS c ON a.target = c.the_geom;
step9.2

10. Create a “noded” view of the network:  This new view will later be used to calculate the visual isochrones in later steps. Input this command and execute in SQL pgAdmin tool.

CREATE OR REPLACE VIEW network_nodes AS 
SELECT foo.id,
 st_centroid(st_collect(foo.pt)) AS geom 
FROM ( 
  SELECT network.source AS id,
         st_geometryn (st_multi(network.geom),1) AS pt 
  FROM network
  UNION 
  SELECT network.target AS id, 
         st_boundary(st_multi(network.geom)) AS pt 
  FROM network) foo 
GROUP BY foo.id;

step10

11.​ Add column for speed:​ This step may, or may not, apply if your original shapefile contained a field of values for road speeds.

In reality a network of roads will typically contain multiple speed limits. The shapefile you choose may have a speed field, otherwise the discrimination for the following steps will not allow varying speeds to be applied to your routing network respectfully.

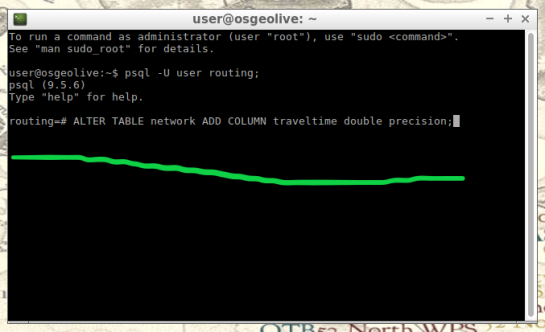
If values of speed exists in your shapefile we will implement these values into a new field, “traveltime“, that will show rate of travel for every road segment in our network based off their geometry. Firstly, we will need to create a column to store individual traveling speeds. The name of our column will be “traveltime” using the format: ​double precision.​ Input this command and execute in the command line tool as seen below.

ALTER TABLE network ADD COLUMN traveltime double precision;
step11

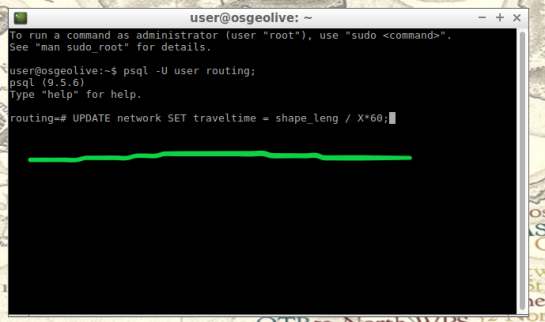
Next, we will populate the new column “traveltime” by calculating traveling speeds using an equation. This equation will take each road segments geometry(shape_leng) and divide by the rate of travel(either mph or kph). The sample command I’m using below utilizes mph as the rate while our geometry(shape_leng) units for my roads_table is in feet​. If you are using either mph or kph, input this command and execute in SQL pgAdmin tool. Below further details explain the variable “X”.

UPDATE network SET traveltime = shape_leng / X*60
step11.2

How to find X​, ​here is an example​: Using example 30 mph as rate. To find X, we convert 30 miles to feet, we know 5280 ft = 1 mile, so we multiply 30 by 5280 and this gives us 158400 ft. Our rate has been converted from 30 miles per hour to 158400 feet per hour. For a rate of 30 mph, our equation for the field “traveltime”  equates to “shape_leng / 158400*60″. To discriminate this calculations output, we will insert additional details such as “where speed = 30;”. What this additional detail does is apply our calculated output to features with a “30” value in our “speed” field. Note: your “speed” field may be named differently.

UPDATE network SET traveltime = shape_leng / 158400*60 where speed = 30;

Repeat this step for each speed value in your shapefile examples:

UPDATE network SET traveltime = shape_leng / X*60 where speed = 45;
UPDATE network SET traveltime = shape_leng / X*60 where speed = 55;

The back end is done. Great Job!

Our next step will be visualizing our data in QGIS. Open and connect QGIS to your routing database by right-clicking “PostGIS” in the Browser Panel within QGIS main window. Confirm the checkbox “Also list tables with no geometry” is checked to allow you to see the interior of your database more clearly. Fill out the name or your routing database and click “OK”.

If done correctly, from QGIS you will have access to tables and views created in your routing database. Feel free to visualize your network by drag-and-drop the network table into your QGIS Layers Panel. From here you can use the identify tool to select each road segment, and see the source and target nodes contained within that road segment. The node you choose will be used in the next step to create the views of drive-time.

12.Create views​: In this step, we create views from a function designed to determine the travel time cost. Transforming these views with tools will visualize the travel time costs as isochrones.

The command below will be how you start querying your database to create drive-time isochrones. Begin in QGIS by draging your network table into the contents. The visual will show your network as vector(lines). Simply select the road segment closest to your point of interest you would like to build your isochrone around. Then identify the road segment using the identify tool and locate the source and target fields.

step12

step12.2

Place the source or target field value in the below command where you see ​VALUE​, in all caps​.

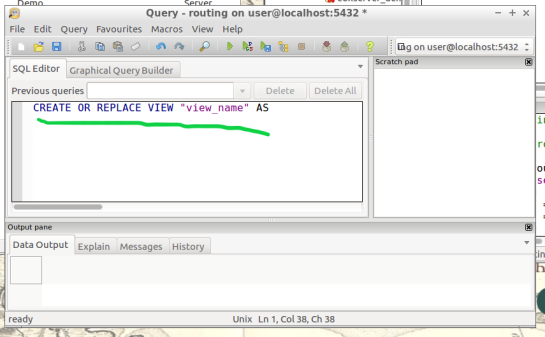
This will serve you now as an isochrone catchment function for this workflow. Please feel free to use this command repeatedly for creating new isochrones by substituting the source value. Please input this command and execute in SQL pgAdmin tool.

*AT THE BOTTOM OF THIS WORKFLOW I PROVIDED AN EXAMPLE USING SOURCE VALUE “2022”

CREATE OR REPLACE VIEW "​view_name" AS 
SELECT di.seq, 
       di.id1, 
       di.id2, 
       di.cost, 
       pt.id, 
       pt.geom 
FROM pgr_drivingdistance('SELECT
     gid::integer AS id, 
     Source::integer AS source, 
     Target::integer AS target,                                    
     Traveltime::double precision AS cost 
       FROM network'::text, ​VALUE::bigint, 
    100000::double precision, false, false)
    di(seq, id1, id2, cost)
JOIN network_nodes pt ON di.id1 = pt.id;
step12.3

13.Visualize Isochrone: Applying tools to the view will allow us to adjust the visual aspect to a more suitable isochrone overlay.

​After creating your view, a new item in your routing database is created, using the “view_name” you chose. Drag-and-drop this item into your QGIS LayersPanel. You will see lots of small dots which represent the nodes.

In the figure below, I named my view “take1“.

step13

Each node you see contains a drive-time value, “cost”, which represents the time used to travel from the node you input in step 12’s function.
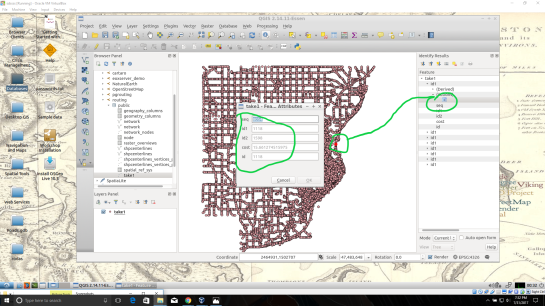
step13.2

Start by installing the QGIS plug-in Interpolation” by opening the Plugin Manager in QGIS interface.
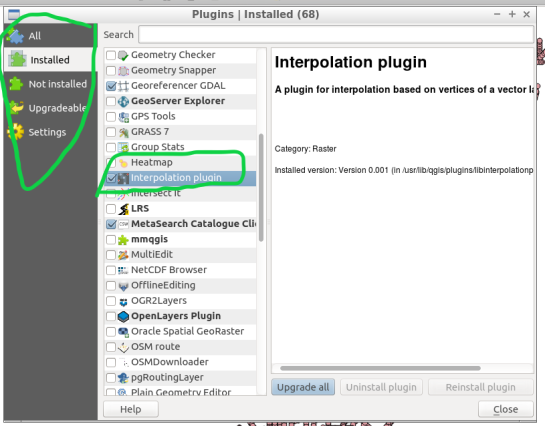
step13.3

Next, at the top of QGIS window select “Raster” and a drop-down will appear, select “Interpolation”.
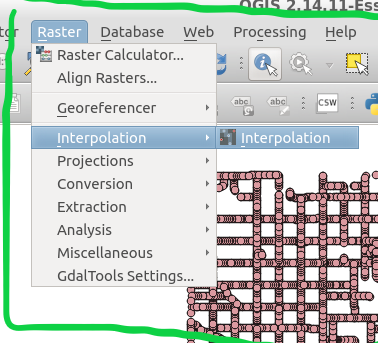
step13.4


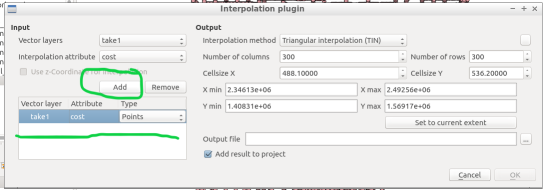
A new window pops up and asks you for input.

step13.5

Select your “​view”​ as the​ vector layer​, select ​”cost​” as your ​interpolation attribute​, and then click “Add”.

step13.6

A new vector layer will show up in the bottom of the window, take care the type is Points. For output, on the other half of the window, keep the interpolation method as “TIN”, edit the ​output file​ location and name. Check the box “​Add result to project​”.

Note: decreasing the cellsize of X and Y will increase the resolution but at the cost of performance.

Click “OK” on the bottom right of the window.

step13.7

A black and white raster will appear in QGIS, also in the Layers Panel a new item was created.
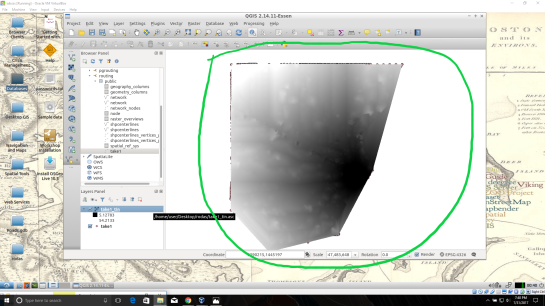
step13.8

Take some time to visualize the raster by coloring and adjusting values in symbology until you are comfortable with the look.

step13.9

step13.10

14. ​Create contours of our isochrone:​ Contours can be calculated from the isochrone as well.

Find near the top of QGIS window, open the “Raster” menu drop-down and select Extraction → Contour.

step14

Fill out the appropriate interval between contour lines but leave the check box “Attribute name” unchecked. Click “OK”.

step14.2

step14.3

15.​ Zip and Share:​ Find where you saved your TIN and contours, compress them in a zip folder by highlighting them both and right-click to select “compress”. Email the compressed folder to yourself to export out of your virtual machine.

Example Isochrone catchment for this workflow:

CREATE OR REPLACE VIEW "2022" AS 
SELECT di.seq, Di.id1, Di.id2, Di.cost,                           
       Pt.id, Pt.geom 
FROM pgr_drivingdistance('SELECT gid::integer AS id,                                       
     Source::integer AS source, Target::integer AS target, 
     Traveltime::double precision AS cost FROM network'::text, 
     2022::bigint, 100000::double precision, false, false) 
   di(seq, id1, id2, cost) 
JOIN netowrk_nodes pt 
ON di.id1 = pt.id;

References: Virtual Box ORACLE VM, OSGeo-Live 11  amd64 iso, Workshop FOSS4G Bonn(​http://workshop.pgrouting.org/2.2.10/en/index.html​),

Movement data in GIS #7: animated trajectories with TimeManager

In this post, we use TimeManager to visualize the position of a moving object over time along a trajectory. This is another example of what is possible thanks to QGIS’ geometry generator feature. The result can look like this:

What makes this approach interesting is that the trajectory is stored in PostGIS as a LinestringM instead of storing individual trajectory points. So there is only one line feature loaded in QGIS:

(In part 2 of this series, we already saw how a geometry generator can be used to visualize speed along a trajectory.)

The layer is added to TimeManager using t_start and t_end attributes to define the trajectory’s temporal extent.

TimeManager exposes an animation_datetime() function which returns the current animation timestamp, that is, the timestamp that is also displayed in the TimeManager dock, as well as on the map (if we don’t explicitly disable this option).

Once TimeManager is set up, we can edit the line style to add a point marker to visualize the position of the moving object at the current animation timestamp. To do that, we interpolate the position along the trajectory segments. The first geometry generator expression splits the trajectory in its segments:

The second geometry generator expression interpolates the position on the segment that contains the current TimeManager animation time:

The WHEN statement compares the trajectory segment’s start and end times to the current TimeManager animation time. Afterwards, the line_interpolate_point function is used to draw the point marker at the correct position along the segment:

CASE 
WHEN (
m(end_point(geometry_n($geometry,@geometry_part_num)))
> second(age(animation_datetime(),to_datetime('1970-01-01 00:00')))
AND
m(start_point(geometry_n($geometry,@geometry_part_num)))
<= second(age(animation_datetime(),to_datetime('1970-01-01 00:00')))
)
THEN
line_interpolate_point( 
  geometry_n($geometry,@geometry_part_num),
  1.0 * (
    second(age(animation_datetime(),to_datetime('1970-01-01 00:00')))
	- m(start_point(geometry_n($geometry,@geometry_part_num)))
  ) / (
    m(end_point(geometry_n($geometry,@geometry_part_num)))
	- m(start_point(geometry_n($geometry,@geometry_part_num)))
  ) 
  * length(geometry_n($geometry,@geometry_part_num))
)
END

Here is the animation result for a part of the trajectory between 08:00 and 09:00:


Read more:


Movement data in GIS #6: updates from AGILE2017

AGILE 2017 is the annual international conference on Geographic Information Science of the Association of Geographic Information Laboratories in Europe (AGILE) which was established in 1998 to promote academic teaching and research on GIS.

This years conference in Wageningen was my time at AGILE.  I had the honor to present our recent work on pedestrian navigation with landmarks [Graser, 2017].

If you are interested in trying it, there is an online demo. The conference also provided numerous pointers toward ideas for future improvements, including [Götze and Boye, 2016] and [Du et al., 2017]

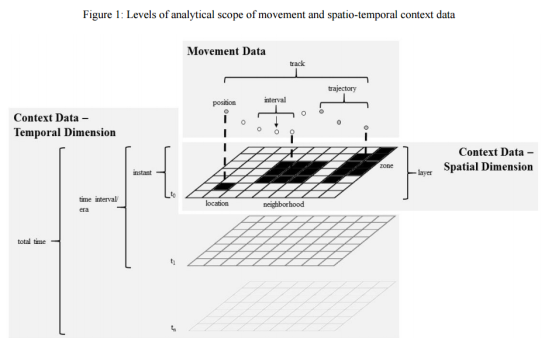
On the issue of movement data in GIS, there weren’t too many talks on this topic at AGILE but on the conceptual side, I really enjoyed David Jonietz’ talk on how to describe trajectory processing steps:

Source: [Jonietz and Bucher, 2017]

In the pre-conference workshop I attended, there was also an interesting presentation on analyzing trajectory data with PostGIS by Phd candidate Meihan Jin.

I’m also looking forward to reading [Wiratma et al., 2017] “On Measures for Groups of Trajectories” because I think that the presentation only scratched the surface.

References

[Du et al, 2017] Du, S., Wang, X., Feng, C. C., & Zhang, X. (2017). Classifying natural-language spatial relation terms with random forest algorithm. International Journal of Geographical Information Science, 31(3), 542-568.
[Götze and Boye, 2016] Götze, J., & Boye, J. (2016). Learning landmark salience models from users’ route instructions. Journal of Location Based Services, 10(1), 47-63.
[Graser, 2017] Graser, A. (2017). Towards landmark-based instructions for pedestrian navigation systems using OpenStreetMap, AGILE2017, Wageningen, Netherlands.
[Jonietz and Bucher, 2017] Jonietz, D., Bucher, D. (2017). Towards an Analytical Framework for Enriching Movement Trajectories with Spatio-Temporal Context Data, AGILE2017, Wageningen, Netherlands.
[Wiratma et al., 2017] Wiratma L., van Kreveld M., Löffler M. (2017) On Measures for Groups of Trajectories. In: Bregt A., Sarjakoski T., van Lammeren R., Rip F. (eds) Societal Geo-innovation. GIScience 2017. Lecture Notes in Geoinformation and Cartography. Springer, Cham


Movement data in GIS #5: current research topics

In the 1st part of this series, I mentioned the Workshop on Analysis of Movement Data at the GIScience 2016 conference. Since the workshop took place in September 2016, 11 abstracts have been published (the website seems to be down currently, see the cached version) covering topics from general concepts for movement data analysis, to transport, health, and ecology specific articles. Here’s a quick overview of what researchers are currently working on:

  • General topics
    • Interpolating trajectories with gaps in the GPS signal while taking into account the context of the gap [Hwang et al., 2016]
    • Adding time and weather context to understand their impact on origin-destination flows [Sila-Nowicka and Fotheringham, 2016]
    • Finding optimal locations for multiple moving objects to meet and still arrive at their destination in time [Gao and Zeng, 2016]
    • Modeling checkpoint-based movement data as sequence of transitions [Tao, 2016]
  • Transport domain
    • Estimating junction locations and traffic regulations using extended floating car data [Kuntzsch et al., 2016]
  • Health domain
    • Clarifying physical activity domain semantics using ontology design patterns [Sinha and Howe, 2016]
    • Recognizing activities based on Pebble Watch sensors and context for eight gestures, including brushing one’s teeth and combing one’s hair [Cherian et al., 2016]
    • Comparing GPS-based indicators of spatial activity with reported data [Fillekes et al., 2016]
  • Ecology domain
    • Linking bird movement with environmental context [Bohrer et al., 2016]
    • Quantifying interaction probabilities for moving and stationary objects using probabilistic space-time prisms [Loraamm et al., 2016]
    • Generating probability density surfaces using time-geographic density estimation [Downs and Hyzer, 2016]

If you are interested in movement data in the context of ecological research, don’t miss the workshop on spatio-temporal analysis, modelling and data visualisation for movement ecology at the Lorentz Center in Leiden in the Netherlands. There’s currently a call for applications for young researchers who want to attend this workshop.

Since I’m mostly working with human and vehicle movement data in outdoor settings, it is interesting to see the bigger picture of movement data analysis in GIScience. It is worth noting that the published texts are only abstracts, therefore there is not much detail about algorithms and whether the code will be available as open source.

For more reading: full papers of the previous workshop in 2014 have been published in the Int. Journal of Geographical Information Science, vol 30(5). More special issues on “Computational Movement Analysis” and “Representation and Analytical Models for Location-based Social Media Data and Tracking Data” have been announced.

References

[Bohrer et al., 2016] Bohrer, G., Davidson, S. C., Mcclain, K. M., Friedemann, G., Weinzierl, R., and Wikelski, M. (2016). Contextual Movement Data of Bird Flight – Direct Observations and Annotation from Remote Sensing.
[Cherian et al., 2016] Cherian, J., Goldberg, D., and Hammond, T. (2016). Sensing Day-to-Day Activities through Wearable Sensors and AI.
[Downs and Hyzer, 2016] Downs, J. A. and Hyzer, G. (2016). Spatial Uncertainty in Animal Tracking Data: Are We Throwing Away Useful Information?
[Fillekes et al., 2016] Fillekes, M., Bereuter, P. S., and Weibel, R. (2016). Comparing GPS-based Indicators of Spatial Activity to the Life-Space Questionnaire (LSQ) in Research on Health and Aging.
[Gao and Zeng, 2016] Gao, S. and Zeng, Y. (2016). Where to Meet: A Context-Based Geoprocessing Framework to Find Optimal Spatiotemporal Interaction Corridor for Multiple Moving Objects.
[Hwang et al., 2016] Hwang, S., Yalla, S., and Crews, R. (2016). Conditional resampling for segmenting GPS trajectory towards exposure assessment.
[Kuntzsch et al., 2016] Kuntzsch, C., Zourlidou, S., and Feuerhake, U. (2016). Learning the Traffic Regulation Context of Intersections from Speed Profile Data.
[Loraamm et al., 2016] Loraamm, R. W., Downs, J. A., and Lamb, D. (2016). A Time-Geographic Approach to Wildlife-Road Interactions.
[Sila-Nowicka and Fotheringham, 2016] Sila-Nowicka, K. and Fotheringham, A. (2016). A route map to calibrate spatial interaction models from GPS movement data.
[Sinha and Howe, 2016] Sinha, G. and Howe, C. (2016). An Ontology Design Pattern for Semantic Modelling of Children’s Physical Activities in School Playgrounds.
[Tao, 2016] Tao, Y. (2016). Data Modeling for Checkpoint-based Movement Data.


Movement data in GIS #4: variations over time

In the previous post, I presented an approach to generalize big trajectory datasets by extracting flows between cells of a data-driven irregular grid. This generalization provides a much better overview of the flow and directionality than a simple plot of the original raw trajectory data can. The paper introducing this method also contains more advanced visualizations that show cell statistics, such as the overall count of trajectories or the generalization quality. Another bit of information that is often of interest when exploring movement data, is the time of the movement. For example, at LBS2016 last week, M. Jahnke presented an application that allows users to explore the number of taxi pickups and dropoffs at certain locations:

By adopting this approach for the generalized flow maps, we can, for example, explore which parts of the research area are busy at which time of the day. Here I have divided the day into four quarters: night from 0 to 6 (light blue), morning from 6 to 12 (orange), afternoon from 12 to 18 (red), and evening from 18 to 24 (dark blue).

 (data credits: GeoLife project,

Aggregated trajectories with time-of-day markers at flow network nodes (data credits: GeoLife project, map tiles: Carto, map data: OSM)

The resulting visualization shows that overall, there is less movement during the night hours from midnight to 6 in the morning (light blue quarter). Sounds reasonable!

One implementation detail worth considering is which timestamp should be used for counting the number of movements. Should it be the time of the first trajectory point entering a cell, or the time when the trajectory leaves the cell, or some average value? In the current implementation, I have opted for the entry time. This means that if the tracked person spends a long time within a cell (e.g. at the work location) the trip home only adds to the evening trip count of the neighboring cell along the trajectory.

Since the time information stored in a PostGIS LinestringM feature’s m-value does not contain any time zone information, we also have to pay attention to handle any necessary offsets. For example, the GeoLife documentation states that all timestamps are provided in GMT while Beijing is in the GMT+8 time zone. This offset has to be accounted for in the analysis script, otherwise the counts per time of day will be all over the place.

Using the same approach, we could also investigate other variations, e.g. over different days of the week, seasonal variations, or the development over multiple years.


Movement data in GIS #3: visualizing massive trajectory datasets

In the fist two parts of the Movement Data in GIS series, I discussed modeling trajectories as LinestringM features in PostGIS to overcome some common issues of movement data in GIS and presented a way to efficiently render speed changes along a trajectory in QGIS without having to split the trajectory into shorter segments.

While visualizing individual trajectories is important, the real challenge is trying to visualize massive trajectory datasets in a way that enables further analysis. The out-of-the-box functionality of GIS is painfully limited. Except for some transparency and heatmap approaches, there is not much that can be done to help interpret “hairballs” of trajectories. Luckily researchers in visual analytics have already put considerable effort into finding solutions for this visualization challenge. The approach I want to talk about today is by Andrienko, N., & Andrienko, G. (2011). Spatial generalization and aggregation of massive movement data. IEEE Transactions on visualization and computer graphics, 17(2), 205-219. and consists of the following main steps:

  1. Extracting characteristic points from the trajectories
  2. Grouping the extracted points by spatial proximity
  3. Computing group centroids and corresponding Voronoi cells
  4. Deviding trajectories into segments according to the Voronoi cells
  5. Counting transitions from one cell to another

The authors do a great job at describing the concepts and algorithms, which made it relatively straightforward to implement them in QGIS Processing. So far, I’ve implemented the basic logic but the paper contains further suggestions for improvements. This was also my first pyQGIS project that makes use of the measurement value support in the new geometry engine. The time information stored in the m-values is used to detect stop points, which – together with start, end, and turning points – make up the characteristic points of a trajectory.

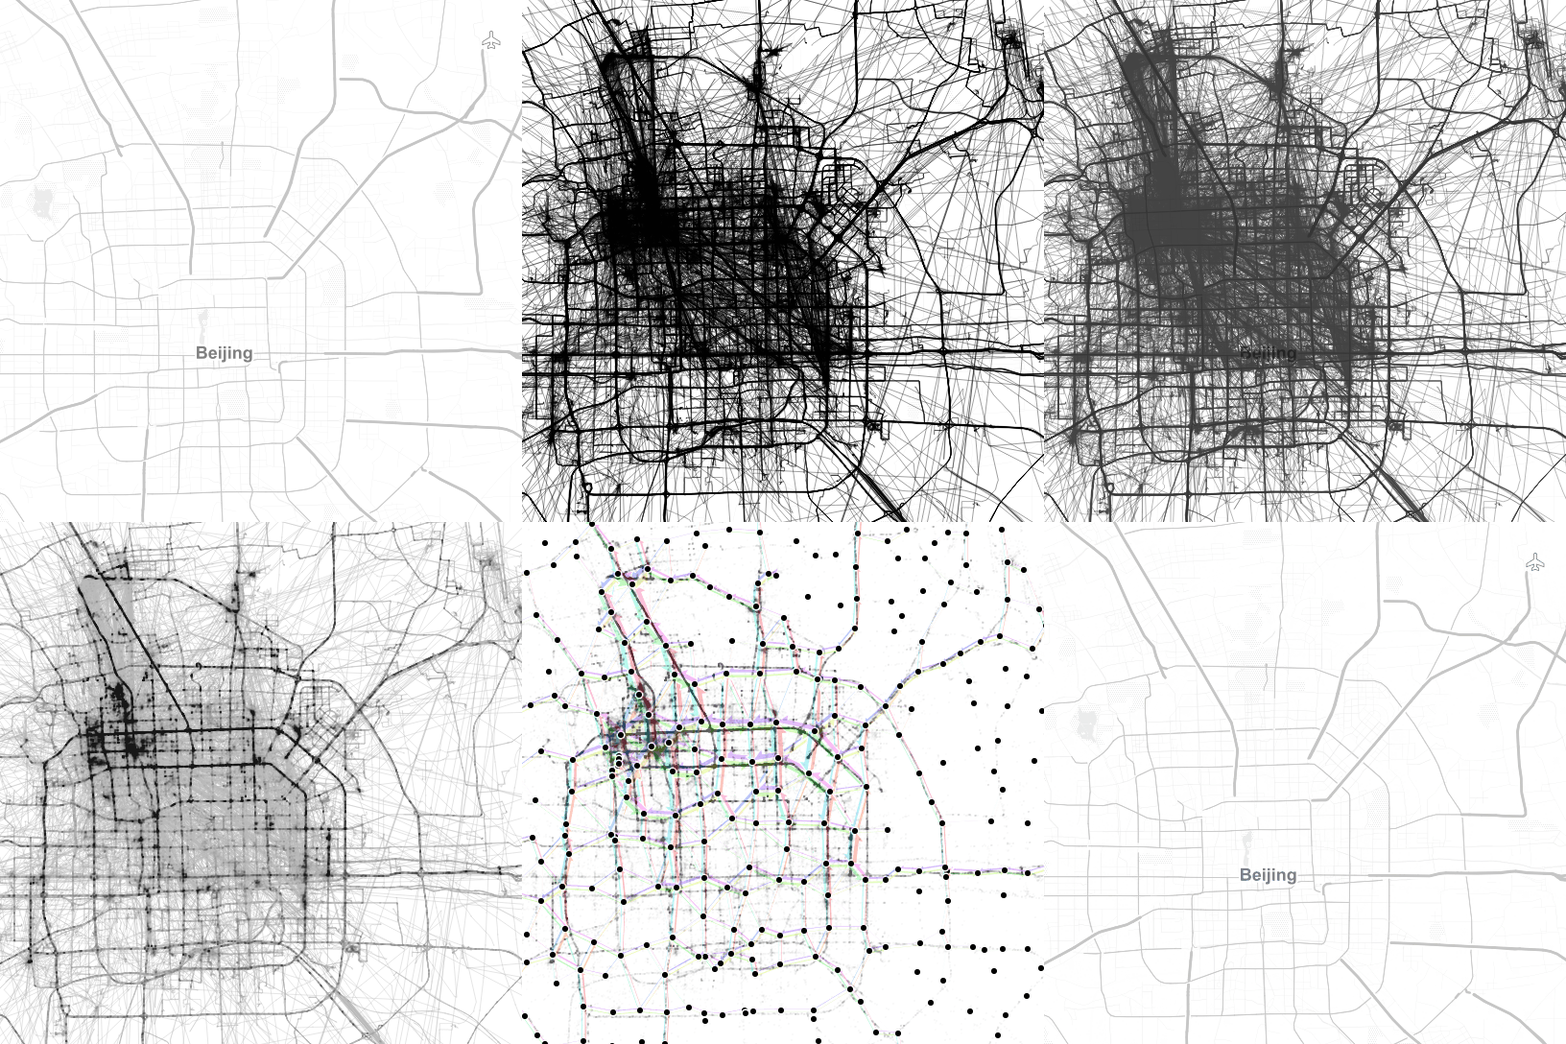
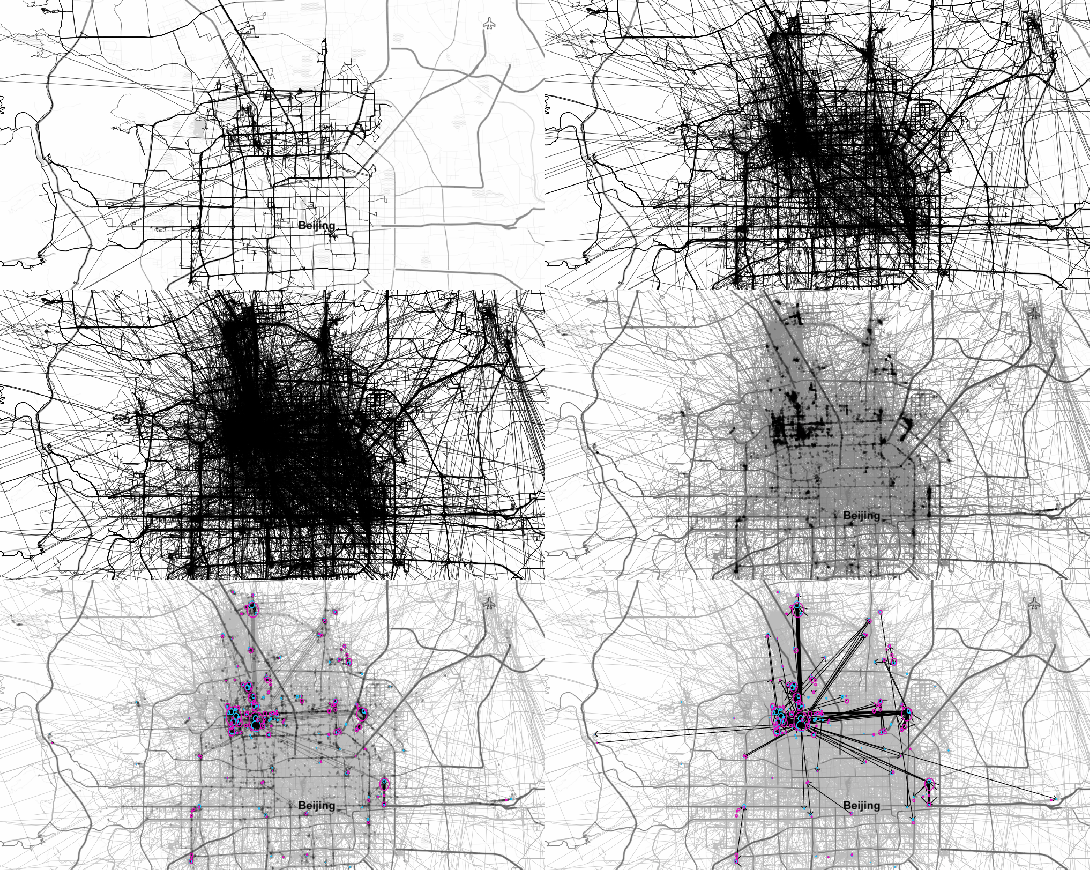
The following animation illustrates the current state of the implementation: First the “hairball” of trajectories is rendered. Then we extract the characteristic points and group them by proximity. The big black dots are the resulting group centroids. From there, I skipped the Voronoi cells and directly counted transitions from “nearest to centroid A” to “nearest to centroid B”.

(data credits: GeoLife project)

From thousands of individual trajectories to a generalized representation of overall movement patterns (data credits: GeoLife project, map tiles: Stamen, map data: OSM)

The resulting visualization makes it possible to analyze flow strength as well as directionality. I have deliberately excluded all connections with a count below 10 transitions to reduce visual clutter. The cell size / distance between point groups – and therefore the level-of-detail – is one of the input parameters. In my example, I used a target cell size of approximately 2km. This setting results in connections which follow the major roads outside the city center very well. In the city center, where the road grid is tighter, trajectories on different roads mix and the connections are less clear.

Since trajectories in this dataset are not limited to car trips, it is expected to find additional movement that is not restricted to the road network. This is particularly noticeable in the dense area in the west where many slow trajectories – most likely from walking trips – are located. The paper also covers how to ensure that connections are limited to neighboring cells by densifying the trajectories before computing step 4.

trajectory_generalization

Running the scripts for over 18,000 trajectories requires patience. It would be worth evaluating if the first three steps can be run with only a subsample of the data without impacting the results in a negative way.

One thing I’m not satisfied with yet is the way to specify the target cell size. While it’s possible to measure ellipsoidal distances in meters using QgsDistanceArea (irrespective of the trajectory layer’s CRS), the initial regular grid used in step 2 in order to group the extracted points has to be specified in the trajectory layer’s CRS units – quite likely degrees. Instead, it may be best to transform everything into an equidistant projection before running any calculations.

It’s good to see that PyQGIS enables us to use the information encoded in PostGIS LinestringM features to perform spatio-temporal analysis. However, working with m or z values involves a lot of v2 geometry classes which work slightly differently than their v1 counterparts. It certainly takes some getting used to. This situation might get cleaned up as part of the QGIS 3 API refactoring effort. If you can, please support work on QGIS 3. Now is the time to shape the PyQGIS API for the following years!


Movement data in GIS #2: visualization

In the first part of the Movement Data in GIS series, I discussed some of the common issues of modeling movement data in GIS, followed by a recommendation to model trajectories as LinestringM features in PostGIS to simplify analyses and improve query performance.

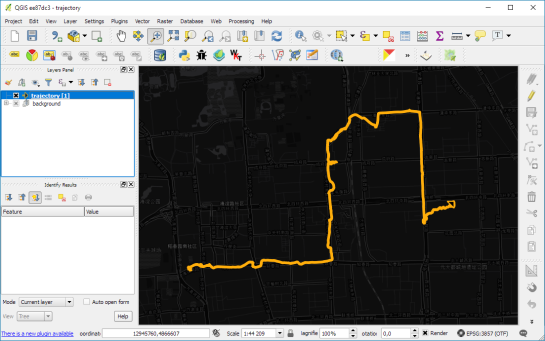
Of course, we don’t only want to analyse movement data within the database. We also want to visualize it to gain a better understanding of the data or communicate analysis results. For example, take one trajectory:

(data credits: GeoLife project)

Visualizing movement direction is easy: just slap an arrow head on the end of the line and done. What about movement speed? Sure! Mean speed, max speed, which should it  be?

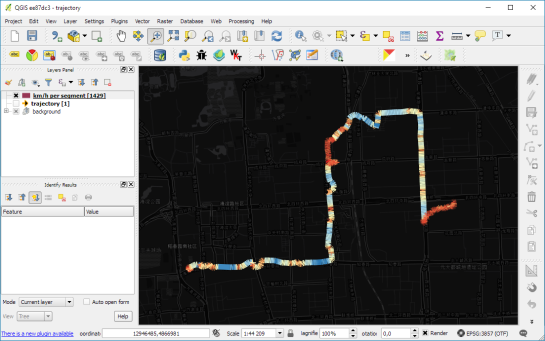
Speed along the trajectory, a value for each segment between consecutive positions.

With the usual GIS data model, we are back to square one. A line usually has one color and width. Of course we can create doted and dashed lines but that’s not getting us anywhere here. To visualize speed variations along the trajectory, we therefore split the original trajectory into its segments, 1429 in this case. Then we can calculate speed for each segment and use a graduated or data defined renderer to show the results:

trajectory_segment_features

Speed along trajectory: red = slow to blue = fast

Very unsatisfactory! We had to increase the number of features 1429 times just to show speed variations along the trajectory, even though the original single trajectory feature already contained all the necessary information and QGIS does support geometries with measurement values.

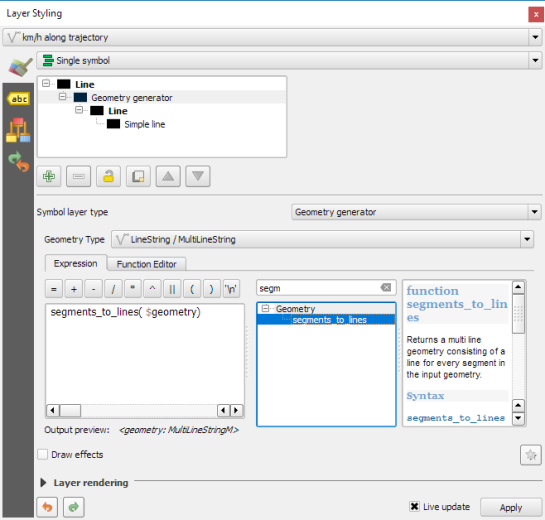
Starting from QGIS 2.14, we have an alternative way to deal with this issue. We can stick to the original single trajectory feature and render it using the new geometry generator symbol layer. (This functionality is also used under the hood of the 2.5D renderer.) Using the segments_to_lines() function, the geometry generator basically creates individual segment lines on the fly:

geomgenerator

Segments_to_lines( $geometry) returns a multi line geometry consisting of a line for every segment in the input geometry

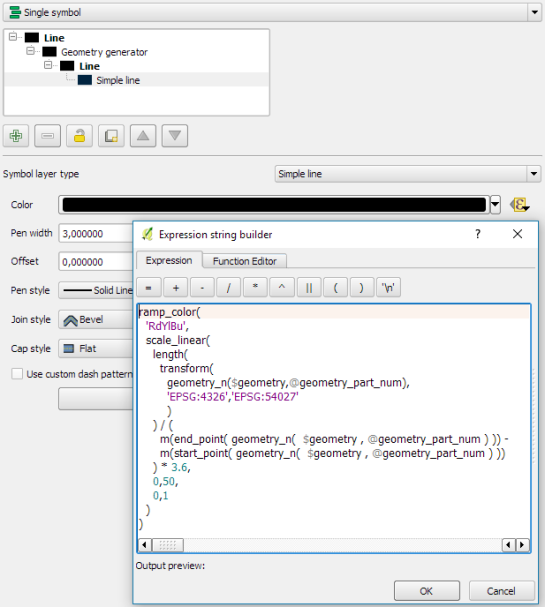
Once this is set up, we can style the segments with a data-defined expression that determines the speed on the segment and returns the respective color along a color ramp:

segment_speed_color

Speed is calculated using the length of the segment and the time between segment start and end point. Then speed values from 0 to 50 km/h are mapped to the red-yellow-blue color ramp:

ramp_color(
  'RdYlBu',
  scale_linear(
    length( 
      transform(
	    geometry_n($geometry,@geometry_part_num),
		'EPSG:4326','EPSG:54027'
		)
    ) / (
      m(end_point(  geometry_n($geometry,@geometry_part_num))) -
      m(start_point(geometry_n($geometry,@geometry_part_num)))
    ) * 3.6,
    0,50,
    0,1
  )
)

Thanks a lot to @nyalldawson for all the help figuring out the details!

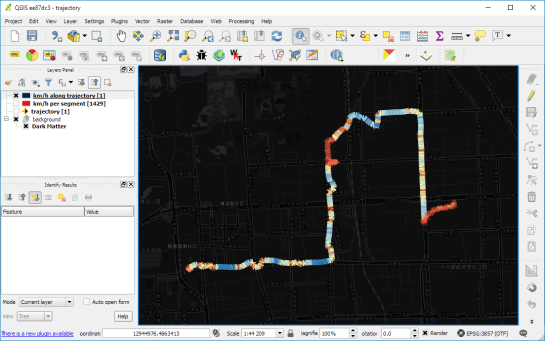
While the following map might look just like the previous one in the end, note that we now only deal with the original single line feature:

trajectory_geomgenerator

Similar approaches can be used to label segments or positions along the trajectory without having to break the original feature. Thanks to the geometry generator functionality, we can make direct use of the LinestringM data model for trajectory visualization.


How to visualize bird migration data with QGIS TimeManager

A common use case of the QGIS TimeManager plugin is visualizing tracking data such as animal migration data. This post illustrates the steps necessary to create an animation from bird migration data. I’m using a dataset published on Movebank:

Fraser KC, Shave A, Savage A, Ritchie A, Bell K, Siegrist J, Ray JD, Applegate K, Pearman M (2016) Data from: Determining fine-scale migratory connectivity and habitat selection for a migratory songbird by using new GPS technology. Movebank Data Repository. doi:10.5441/001/1.5q5gn84d.

It’s a CSV file which can be loaded into QGIS using the Add delimited text layer tool. Once loaded, we can get started:

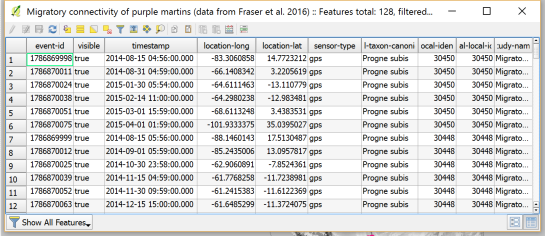
1. Identify time and ID columns

Especially if you are new to the dataset, have a look at the attribute table and identify the attributes containing timestamps and ID of the moving object. In our sample dataset, time is stored in the aptly named timestamp attribute and uses ISO standard formatting %Y-%m-%d %H:%M:%S.%f. This format is ideal for TimeManager and we can use it without any changes. The object ID attribute is titled individual-local-identifier.

movebank_data

The dataset contains 128 positions of 14 different birds. This means that there are rather long gaps between consecutive observations. In our animation, we’ll want to fill these gaps with interpolated positions to get uninterrupted movement traces.

2. Configuring TimeManager

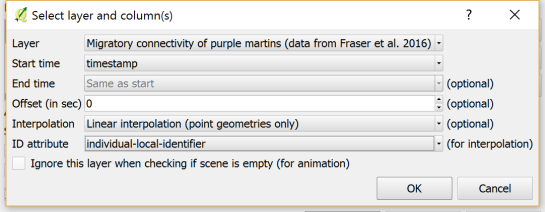
To set up the animation, go to the TimeManager panel and click Settings | Add Layer. In the following dialog we can specify the time and ID attributes which we identified in the previous step. We also enable linear interpolation. The interpolation option will create an additional point layer in the QGIS project, which contains the interpolated positions.

timemanager_settings

When using the interpolation option, please note that it currently only works if the point layer is styled with a Single symbol renderer. If a different renderer is configured, it will fail to create the interpolation layer.

Once the layer is configured, the minimum and maximum timestamps will be displayed in the TimeManager dock right bellow the time slider. For this dataset, it makes sense to set the Time frame size, that is the time between animation frames, to one day, so we will see one frame per day:

timemanager_dock

Now you can test the animation by pressing the TimeManager’s play button. Feel free to add more data, such as background maps or other layers, to your project. Besides exploring the animated data in QGIS, you can also create a video to share your results.

3. Creating a video

To export the animation, click the Export video button. If you are using Linux, you can export videos directly from QGIS. On Windows, you first need to export the animation frames as individual pictures, which you can then convert to a video (for example using the free Windows Movie Maker application).

These are the basic steps to set up an animation for migration data. There are many potential extensions to this animation, including adding permanent traces of past movements. While this approach serves us well for visualizing bird migration routes, it is easy to imagine that other movement data would require different interpolation approaches. Vehicle data, for example, would profit from network-constrained interpolation between observed positions.

If you find the TimeManager plugin useful, please consider supporting its development or getting involved. Many features, such as interpolation, are weekend projects that are still in a proof-of-concept stage. In addition, we have the huge upcoming challenge of migrating the plugin to Python 3 and Qt5 to support QGIS3 ahead of us. Happy QGISing!


Movement data in GIS: issues & ideas

Since I’ve started working, transport and movement data have been at the core of many of my projects. The spatial nature of movement data makes it interesting for GIScience but typical GIS tools are not a particularly good match.

Dealing with the temporal dynamics of geographic processes is one of the grand challenges for Geographic Information Science. Geographic Information Systems (GIS) and related spatial analysis methods are quite adept at handling spatial dimensions of patterns and processes, but the temporal and coupled space-time attributes of phenomena are difficult to represent and examine with contemporary GIS. (Dr. Paul M. Torrens, Center for Urban Science + Progress, New York University)

It’s still a hot topic right now, as the variety of related publications and events illustrates. For example, just this month, there is an Animove two-week professional training course (18–30 September 2016, Max-Planck Institute for Ornithology, Lake Konstanz) as well as the GIScience 2016 Workshop on Analysis of Movement Data (27 September 2016, Montreal, Canada).

Space-time cubes and animations are classics when it comes to visualizing movement data in GIS. They can be used for some visual analysis but have their limitations, particularly when it comes to working with and trying to understand lots of data. Visualization and analysis of spatio-temporal data in GIS is further complicated by the fact that the temporal information is not standardized in most GIS data formats. (Some notable exceptions of formats that do support time by design are GPX and NetCDF but those aren’t really first-class citizens in current desktop GIS.)

Most commonly, movement data is modeled as points (x,y, and optionally z) with a timestamp, object or tracker id, and potential additional info, such as speed, status, heading, and so on. With this data model, even simple questions like “Find all tracks that start in area A and end in area B” can become a real pain in “vanilla” desktop GIS. Even if the points come with a sequence number, which makes it easy to identify the start point, getting the end point is tricky without some custom code or queries. That’s why I have been storing the points in databases in order to at least have the powers of SQL to deal with the data. Even so, most queries were still painfully complex and performance unsatisfactory.

So I reached out to the Twitterverse asking for pointers towards moving objects database extensions for PostGIS and @bitnerd, @pwramsey, @hruske, and others replied. Amongst other useful tips, they pointed me towards the new temporal support, which ships with PostGIS 2.2. It includes the following neat functions:

  • ST_IsValidTrajectory — Returns true if the geometry is a valid trajectory.
  • ST_ClosestPointOfApproach — Returns the measure at which points interpolated along two lines are closest.
  • ST_DistanceCPA — Returns the distance between closest points of approach in two trajectories.
  • ST_CPAWithin — Returns true if the trajectories’ closest points of approach are within the specified distance.

Instead of  points, these functions expect trajectories that are stored as LinestringM (or LinestringZM) where M is the time dimension. This approach makes many analyses considerably easier to handle. For example, clustering trajectory start and end locations and identifying the most common connections:

animation_clusters

(data credits: GeoLife project)

Overall, it’s an interesting and promising approach but there are still some open questions I’ll have to look into, such as: Is there an efficient way to store additional info for each location along the trajectory (e.g. instantaneous speed or other status)? How well do desktop GIS play with LinestringM data and what’s the overhead of dealing with it?


City flows unfolding with the other Processing

A previous version of this post has been published in German on Die bemerkenswerte Karte.

Visualizations of mobility data such as taxi or bike sharing trips have become very popular. One of the best most recent examples is cf. city flows developed by Till Nagel and Christopher Pietsch at the FH Potsdam. cf. city flows visualizes the rides in bike sharing systems in New York, Berlin and London at different levels of detail, from overviews of the whole city to detailed comparisons of individual stations:

The visualizations were developed using Unfolding, a library to create interactive maps and geovisualizations in Processing (the other Processing … not the QGIS Processing toolbox) and Java. (I tinkered with the Python port of Processing in 2012, but this is certainly on a completely different level.)

The insights into the design process, which are granted in the methodology section section of the project website are particularly interesting. Various approaches for presenting traffic flows between the stations were tested. Building on initial simple maps, where stations were connected by straight lines, consecutive design decisions are described in detail:

The results are impressive. Particularly the animated trips convey the dynamics of urban mobility very well:

However, a weak point of this (and many similar projects) is the underlying data. This is also addressed directly by the project website:

Lacking actual GPS tracks, the trip trajectories are rendered as smooth paths of the calculated optimal bike routes

This means that the actual route between start and drop off location is not known. The authors therefore estimated the routes using HERE’s routing service. The visualization therefore only shows one of many possible routes. However, cyclists don’t necessarily choose the “best” route as determined by an algorithm – be it the most direct or otherwise preferred. The visualization does not account for this uncertainty in the route selection. Rather, it gives the impression that the cyclist actually traveled on a certain route. It would therefore be undue to use this visualization to derive information about the popularity of certain routes (for example, for urban planning). Moreover, the data only contains information about the fulfilled demand, since only trips that were really performed are recorded. Demand for trips which could not take place due to lack of bicycles or stations, is therefore missing.

As always: exercise some caution when interpreting statistics or visualizations and then sit back and enjoy the animations.

If you want to read more about GIS and transportation modelling, check out
Loidl, M.; Wallentin, G.; Cyganski, R.; Graser, A.; Scholz, J.; Haslauer, E. GIS and Transport Modeling—Strengthening the Spatial Perspective. ISPRS Int. J. Geo-Inf. 2016, 5, 84. (It’s open access.)


Using TimeManager for WMS-T layers

This is a guest post by Karolina Alexiou (aka carolinux), Anita’s collaborator on the Time Manager plugin.

As of version 2.1.5, TimeManager provides some support for stepping through WMS-T layers, a format about which Anita has written  in the past.  From the official definition, the OpenGIS® Web Map Service Interface Standard (WMS) provides a simple HTTP interface for requesting geo-registered map images from one or more distributed geospatial databases. A WMS request defines the geographic layer(s) and area of interest to be processed. The response to the request is one or more geo-registered map images (returned as JPEG, PNG, etc) that can be displayed in a browser application. QGIS can display those images as a raster layer. The WMS-T standard allows the user of the service to set a time boundary in addition to a geographical boundary with their HTTP request.

We are going to add the following url as the web map provider service: http://mesonet.agron.iastate.edu/cgi-bin/wms/nexrad/n0r-t.cgi

From QGIS, go to Layer>Add Layer>Add WMS/WMST Layer and add a new server and connect to it. For the service we have chosen, we only need to specify a name and the url.

Select the top level layer, in our case named nexrad_base_reflect and click Add. Now you have added the layer to your QGIS project.

To add it to TimeManager as well, add it as a raster with the settings from the screenshot below. Start time and end time have the values 2005-08-29:03:10:00Z and 2005-08-30:03:10:00Z respectively, which is a period which overlaps with hurricane Katrina. Now, the WMS-T standard uses a handful of different time formats, and at this time, the plugin requires you to know this format and input the start and end values in this format. If there’s interest to sponsor this feature, in the future we may get the format directly from the web service description. The web service description is an XML document (see here for an example) which, among other information, contains a section that defines the format, default time and granularity of the time dimension.

add_raster

If we set the time step to 2 hours and click play, we will see that TimeManager renders each interval by querying the web map service for it, as you can see in this short video.

Querying the web service and waiting for the response takes some time. So, the plugin requires some patience for looking at this particular layer format in interactive mode. If we export the frames, however, we can get a nice result. This is an animation showing hurricane Katrina progressing over a 30 minute interval.

whoosh

If you want to sponsor further development of the Time Manager plugin, you can arrange a session with me – Karolina Alexiou – via Codementor.


QGIS on the rise with journalists

If you are following QGIS on Twitter you’ve probably noticed the increasing number of tweets by journalists using QGIS.

For example this map in the Financial Times by Hannah Dormido

or this one with overview maps and three different levels of details

or this map with semi-transparent label backgrounds and nice flag images

or even Time Manager animations by raoulranoa in the Los Angeles Times

I think this is a great development and a sign of how wide-spread QGIS usage is today.

If you know of any other examples or if you are a journalist using QGIS yourself, I’d love to see more!


Video tutorial: animated heatmaps with QGIS

Do you like the QGIS heatmap functionality? Did you know that QGIS can also create animated heatmaps?

The following video tutorial shows all necessary steps. To reproduce it, you can get the sample data from my Time Manager workshop at #QGIS2015.


Time Manager workshop at #QGIS2015

Today was the final day of #QGIS2015 the first joint QGIS conference and developer meeting. I had the pleasure to meet Time Manager co-developer Karolina Alexiou aka carolinux in person and give a talk including a hands-on workshop on Time Manager together. Time Manager makes it possible to explore spatio-temporal data by creating animations directly in QGIS.

The talk presents QGIS visualization tools with a focus on efficient use of layer styling to both explore and present spatial data. Examples include the recently added heatmap style as well as sophisticated rule-based and data-defined styles. The focus of this presentation is exploring and presenting spatio-temporal data using the Time Manager plugin. A special treat are time-dependent styles using expression-based styling which access the current Time Manager timestamp.

To download the example data and QGIS projects download Time_Manager_Examples.zip.


Trajectory animations with fadeout effect

Today’s post is a short tutorial for creating trajectory animations with a fadeout effect using QGIS Time Manager. This is the result we are aiming for:

The animation shows the current movement in pink which fades out and leaves behind green traces of the trajectories.

About the data

GeoLife GPS Trajectories were collected within the (Microsoft Research Asia) Geolife project by 182 users in a period of over three years (from April 2007 to August 2012). [1,2,3] The GeoLife GPS Trajectories download contains many text files organized in multiple directories. The data files are basically CSVs with 6 lines of header information. They contain the following fields:

Field 1: Latitude in decimal degrees.
Field 2: Longitude in decimal degrees.
Field 3: All set to 0 for this dataset.
Field 4: Altitude in feet (-777 if not valid).
Field 5: Date – number of days (with fractional part) that have passed since 12/30/1899.
Field 6: Date as a string.
Field 7: Time as a string.

Data prep: PostGIS

Since any kind of GIS operation on text files will be quite inefficient, I decided to load the data into a PostGIS database. This table of millions of GPS points can then be sliced into appropriate chunks for exploration, for example, a day in Beijing:

CREATE MATERIALIZED VIEW geolife.beijing 
AS SELECT trajectories.id,
    trajectories.t_datetime,
    trajectories.t_datetime + interval '1 day' as t_to_datetime,
    trajectories.geom,
    trajectories.oid
   FROM geolife.trajectories
   WHERE st_dwithin(trajectories.geom,
           st_setsrid(
             st_makepoint(116.3974589, 
                           39.9388838), 
             4326), 
           0.1) 
   AND trajectories.t_datetime >= '2008-11-11 00:00:00'
   AND trajectories.t_datetime < '2008-11-12 00:00:00'
WITH DATA

Trajectory viz: a fadeout effect for point markers

The idea behind this visualization is to show both the current movement as well as the history of the trajectories. This can be achieved with a fadeout effect which leaves behind traces of past movement while the most recent positions are highlighted to stand out.

Map tiles by Stamen Design, under CC BY 3.0. Data by OpenStreetMap, under ODbL.

Map tiles by Stamen Design, under CC BY 3.0. Data by OpenStreetMap, under ODbL.

This effect can be created using a Single Symbol renderer with a marker symbol with two symbol layers: one layer serves as the highlights layer (pink) while the second layer represents the traces (green) which linger after the highlights disappear. Feature blending is used to achieve the desired effect for overlapping markers.

Screenshot 2015-05-06 23.52.40

The highlights layer has two expression-based properties: color and size. The color fades to white and the point size shrinks as the point ages. The age can be computed by comparing the point’s t_datetime timestamp to the Time Manager animation time $animation_datetime.

This expression creates the color fading effect:

color_hsv(  
  311,
  scale_exp( 
    minute(age($animation_datetime,"t_datetime")),
    0,60,
    100,0,
    0.2
  ),
  90
)

and this expression makes the point size shrink:

scale_exp( 
  minute(age($animation_datetime,"t_datetime")),
  0,60,
  24,0,
  0.2
)

Outlook

I’m currently preparing this and a couple of other examples for my Time Manager workshop at the upcoming 1st QGIS conference in Nødebo. The workshop materials will be made available online afterwards.

Literature

[1] Yu Zheng, Lizhu Zhang, Xing Xie, Wei-Ying Ma. Mining interesting locations and travel sequences from GPS trajectories. In Proceedings of International conference on World Wild Web (WWW 2009), Madrid Spain. ACM Press: 791-800.
[2] Yu Zheng, Quannan Li, Yukun Chen, Xing Xie, Wei-Ying Ma. Understanding Mobility Based on GPS Data. In Proceedings of ACM conference on Ubiquitous Computing (UbiComp 2008), Seoul, Korea. ACM Press: 312-321.
[3] Yu Zheng, Xing Xie, Wei-Ying Ma, GeoLife: A Collaborative Social Networking Service among User, location and trajectory. Invited paper, in IEEE Data Engineering Bulletin. 33, 2, 2010, pp. 32-40.


Time Manager 1.6 – now with feature interpolation

Over the last couple of weeks, Karolina has been very busy improving and expanding Time Manager. This post is to announce the 1.6 release of Time Manager which brings you many fixes and exciting new features.

Screenshot 2015-03-25 17.58.38

What’s this feature interpolation you’re talking about?

Interpolation is really helpful if you have multiple observations of the same (moving) real-world object at different points in time and you want to visualize the movement between the observations. This can be used to visualize animal paths, vehicle tracks, or any other movement in space.

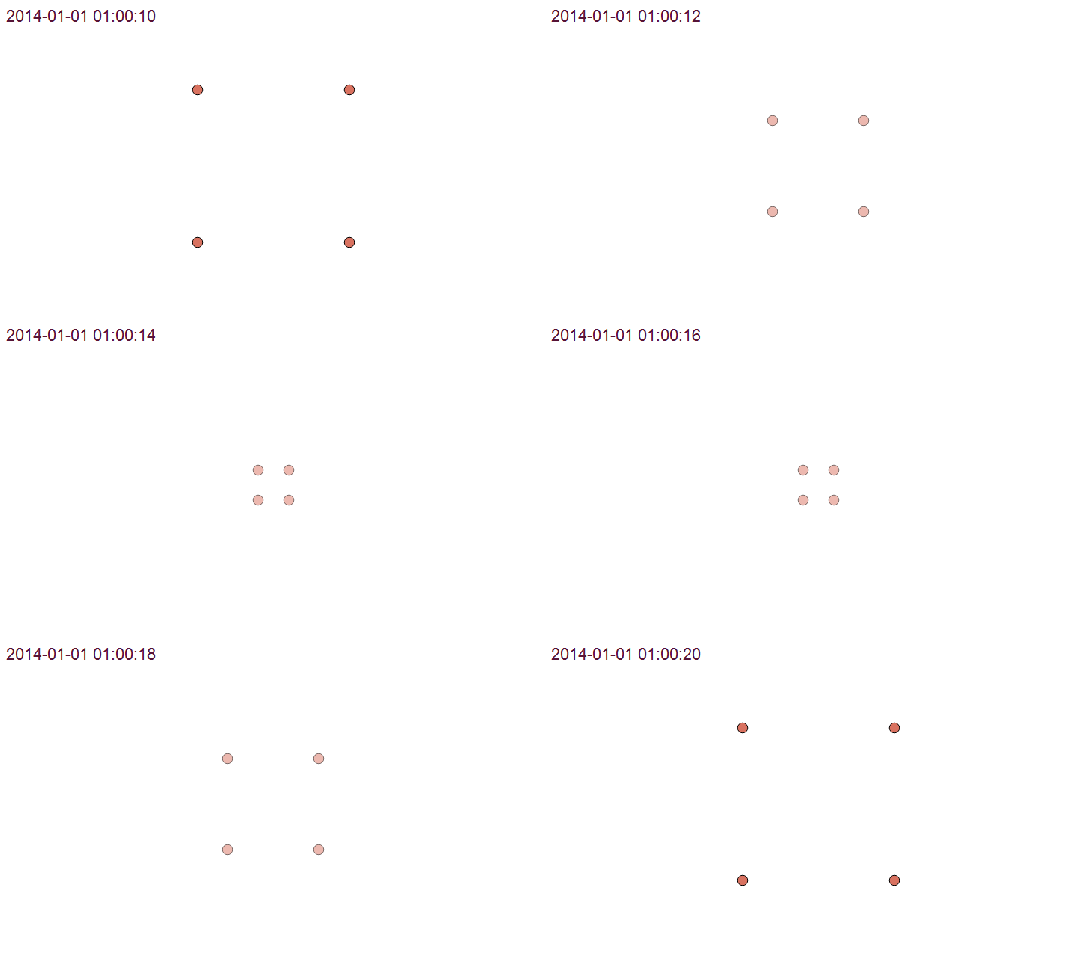
The following example shows a simple layer which contains 12 point features (3 for each id value).

Screenshot 2015-03-25 17.50.55

Using Time Manager interpolation, it is easy to create animations with interpolated positions between observations:

animation

How is it done?

When you open the Time Manager 1.6 Settings | Add layer dialog, you will find a new option for interpolation settings. This first version supports linear interpolation of point features but more options might be added in the future. Note how the id attribute is specified to let Time Manager know which features belong to the same real-world object.

Screenshot 2015-03-25 17.43.08

For the interpolation, Time Manager creates a new layer which contains the interpolated features. You can see this layer in the layer list.

Screenshot 2015-03-25 17.46.13

I’m really looking forward to seeing all the great animations this feature will enable. Thanks Karolina for making this possible!


Exploring Mobility Data Using Time Manager

Data from various vehicles is collected for many purposes in cities worldwide. To get a feeling for just how much data is available, I created the following video using QGIS Time Manager which has been shown at the Austrian Museum of Applied Arts “MADE 4 YOU – Design for Change”. It shows one hour of taxi tracks in the city of Vienna:

If you like the video, please go to http://www.ertico.com/2012-its-video-competition-open-vote and vote for it in the category “Videos directed at the general public”.


Space-Time Cubes – Exploring Twitter Streams III

This post continues my quest of exploring the spatial dimension of Twitter streams. I wanted to try one of the classic spatio-temporal visualization methods: Space-time cubes where the vertical axis represents time while the other two map space. Like the two previous examples, this visualization is written in pyprocessing, a Python port of the popular processing environment.

This space-time cube shows twitter trajectories that contain at least one tweet in New York Times Square. The 24-hour day starts at the bottom of the cube and continues to the top. Trajectories are colored based on the time stamp of their start tweet.

Additionally, all trajectories are also drawn in context of the coastline (data: OpenStreetMap) on the bottom of the cube.

While there doesn’t seem to be much going on in the early morning hours, we can see quite a busy coming and going during the afternoon and evening. From the bunch of vertical lines over Times Square, we can also assume that some of our tweet authors spent a considerable time at and near Times Square.

I’ve also created an animated version. Again, I recommend to watch it in HD.


Adding Raster Layer Support to Time Manager

So far, Time Manager has been limited to vector layers. Support for raster layers has been on the wish list for quite a while. I’ve been considering different approaches and for now I have settled with one that keeps the way how raster layers work as close to the workings of vector layers as possible:

All layers have to be loaded before they can be added to Time Manager. The layers are added one-by-one and start and end time values are defined. (This differs from vector layers where start/end attribute are defined instead.) All raster layers that are not within the current time frame are set to 100 % transparency.

I’m not certain yet whether this is a good approach though. I’ll probably keep trying different approaches for a while.

This is a screen cast of the current status:

The plugin source is available on Github, as usual. It’s still going to take a while until there will be a plugin package including this feature.

I’m looking forward to reading your comments here or on Youtube. Do you think this approach is usable?


Nice Animations with Time Manager’s Offset Feature

You probably know this video from my previous post “Tweets to QGIS”. Today, I want to show you how it is done.

After importing the Twitter JSON file, I saved it as a Shapefile.
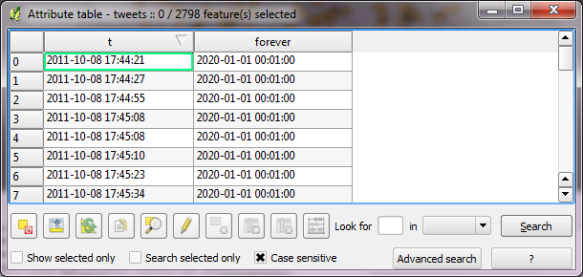
Every point in the Shapefile contains the timestamp of the tweet. Additionally, I added a second field called “forever” which will allow me to configure Time Manager to show features permanently.

A "forever" field will help with showing features permanently.

To create the flash effect you see in the video, we load the tweet Shapefile three times. Every layer gets a different role and style in the final animation:

  • Layer “start_flash” is a medium sized dot that marks the appearance of a new tweet.
  • Layer “big_flash” is a bigger dot of the same color which will appear after “start_flash”.
  • Layer “permanent” is a small dot that will be visible even after the flash vanishes.
Three layers with different styles will make the animation more interesting.

styling the tweet layers

We’ll plan the final animation with a time step size of 10 seconds. That means that every animation frame will cover a real-world timespan of 10 seconds.

We configure Time Manager by adding all three tweet layers:
Layer “start_flash” starts at the orginal time t. Layer “big_flash” gets an offset of -10 seconds, which means that it will display ten seconds after time t. Layer “permanent” gets an offset of -20 seconds and ends at time forever.

Layers can be timed using the "offset" feature.

Finally – in Time Manager dock – we can start the animation with a time step size of 10 seconds:

Use a time step size of 10 seconds so it fits to the offset values we specified earlier.

Besides watching the animation inside QGIS, Time Manager also enables you to export the animation to an image series using “Export Video” button. Actual video export is not implemented yet, but you can use mencoder on the resulting image series to create a video file:

mencoder "mf://*.PNG" -mf fps=10 -o output.avi -ovc lavc -lavcopts vcodec=mpeg4

Time offsets are a new feature in version 0.4 of Time Manager. You can get it directly from the project SVN and soon from the official QGIS repo.


  • <<
  • Page 3 of 4 ( 63 posts )
  • >>
  • spatio-temporal data

Back to Top

Sustaining Members