Related Plugins and Tags

QGIS Planet

Five new awesomely awesome QGIS features - Round 2

As QGIS is such a fast moving project I have decided to make this a regular blog post in order to highlight some new features added to QGIS. If you haven't already, don't forget to check out round one.

Remember that some of these features may still only be new which might change between now and the next official released version. With that out of the way lets get listing.

Atlas integration

If you are a regular user of QGIS Python plugins, and who isn't, then you would have used the awesome Atlas plugin developed by Vincent Picavet. This great tool can be used to generate mapbooks, or an atlas as some people like to say, using a coverage layer and a print composer. What makes this even more awesome is that it is now built into the print composer.

Something descriptive

The builtin atlas function also gives you the ability to use an expression to do runtime text replacement, including access to all the fields on the coverage layer.  The coverage layer doesn't even have to be a region layer, it can be a simple point layer, or even a line layer.   You can see the result of me running the atlas generation from the above example here

Big thanks to Oslandia for integrating this great feature, and the companies sponsoring the work.

New Python console

This new addition comes from the great work that Salvatore Larosa has been doing to add a better Python console to QGIS.

The new Python console includes attribute auto complete, syntax highlighting, better copy and paste, uploading to codepad, the ability to run code from a file, etc.  You don't realise how much difference there is until you go back to using the old one in version 1.8.

New Python console

Tabbed and groups in builtin forms

One of the things I really loved about QGIS, coming from MapInfo, was the builtin forms.  Just having the ability to enter data using controls like combo boxes, calendar widgets, etc makes you one step closer to having better data.   This feature is the exact reason I setup a 67 year old for kerb data collection.

As good as they are the builtin forms have an issue of ending up with as a big scrolling list with lots of fields; also the lack of  the ability to group or put fields on tabs in the UI meant you had to create a custom form.  Well not any more.

http://woostuff.files.wordpress.com/2012/11/fields.png

There is now a combo box on the Fields tab that allows you to build a generated form but also add tabs and group boxes.  You can even have the same field shown more then once on the form, handy for something like an ID field that you would like to show on each tab.

http://woostuff.files.wordpress.com/2012/11/tabs.png

With this new ability the builtin forms can get me 95% of the way for data entry jobs, the other 5% I just make a custom form - but that is very rare.

Sextante

Sextante is a great and powerful analytical framework that has been added to the core of QGIS thanks to Victor Olaya.  This is not a feature that I use a lot but this is only due to most of my work being in development and not analysis, however that doesn't mean that it's not a really cool feature.

One of the greatest things about the Sextante toolbox is that it allows you to integrate other great open source tools like GRASS, SAGA, R, OTB, etc, right into your QGIS workflow and view the results in the canvas. It even includes a modeller so that you can build a connected diagram of all the bits of your process, even if it crosses between programs.

http://woostuff.files.wordpress.com/2012/11/sextante.png

For me what is even better is that you can use Sextante in your plugins or custom Python code.  Sextante has a Python interface - well the whole thing is written in Python - that you can use to run a Sextante supported algorithm.

import sextante
outputs_0=sextante.runalg("grass:v.crossbones", /file, 0, ,, 1, 2, 3, 4, 1=3.0,2=8.0,5=6.0,8=6.0,11=6.0,14=6.0, None)
outputs_1=sextante.runalg("grass:v.delaunay", outputs_0['output'], True, True, None)
outputs_2=sextante.runalg("grass:v.dissolve", outputs_0['output'], , None)

Victor has created a blog to cover some Sextante recipes at QGIS-SEXTANTE cookbook/. There are also some really cool example of Sextante in use at:

Massive amount of composer additions

This last feature, or rather feature set,  comes from the sponsorship and support of the World BankAustralia-Indonesia Facility for Disaster Reduction, Geoscience Australia and the GFDRR.  Most of this work was done to aid in the development of a new QGIS plugin called inaSAFE, which has also received some great praise

“(InaSAFE) is very beneficial for all of us. It’s a good example of our partnership.” Dr Susilo Bambang Yudhoyono - President of Indonesia

Some of the improvements include:

  • A new loadFromTemplate method, in the API, that can do text replacement in the QGIS composer template.

  • Better support for EPSG:4326 scale bars

  • Multipage in one composer

  • Automatic overview frame in map frame

  • HTML frame

  • Zebra style grid frame border

  • More control of grid labels. Inside, outside, disabled

  • etc, etc

http://woostuff.files.wordpress.com/2012/11/composer.png

These are great additions to the QGIS composer and I have already used the overview frame feature along with the new atlas integration  to make some quick nice looking map books. \

A huge thanks to the World BankAustralia-Indonesia Facility for Disaster ReductionGeoscience Australia and the GFDRR, and all the developers included.

You can see some of the output that InaSAFE generates using some of these new features at http://quake.linfiniti.com/

P.S The World Bank also sponsored the new raster Save As.. ability just like we have for vector layers.

New version of (dutch) pdokservicesplugin

Sorry, this entry is only available in the Dutch language

Graduated symbols

Graduated symbols are the best way to visualize absolute numbers like population size. Usually the area of the symbols is made proportional with the number to be displayed. This is especially important if the values are far apart. Methods QGIS 1.8 offers four methods to display graduated symbols. All can be found in the dialogue [...]

FOSS4G-AU in summary

Last Thursday and Friday was our first local Australian FOSS4G event which was hosted at the CSRIO building in Brisbane.  Very big thanks to CSRIO for hosting the event.  The venue was setup perfectly for  hosting an event like this, including dual projectors for presenting, video calls over to Perth, etc.

https://lh6.googleusercontent.com/-3Azxik6K-vs/UKowdDllYWI/AAAAAAAABTk/NIP1Tt2i3zc/s989/DSC06009.JPG

The first day was done using a un-conference style of event. This is the first time I've been to a un-conference and I liked the format a lot.   Once everyone was there on the first morning we collected ideas from people and everyone voted on which ones they would like to see.  After we had picked enough topics Shaun and I made a program for the day and we started.

Topics included:

https://lh3.googleusercontent.com/-uh5UpmppklU/UKowJ0Lq4AI/AAAAAAAABVg/1dzNncFbZjc/s786/DSC06001.JPG

The second day was a code sprint.  I worked on converting a MapBasic scripts from one of the guys to QGIS, and Jody enlisted the others to help check the headers of the GeoServer project so that it can finally pass OSGeo incubation.

https://lh6.googleusercontent.com/-3Azxik6K-vs/UKowdDllYWI/AAAAAAAABTk/NIP1Tt2i3zc/s989/DSC06009.JPG

Overall I think it was a very successful event.  I would like to make these a yearly event if we can, provided that we have people to talk, or projects to work on.

More information about up coming OSGeo events in Australia and New Zealand can be found at http://www.meetup.com/osgeo-aust-nz/

FOSS4G-AU in summary

Last Thursday and Friday was our first local Australian FOSS4G event which was hosted at the CSRIO building in Brisbane.  Very big thanks to CSRIO for hosting the event.  The venue was setup perfectly for  hosting an event like this, including dual projectors for presenting, video calls over to Perth, etc.

The first day was done using a un-conference style of event. This is the first time I’ve been to a un-conference and I liked the format a lot.   Once everyone was there on the first morning we collected ideas from people and everyone voted on which ones they would like to see.  After we had picked enough topics Shaun and I made a program for the day and we started.

Topics included:

Me presenting QMap

The second day was a code sprint.  I worked on converting a MapBasic scripts from one of the guys to QGIS, and Jody enlisted the others to help check the headers of the GeoServer project so that it can finally pass OSGeo incubation.

Overall I think it was a very successful event.  I would like to make these a yearly event if we can, provided that we have people to talk, or projects to work on.

More information about up coming OSGeo events in Australia and New Zealand can be found at http://www.meetup.com/osgeo-aust-nz/


Filed under: Open Source, qgis Tagged: FOSSGIS, gis, Open Source, open source gis, osgeo, qgis, Quantum GIS

FOSS4G-AU in summary

  • Open Source
  • qgis tags:
  • FOSSGIS
  • gis
  • Open Source
  • open source gis
  • osgeo
  • qgis
  • Quantum GIS

Last Thursday and Friday was our first local Australian FOSS4G event which was hosted at the CSRIO building in Brisbane.  Very big thanks to CSRIO for hosting the event.  The venue was setup perfectly for  hosting an event like this, including dual projectors for presenting, video calls over to Perth, etc.

Alt Text

The first day was done using a un-conference style of event. This is the first time I've been to a un-conference and I liked the format a lot.   Once everyone was there on the first morning we collected ideas from people and everyone voted on which ones they would like to see.  After we had picked enough topics Shaun and I made a program for the day and we started.

Topics included:

Alt Text

The second day was a code sprint.  I worked on converting a MapBasic scripts from one of the guys to QGIS, and Jody enlisted the others to help check the headers of the GeoServer project so that it can finally pass OSGeo incubation.

Alt Text

Overall I think it was a very successful event.  I would like to make these a yearly event if we can, provided that we have people to talk, or projects to work on.

More information about up coming OSGeo events in Australia and New Zealand can be found at http://www.meetup.com/osgeo-aust-nz/

FOSS4G-AU in summary

Last Thursday and Friday was our first local Australian FOSS4G event which was hosted at the CSRIO building in Brisbane.  Very big thanks to CSRIO for hosting the event.  The venue was setup perfectly for  hosting an event like this, including dual projectors for presenting, video calls over to Perth, etc.

https://lh6.googleusercontent.com/-3Azxik6K-vs/UKowdDllYWI/AAAAAAAABTk/NIP1Tt2i3zc/s989/DSC06009.JPG

The first day was done using a un-conference style of event. This is the first time I've been to a un-conference and I liked the format a lot.   Once everyone was there on the first morning we collected ideas from people and everyone voted on which ones they would like to see.  After we had picked enough topics Shaun and I made a program for the day and we started.

Topics included:

https://lh3.googleusercontent.com/-uh5UpmppklU/UKowJ0Lq4AI/AAAAAAAABVg/1dzNncFbZjc/s786/DSC06001.JPG

The second day was a code sprint.  I worked on converting a MapBasic scripts from one of the guys to QGIS, and Jody enlisted the others to help check the headers of the GeoServer project so that it can finally pass OSGeo incubation.

https://lh6.googleusercontent.com/-3Azxik6K-vs/UKowdDllYWI/AAAAAAAABTk/NIP1Tt2i3zc/s989/DSC06009.JPG

Overall I think it was a very successful event.  I would like to make these a yearly event if we can, provided that we have people to talk, or projects to work on.

More information about up coming OSGeo events in Australia and New Zealand can be found at http://www.meetup.com/osgeo-aust-nz/

Improving Population Density Maps Using Dasymetric Mapping

Yesterday, I described my process to generate a basic population density map from the city of Vienna’s open government data. In the end of that post, I described some ideas for further improvement. Today, I want to follow-up on those ideas using what is known as dasymetric mapping. GIS Dictionary defines it well (much better than Wikipedia):

Dasymetric mapping is a technique in which attribute data that is organized by a large or arbitrary area unit is more accurately distributed within that unit by the overlay of geographic boundaries that exclude, restrict, or confine the attribute in question.
For example, a population attribute organized by census tract might be more accurately distributed by the overlay of water bodies, vacant land, and other land-use boundaries within which it is reasonable to infer that people do not live.

That’s exactly what I want to do: Based on subdistricts with population density values and auxiliary data – Corine Land Cover to be exact – I want to create an improved representation of population density within the city.

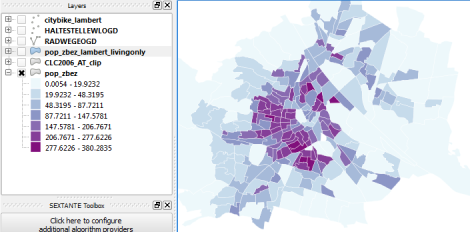
This is the population density map I start out with:

… and this is the Corine Land Cover dataset for the same area:

It shows built-up areas (red), parks and natural areas (green) as well as water-covered regions (blue). For further analysis, I follow the assumption that people only live in areas with Corine code 111 “Continuous urban fabric” and 112 “Discontinuous urban fabric”. Therefore, I use the Intersection tool to clip only these residential areas from the subdistrict polygons. The subdistrict population can now be distributed over these new, smaller areas (use Field Calculator) to create a more realistic visualization of population density:

For easier comparison, I put the original density and the dasymetric map into a looping animation. Some subdistricts change their population density values quite drastically, especially in regions where big parts covered by water or rail infrastructure were removed:

Corine Land Cover is not too detailed but I think it still usable on this scale. One thing to note is that I used data from 2006 with population data from 2012 so some areas in the outer districts will have been turned residential in the meantime. But I hope this doesn’t distort the overall picture too much.


Mapping OGDWien Population Density

The city of Vienna provides both subdistrict geometries and population statistics. Mapping the city’s population density should be straightforward, right? Let’s see …

We should be able to join on ZBEZ and SUB_DISTRICT_CODE, check! But what about the actual population counts? Unfortunately, there is no file which simply lists population per subdistrict. The file I found contains four lines for each subdistrict: females 2011, males 2011, females 2012 and males 2012. That’s not the perfect format for mapping general population density.

A quick way to prepare our input data is applying pivot tables, eg. in Open Office: The goal is to have one row per subdistrict and columns for population in 2011 and 2012:

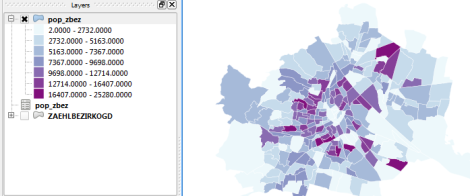
Export as CSV, add CSVT and load into QGIS. Finally, we can join geometries and CSV table:

A quick look at the joined data confirms that each subdistrict now has a population value. But visualizing absolute values results in misleading maps. Big subdistricts with only average density will overrule smaller but much denser subdistricts:

That’s why we need to calculate population density. This is easy to do using Field Calculator. The subdistrict file already contains area values but even if they were missing, we could calculate it using the $area operator: "pop2012" / ($area / 10000). The resulting population density in population per ha finally shows which subdistricts are the most densely populated:

One could argue that this is still no accurate representation of population density: Big parts of some subdistricts are actually covered by water – especially along the Danube – and therefore uninhabited. There are also big parks which could be excluded from the subdistrict area. But that’s going to be the topic of another post.

If you want to use my results so far, you can download the GeoJSON file from Github.


Australian FOSS4G is here

So that came around quick.  Seems it is November already.

Tomorrow is the FOSS4G-Au a locally organized un-conference.

How do I register?

If you would still like to come - which you should - you can register here (it's free!) http://www.meetup.com/osgeo-aust-nz/events/83965312/ but you must RSVP on the meetup page in order to get building access and internet access.

Where is it at? (Directions)

The un-conference is held at The Queensland Centre for Advanced Technologies in Brisbane. Kudos to CSIRO for allowing us to use their facilities.

More details on un-conference?

Jody Garnett has also done a post on the un-conference and what this kind of conference style is like.  You can find more details here: http://how2map.blogspot.com.au/2012/11/foss4g-au-tomorrow.html 

http://woostuff.files.wordpress.com/2012/11/p1000872.jpg

Australian FOSS4G is here

So that came around quick.  Seems it is November already.

Tomorrow is the FOSS4G-Au a locally organized un-conference.

How do I register?

If you would still like to come – which you should – you can register here (it’s free!) http://www.meetup.com/osgeo-aust-nz/events/83965312/ but you must RSVP on the meetup page in order to get building access and internet access.

Where is it at? (Directions)

The un-conference is held at The Queensland Centre for Advanced Technologies in Brisbane. Kudos to CSIRO for allowing us to use their facilities.

More details on un-conference?

Jody Garnett has also done a post on the un-conference and what this kind of conference style is like.  You can find more details here: http://how2map.blogspot.com.au/2012/11/foss4g-au-tomorrow.html 

The venue


Filed under: Open Source, qgis Tagged: foss4g, FOSSGIS, Open Source, OSS, qgis

Australian FOSS4G is here

  • Open Source
  • qgis tags:
  • foss4g
  • FOSSGIS
  • Open Source
  • OSS
  • qgis

So that came around quick.  Seems it is November already.

Tomorrow is the FOSS4G-Au a locally organized un-conference.

How do I register?

If you would still like to come - which you should - you can register here (it's free!) http://www.meetup.com/osgeo-aust-nz/events/83965312/ but you must RSVP on the meetup page in order to get building access and internet access.

Where is it at? (Directions)

The un-conference is held at The Queensland Centre for Advanced Technologies in Brisbane. Kudos to CSIRO for allowing us to use their facilities.

More details on un-conference?

Jody Garnett has also done a post on the un-conference and what this kind of conference style is like.  You can find more details here: http://how2map.blogspot.com.au/2012/11/foss4g-au-tomorrow.html 

Alt Text

Australian FOSS4G is here

So that came around quick.  Seems it is November already.

Tomorrow is the FOSS4G-Au a locally organized un-conference.

How do I register?

If you would still like to come - which you should - you can register here (it's free!) http://www.meetup.com/osgeo-aust-nz/events/83965312/ but you must RSVP on the meetup page in order to get building access and internet access.

Where is it at? (Directions)

The un-conference is held at The Queensland Centre for Advanced Technologies in Brisbane. Kudos to CSIRO for allowing us to use their facilities.

More details on un-conference?

Jody Garnett has also done a post on the un-conference and what this kind of conference style is like.  You can find more details here: http://how2map.blogspot.com.au/2012/11/foss4g-au-tomorrow.html 

http://woostuff.files.wordpress.com/2012/11/p1000872.jpg

User defined expression functions for QGIS

Ever since I added expression based labels, including the new expression builder UI, something that I always wanted to add is the ability to define custom user defined functions in Python (or C++) and use them in an expression. The expression engine is used for labels, rule based rendering, layer actions, field calculator, and atlas composer tags.  Thanks to the all the awesome work on the expression engine by Martin all this cool stuff is now possible.

Today I pushed a commit into master that adds the ability to define a function in Python (or C++), register it in the expression engine, then use it anywhere expressions are used.

The good stuff

Lets take a use case from Ujaval Gandhi and his example of counting vertices for each feature.

First we need to import the new qgsfunction decorator function from qgis.utils. The qgsfunction decorator will take a normal Python function, wrap it up in the class used to define a function, and register it in the engine.

So what does an empty function look like:

from qgis.utils import qgsfunction
from qgis.core import QGis

@qgsfunction(0, "Python")
def vertices(values, feature, parent):
    pass

@qgsfunction(0, "Python") means we are defining a new vertices function that takes 0 args and lives in the "python" group in the expression builder UI. Any custom function must take (values, feature, parent) as python args. values is a list of QVariants passed into the function, feature is the current QgsFeature, and parent is expression engine node (you use this to raise errors).

Lets stick some more logic in there:

from qgis.utils import qgsfunction
from qgis.core import QGis

@qgsfunction(0, "Python")
def vertices(values, feature, parent):
    """
       Returns the number of vertices for a features geometry
   """
    count = None
    geom = feature.geometry()
    if geom is None: return None
    if geom.type() == QGis.Polygon:
        count = 0
        if geom.isMultipart():
          polygons = geom.asMultiPolygon()
        else:
          polygons = [ geom.asPolygon() ]
        for polygon in polygons:
          for ring in polygon:
            count += len(ring)
    return count

Pretty simple. Get the geometry from the feature, check if it's a polygon, if it is then count the number of vertices and return that number.

Now that we have that all done we can save it into a file in our .qgis/python folder, lets call it userfunctions.py (note you don't have to save it here, anywhere that QGIS can find it will do.  Anywhere on PATH)

Lets open QGIS and run import userfunctions.py:

http://woostuff.files.wordpress.com/2012/11/import.png

Now open the label properties for the layer:

http://woostuff.files.wordpress.com/2012/11/expression.png

Nice! Notice also that the function doc string is used as the function help. How cool is that.  You can also see the $ sign in front of the function, this is because any functions that take no args are considered special and use the $ sign as a convention, this is all automatic when the function is registered.

And the result is:

http://woostuff.files.wordpress.com/2012/11/result.png

You can even use it in the rule based rendering:

http://woostuff.files.wordpress.com/2012/11/rules.png

Enjoy!

Notes

  • You must unregister a function once you are finished with it using QgsExpression.unregisterFunction(name). This mainly applies to plugins where the user might unload your plugin and the code is no longer available. In the above example we could import userfunctions and never unregister because we plan on using it for the whole session.

  • You can't override the built-in methods.

User defined expression functions for QGIS

Ever since I added expression based labels, including the new expression builder UI, something that I always wanted to add is the ability to define custom user defined functions in Python (or C++) and use them in an expression. The expression engine is used for labels, rule based rendering, layer actions, field calculator, and atlas composer tags.  Thanks to the all the awesome work on the expression engine by Martin all this cool stuff is now possible.

Today I pushed a commit into master that adds the ability to define a function in Python (or C++), register it in the expression engine, then use it anywhere expressions are used.

The good stuff

Lets take a use case from Ujaval Gandhi and his example of counting vertices for each feature.

First we need to import the new qgsfunction decorator function from qgis.utils. The qgsfunction decorator will take a normal Python function, wrap it up in the class used to define a function, and register it in the engine.

So what does an empty function look like:

from qgis.utils import qgsfunction
from qgis.core import QGis

@qgsfunction(0, "Python")
def vertices(values, feature, parent):
	pass

@qgsfunction(0, "Python") means we are defining a new vertices function that takes 0 args and lives in the “python” group in the expression builder UI. Any custom function must take (values, feature, parent) as python args. values is a list of QVariants passed into the function, feature is the current QgsFeature, and parent is expression engine node (you use this to raise errors).

Lets stick some more logic in there:

from qgis.utils import qgsfunction
from qgis.core import QGis

@qgsfunction(0, "Python")
def vertices(values, feature, parent):
	"""
		Returns the number of vertices for a features geometry
	"""
	count = None
	geom = feature.geometry()
	if geom is None: return None
	if geom.type() == QGis.Polygon:
		count = 0
		if geom.isMultipart():
		  polygons = geom.asMultiPolygon()
		else:
		  polygons = [ geom.asPolygon() ]
		for polygon in polygons:
		  for ring in polygon:
		    count += len(ring)
	return count

Pretty simple. Get the geometry from the feature, check if it’s a polygon, if it is then count the number of vertices and return that number.

Now that we have that all done we can save it into a file in our .qgis/python folder, lets call it userfunctions.py (note you don’t have to save it here, anywhere that QGIS can find it will do.  Anywhere on PATH)

Lets open QGIS and run import userfunctions.py:

Importing functions from userfunctions.py

Now open the label properties for the layer:

The new function shown in the expression builder

Nice! Notice also that the function doc string is used as the function help. How cool is that.  You can also see the $ sign in front of the function, this is because any functions that take no args are considered special and use the $ sign as a convention, this is all automatic when the function is registered.

And the result is:

The label using the new function

You can even use it in the rule based rendering:

Rule rendering using new function

Enjoy!

Notes

  • You must unregister a function once you are finished with it using QgsExpression.unregisterFunction(name). This mainly applies to plugins where the user might unload your plugin and the code is no longer available. In the above example we could import userfunctions and never unregister because we plan on using it for the whole session.
  • You can’t override the built-in methods.

Filed under: Open Source, qgis Tagged: FOSSGIS, gis, Open Source, OSS, qgis, Quantum GIS

'User defined expression functions for QGIS '

  • Open Source
  • qgis tags:
  • FOSSGIS
  • gis
  • Open Source
  • OSS
  • qgis
  • Quantum GIS

Ever since I added expression based labels, including the new expression builder UI, something that I always wanted to add is the ability to define custom user defined functions in Python (or C++) and use them in an expression. The expression engine is used for labels, rule based rendering, layer actions, field calculator, and atlas composer tags.  Thanks to the all the awesome work on the expression engine by Martin all this cool stuff is now possible.

Today I pushed a commit into master that adds the ability to define a function in Python (or C++), register it in the expression engine, then use it anywhere expressions are used.

The good stuff

Lets take a use case from Ujaval Gandhi and his example of counting vertices for each feature.

First we need to import the new qgsfunction decorator function from qgis.utils. The qgsfunction decorator will take a normal Python function, wrap it up in the class used to define a function, and register it in the engine.

So what does an empty function look like:

from qgis.utils import qgsfunction
from qgis.core import QGis

@qgsfunction(0, "Python")
def vertices(values, feature, parent):
    pass

@qgsfunction(0, "Python") means we are defining a new vertices function that takes 0 args and lives in the "python" group in the expression builder UI. Any custom function must take (values, feature, parent) as python args. values is a list of QVariants passed into the function, feature is the current QgsFeature, and parent is expression engine node (you use this to raise errors).

Lets stick some more logic in there:

from qgis.utils import qgsfunction
from qgis.core import QGis

@qgsfunction(0, "Python")
def vertices(values, feature, parent):
    """
        Returns the number of vertices for a features geometry
    """
    count = None
    geom = feature.geometry()
    if geom is None: return None
    if geom.type() == QGis.Polygon:
        count = 0
        if geom.isMultipart():
          polygons = geom.asMultiPolygon()
        else:
          polygons = [ geom.asPolygon() ]
        for polygon in polygons:
          for ring in polygon:
            count += len(ring)
    return count

Pretty simple. Get the geometry from the feature, check if it's a polygon, if it is then count the number of vertices and return that number.

Now that we have that all done we can save it into a file in our .qgis/python folder, lets call it userfunctions.py (note you don't have to save it here, anywhere that QGIS can find it will do.  Anywhere on PATH)

Lets open QGIS and run import userfunctions.py:

Alt Text

Now open the label properties for the layer:

Alt Text

Nice! Notice also that the function doc string is used as the function help. How cool is that.  You can also see the $ sign in front of the function, this is because any functions that take no args are considered special and use the $ sign as a convention, this is all automatic when the function is registered.

And the result is:

Alt Text

You can even use it in the rule based rendering:

Alt Text

Enjoy!

Notes

  • You must unregister a function once you are finished with it using QgsExpression.unregisterFunction(name). This mainly applies to plugins where the user might unload your plugin and the code is no longer available. In the above example we could import userfunctions and never unregister because we plan on using it for the whole session.

  • You can't override the built-in methods.

User defined expression functions for QGIS

Ever since I added expression based labels, including the new expression builder UI, something that I always wanted to add is the ability to define custom user defined functions in Python (or C++) and use them in an expression. The expression engine is used for labels, rule based rendering, layer actions, field calculator, and atlas composer tags.  Thanks to the all the awesome work on the expression engine by Martin all this cool stuff is now possible.

Today I pushed a commit into master that adds the ability to define a function in Python (or C++), register it in the expression engine, then use it anywhere expressions are used.

The good stuff

Lets take a use case from Ujaval Gandhi and his example of counting vertices for each feature.

First we need to import the new qgsfunction decorator function from qgis.utils. The qgsfunction decorator will take a normal Python function, wrap it up in the class used to define a function, and register it in the engine.

So what does an empty function look like:

from qgis.utils import qgsfunction
from qgis.core import QGis

@qgsfunction(0, "Python")
def vertices(values, feature, parent):
    pass

@qgsfunction(0, "Python") means we are defining a new vertices function that takes 0 args and lives in the "python" group in the expression builder UI. Any custom function must take (values, feature, parent) as python args. values is a list of QVariants passed into the function, feature is the current QgsFeature, and parent is expression engine node (you use this to raise errors).

Lets stick some more logic in there:

from qgis.utils import qgsfunction
from qgis.core import QGis

@qgsfunction(0, "Python")
def vertices(values, feature, parent):
    """
       Returns the number of vertices for a features geometry
   """
    count = None
    geom = feature.geometry()
    if geom is None: return None
    if geom.type() == QGis.Polygon:
        count = 0
        if geom.isMultipart():
          polygons = geom.asMultiPolygon()
        else:
          polygons = [ geom.asPolygon() ]
        for polygon in polygons:
          for ring in polygon:
            count += len(ring)
    return count

Pretty simple. Get the geometry from the feature, check if it's a polygon, if it is then count the number of vertices and return that number.

Now that we have that all done we can save it into a file in our .qgis/python folder, lets call it userfunctions.py (note you don't have to save it here, anywhere that QGIS can find it will do.  Anywhere on PATH)

Lets open QGIS and run import userfunctions.py:

http://woostuff.files.wordpress.com/2012/11/import.png

Now open the label properties for the layer:

http://woostuff.files.wordpress.com/2012/11/expression.png

Nice! Notice also that the function doc string is used as the function help. How cool is that.  You can also see the $ sign in front of the function, this is because any functions that take no args are considered special and use the $ sign as a convention, this is all automatic when the function is registered.

And the result is:

http://woostuff.files.wordpress.com/2012/11/result.png

You can even use it in the rule based rendering:

http://woostuff.files.wordpress.com/2012/11/rules.png

Enjoy!

Notes

  • You must unregister a function once you are finished with it using QgsExpression.unregisterFunction(name). This mainly applies to plugins where the user might unload your plugin and the code is no longer available. In the above example we could import userfunctions and never unregister because we plan on using it for the whole session.

  • You can't override the built-in methods.

  • <<
  • Page 94 of 142 ( 2821 posts )
  • >>

Back to Top

Sustaining Members