Related Plugins and Tags

QGIS Planet

MovingPandas v0.7 released!

The latest v0.7 release is now available from conda-forge.

New features include:

As always, all tutorials are available from the movingpandas-examples repository and on MyBinder:

How Mergin/Input sync changes in your QGIS projects

People often ask whether the Mergin service and the Input app can deal with multiple team members doing edits at the same time.

They happily find out that the answer is yes - it is one of the core features that greatly simplifies life of our users. In this post we will shed some light on how things work behind the scenes.

Mergin promo

Getting started

Let’s think of a simple project directory that needs to be synchronised between multiple desktop or mobile users, containing just two files:

  • a QGIS project file my-project.qgz that sets up map layers, styling, …
  • a GeoPackage file my-data.gpkg containing all GIS data

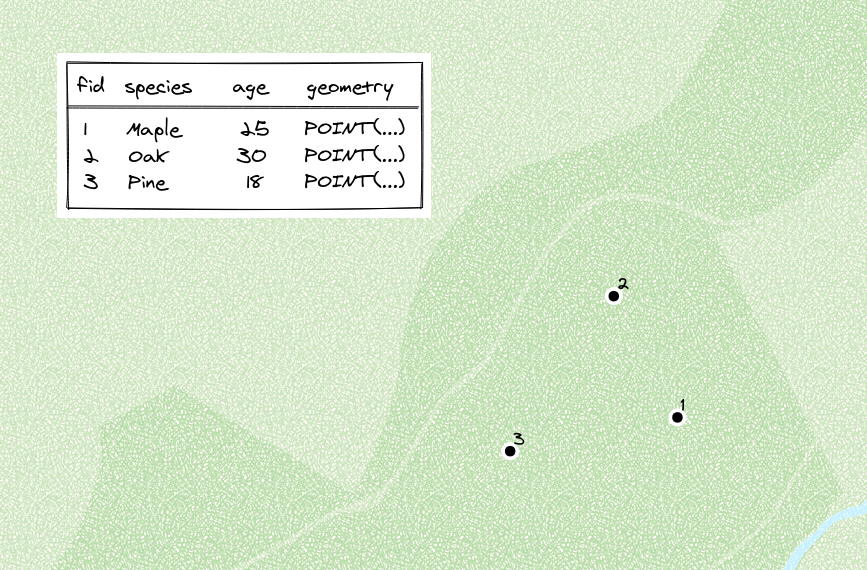
Our sample GIS data will contain a tree survey table, containing location, species and age of various trees:

tree survey table

When users edit data in my-data.gpkg, the traditional cloud storage solutions (such as Dropbox, Google Drive, Microsoft OneDrive and others) simply copy the modified files there. They do not understand the file content though - so if two people modify the same file, they have no way of knowing how to merge changes together. In the worse case, when two versions of the same file are uploaded, they keep just the version which was synchronised last. Or slightly better, they resort to creation of conflicting copies which need to be manually merged later. As one can imagine, merging and consolidating modifications from multiple GeoPackages back to one copy is a slow, tedious and error-prone job.

the Mergin service has been designed to understand spatial data, especially GeoPackages that are becoming the most popular format to store vector & attribute data. This is thanks to the open source geodiff library that we have developed while working on Mergin.

Synchronising data using “diffs”

The first trick is that synchronisation of GeoPackage files between Mergin server and clients (Input app, QGIS or other apps) only transfers actual changes in tables (“diffs” in technical jargon).

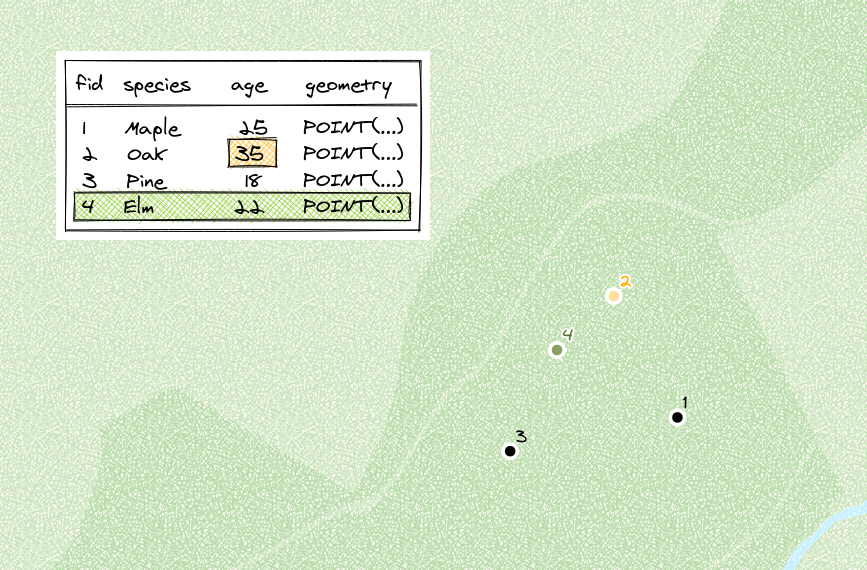
Our Mergin project with the tree survey has been prepared and downloaded by users. Jack did a field survey and he added or updated some rows in the survey table (changes highlighted in yellow and green):

Jack table

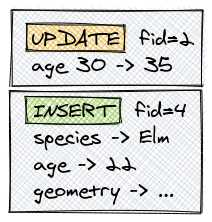
After pressing sync button, his changes are detected and uploaded to Mergin, encoded as a list of changes to the survey table:

Jack diff

Another user, Jill, also downloaded the tree survey project to her mobile device prior to Jack’s changes. When Jill synchronises the project to get the latest version, the changes as uploaded by Jack are downloaded and applied to her local copy of the project, getting the same data as seen by Jack.

At this point, the advantage of uploading/download only changes in tables may not seem obvious besides saving some network bandwidth… Read on to learn how this is used to support multi-user editing.

Merging changes from multiple users

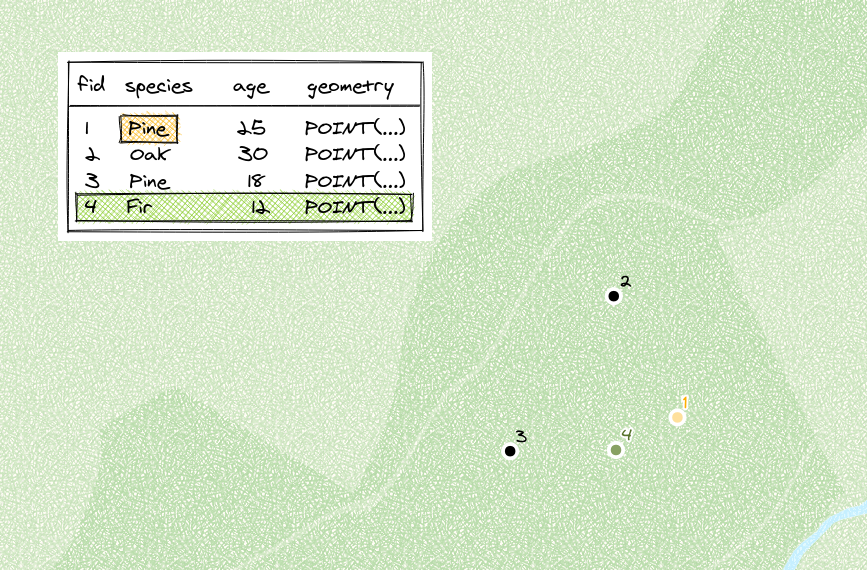
So far we have expected that Jill does not have any pending changes to sync, so that was easy. Now let’s assume that Jill has also done some changes on her device:

Jill table

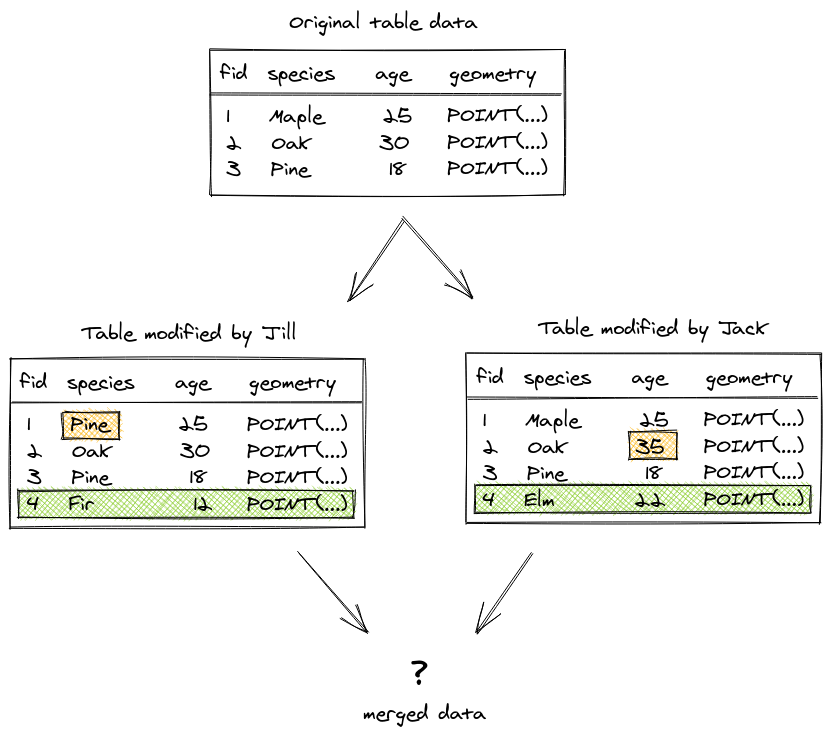
Here comes the more tricky part - how do we merge changes from Jack and Jill back to a single table:

Merging Jack and Jill table

In Mergin, cases that require merging changes from multiple users are handled by the “rebase” operation, a concept we have borrowed from version control systems for source code.

Let’s assume that Jack has synchronised his changes first. Later, when Jill synchronises her changes, a couple of things happen on her device before uploading the changes: Jill’s changes will be temporarily undone, Jack’s changes get applied, and finally Jill’s changes are re-applied after being rebased on top of Jack’s changes.

What does it mean to rebase someone’s changes? There are a couple of possible edit conflicts that could happen between rows of a database table with matching IDs (insert/insert, update/delete, delete/delete, update/update). These edit conflicts need to be resolved in order to be able to merge changes from multiple users.

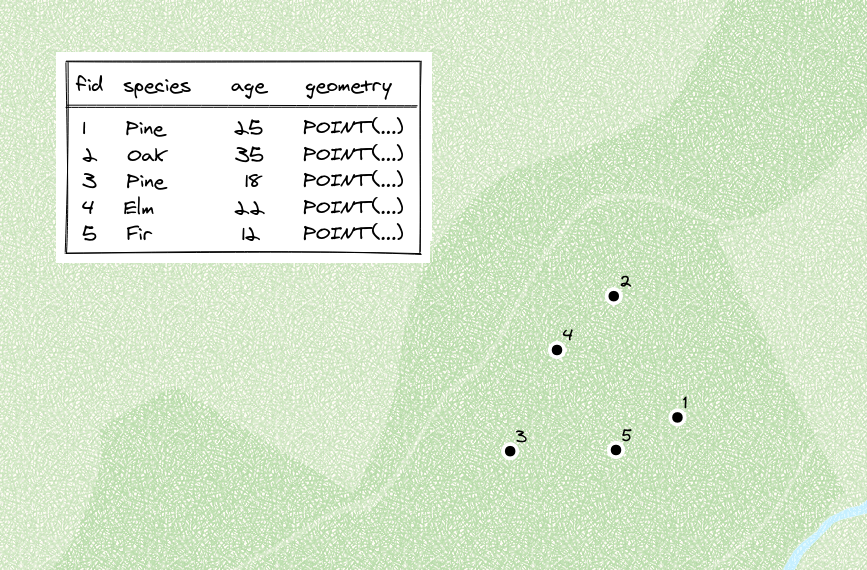
In our example, both Jack and Jill have added a row with ID = 4. This is not allowed, and therefore Jill’s new row ID will get changed to ID = 5 (any unused ID would do). As a result, here’s how the merged table will look at the end - combining changes of both users:

Final table

If both Jack and Jill modified the same row (the update/update edit conflict), we can only accept one edit automatically. The conflicting edit of the other user is written to a special conflict file and uploaded to Mergin, so no data gets lost, and the conflict can be later inspected by the project admin. Fortunately, this kind of conflict does not happen often if the survey work is well planned to avoid users simultaneously modifying the same features within the GeoPackage data.

What if conflict files appear

There are some cases when automatic merging is not supported. In those cases, Mergin is unable to find out details about changes in the data file(s) and has to resort to creation of a conflicting copy which gets uploaded to Mergin project along the original data file(s). In particular the problems may appear when:

  • Other format than GeoPackage is used for data storage (e.g. shapefiles)
  • Database or table structure is changed (e.g. adding new columns or new tables)

In the future, these limitation may be removed, but at this point it is good to keep them in mind.

If you plan to change structure of the survey tables and the project is already being used on multiple devices, it may be a good idea to create a new Mergin project with the modified database structure and instruct users to switch to the new project. Otherwise conflict files may start popping up as long as some users have older version of the project, adding more manual work to collate data.

You may also like...

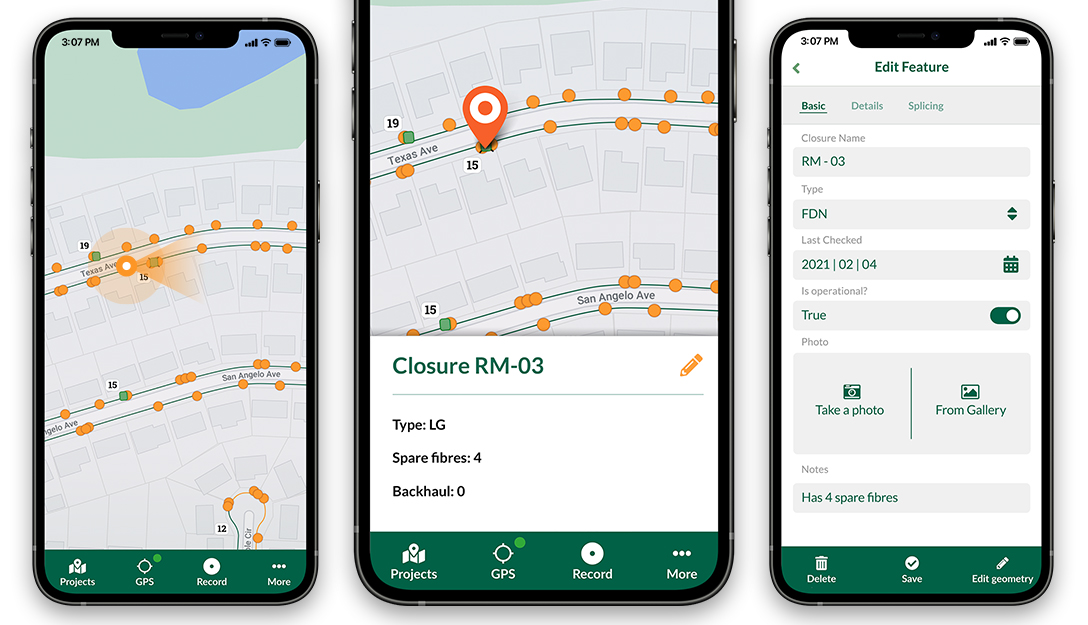
Mergin Maps, a field data collection app based on QGIS. Mergin Maps makes field work easy with its simple interface and cloud-based sync. Available on Android, iOS and Windows. Screenshots of the Mergin Maps mobile app for Field Data Collection
Get it on Google Play Get it on Apple store

QGIS Open Day – 26 March 2021

Dear QGIS Users

On Friday, 26 March 2021 we will be holding our monthly QGIS Open Day! What is a QGIS Open Day you may be wondering to yourself? It is an initiative to replace the wonderful community meetups we used to hold every six months when times were different. Like our in-person meetings, the event is organised on the principle of self-organisation and community participation.

Programme

  • QGIS INTEGRATED (The open day that shows QGIS working as part of an ecosystem with other software and programs to create dynamic and shareable spatial data, maps, and systems)

Where to watch

Please see the event wiki page at QHF-March-2021 Wiki for all the details of times and links for participation.

Recordings

All of the YouTube live-streamed events will be recorded and made available to users who couldn’t make the live events. YouTube live streams sometimes take 24 hours to be available for catch-up viewing. Be sure to check back here for updates!

Code of Conduct

Participants are kindly reminded to please read and observe our QGIS Code of Conduct and Diversity Statement to make these events a great experience for everyone!

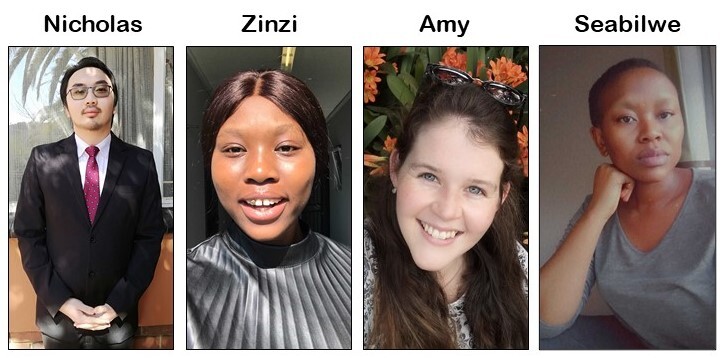
Please contact me, Zinziswa Xakayi by email [email protected] or via the Telegram Channel username @zinzixakayi if you have any queries or need help setting up events.

We look forward to seeing you there!

Regards

The QGIS Open Day Organising Team!

QGIS Grant Programme 2021 Results

We are extremely pleased to announce the 8 winning proposals for our 2021 QGIS.ORG grant programme. Funding for the programme was sourced by you, our project donors and sponsorsNote: For more context surrounding our grant programme, please see: QGIS Grants #6: Call for Grant Proposals 2021.

The QGIS.ORG Grant Programme aims to support work from our community that would typically not be funded by client/contractor agreements. This means that we did not accept proposals for the development of new features. Instead proposals focus on infrastructure improvements and polishing of existing features.

Voting to select the successful projects was carried out by our QGIS Voting Members. Each voting member was allowed to select up to 6 proposals. The full list of votes are available here (on the first sheet). The following sheets contain the calculations used to determine the winner (for full transparency). The table below summarizes the voting tallies for the proposals:

qgis-grants-2021

A couple of extra notes about the voting process:

  • Voting was carried out based on the technical merits of the proposals and the competency of the applicants to execute on these proposals.
  • No restrictions were in place in terms of how many proposals could be submitted per person / organization, or how many proposals could be awarded to each proposing person / organization.
  • Voting was ‘blind’ (voters could not see the existing votes that had been placed).

We received 39 votes from 23 community representatives and 16 user group representatives.

On behalf of the QGIS.ORG project, I would like to thank everyone who submitted proposals for this call!

Reports from the winning grant proposals 2020

With the QGIS Grant Programme 2020, we were able to support ten proposals that were aimed to improve the QGIS project, including software, infrastructure, and documentation. The following reports summarize the work performed in the proposals. We’ll update this blog post as more reports come in:

  1. Quality Assurance methodology and infrastructure (Alexandre Neto, Alexander Bruy, Giovanni Manghi)

    The Tester plugin has been updated to run on QGIS 3.x. It allows to run automated and semi-automated tests and helps to conduct testing by providing step-by-step instructions to perform manual or verification tasks. An initial small set of tests for QGIS core functionality has been implemented as a separate QGIS Core Tests plugin. Furthermore, a test management system and test plan based on KIWI TCMS has been set up and documentation for testers has been created and published.

  2. Smarter map redraws + tile download manager (Martin Dobias)

    Smarter Map Redraws avoid the annoying flicker when map in the map canvas is zoomed or moved. It is especially noticeable with background maps. The work has reduced the problem especially for raster layers. See the videos of comparison before/after.
    Tile Download Manager is not going to be very visible to the users, but it should make QGIS behave nicely with remote servers – until now it would be common that QGIS would request raster/vector tiles, then abort the requests while they were in progress when map got moved/zoomed, only to start those requests again – this should be avoided now.

  3. DB Manager Table Management Functionalities to Browser Port – part 2 (Alessandro Pasotti)

    QGIS browser now exposes a new “Fields” item for vector layers that can be expanded to show the underlying fields, an icon identifies the base field type. New context menu items allow user to create and delete fields. At the connection level, a new context menu item allows you to create a new table for all DB connections that support the Connections API (PG, Spatialite, GPKG, MSSQL). All the new functions are implemented using the new connections API and exposed to Python for plugins/scripts. There have been many other small improvements in the API and in the browser, such as homogenization of the error/warning/success reporting .

  4. QGIS Server, OGC tests and Continuous Integration (Paul Blottiere)
    A Python tool named pyogctest has been implemented to run OGC tests in command line for the WMS 1.3.0 testsuite and has been integrated with GitHub Action in QGIS continuous integration mechanism to avoid regressions. The documentation chapter about OGC and conformance tests is now up-to-date with an explanation of how pyogctest can be used locally for server developers. Moreover, pyogctest is now also integrated with QGIS-Server-CertifSuite for the nightly tests. This way we have an homogeneous testing environment with CI. 
  5. QGIS Server performance monitoring (Paul Blottiere)
    The whole QGIS-Server-PerfSuite has been upgraded to use 3.10 and 3.14 releases side by side with 2.18 and master branch. Performances may be now monitored daily with the latest releases. Moreover, a simple anomalies detection mechanism has been implemented and a mail is sent if a regression is detected. Several scenarios have been added to compare performance with the same data but relying on different providers (PostGIS, Spatialite, Geopackage and Shapefile). Finally, a simple mechanism based on multiprocessing has been implemented to simulate multi-clients situation. 
  6. FileGeodatabase spatial index in OpenFileGDB driver (Even Rouault)
    This work has been successfully completed in GDAL master (for GDAL 3.2) and automatically benefits QGIS when it uses the OpenFileGDB driver. Performance-wise, for example, counting the number of features intersecting a spatial filter which returns 81 046 polygons, now runs in 400 ms with GDAL 3.2dev and the OpenFileGDB driver, versus 6.7 s before (full scan), vs 890 ms with the FileGDB driver (with FileGDB SDK 1.5). Interactive display in QGIS with the OpenFileGDB driver is as fluid as with the FileGDB one. Comparing behaviour of OpenFileGDB and FileGDB drivers with strace shows that they read a similar amount of data in the .spx file, which confirms it is uses correctly. The filegdb reverse engineered specification was also updated.
  7. MacOS packages (Peter Petrik)
    All tasks from the proposal except the notarization process have been addressed since the work necessary to address critical bugs in projection, grass, saga, gdal, python and other parts of the MacOS packages exceeded expectations. (A note about the workaround for notarization has been added to the QGIS.org webpage for now.) Key improvements for QGIS 3.16 MacOS Packages are: QGIS-Mac-Packager without homebrew dependencies, updated GDAL3, PROJ6 & GRASS 7.8.2, fixed Grass, Saga &, GDAL provider loading, and many more. 
  8. Evaluate Qt for Python (Denis Rouzaud)
    The initial evaluation was followed by a report on the migration to Qt-for-Python. The report’s recommendations are now being discussed in QEP#237.
  9. Settings registry (Denis Rouzaud)
    The complete implementation of the core part has been achieved (settings, registry and Python bindings). All core settings were migrated. Other settings still have to be migrated, CI tests should be added to avoid usage of the old API and potential GUI improvements are outlined in the report.
  10. To be continued 

Thank you to everyone who participated and made this round of grants a great success and thank you to all our sponsor and donors who make this initiative possible!

Why are my survey points shifted?

It happens that when you collect data and then checking it in the office on your desktop using QGIS, the points are misplaced and shifted. This blog post explains the possible root cause of this issue? (Read time 5 min)

This article follows the help document about the projections and coordinate reference system handling in QGIS.

The accuracy of the captured points is affected by two main factors

  • GPS receiver and accuracy
  • Selection of coordinate reference systems used in the project

Lets take a closer look at both problems in context of field surveys.

GPS accuracy

GPS accuracy depends on the quality of your GPS receiver and the number of visible GPS satellites your receiver can use at the moment of capturing the point.

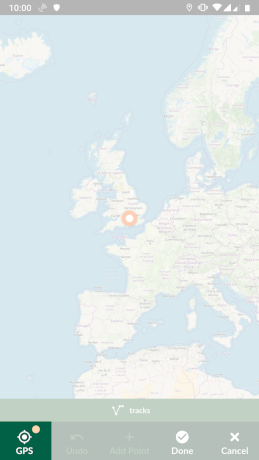
When you load the map in Input app, the bottom bar contains the GPS marker with a coloured dot. The dot can have the following three colours:

  • green: The actual accuracy is below the threshold
  • orange: The actual accuracy is above the threshold
  • red: The GPS is unavailable

GPS accuracy low

For different use cases, acceptable accuracy is different. So the threshold for the colour scheme could be adjusted in the Input app settings. Always adjust the settings based on your project needs and check the GPS accuracy when capturing data.

Input app GPS settings

The GPS receiver itself can be either improved by usage of device with a better internal hardware or usage of powerful external GPS receivers If you want to use the external GPS receiver, read the following help article for setup.

Projection problems

First of all, there could be multiple problems with setup of coordinate reference systems and transformations. To solve it, you need to load the project in QGIS, using Mergin Plugin and check for various situations as described in this help article.

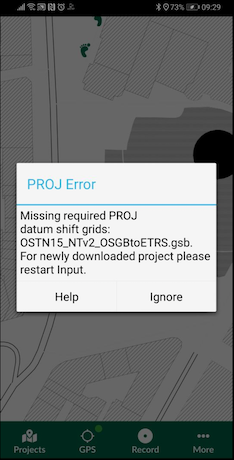
Input app checks for missing datum shift files or other transformation problems and notify you once at the project load by following message.

shift of the point

To be able to use the datum grid shift in your mobile app:

  • Copy the proj folder from your QGIS working directory (see help page for different platforms)
  • Paste the folder to your survey project downloaded fromt he Mergin server
  • Sync the changes

For our example with the British national grid on Windows, the grid file is called OSTN15_NTv2_OSGBtoETRS.gsb and if the Mergin project is in C:\users\qgis\myproject then it should be copied to C:\users\qgis\myproject\proj directory and synchronised by the Mergin service to the Input app.

Notes:

  • This is one-off process. Input app will transfer the grid shift datum to its own working directory on your mobile device.
  • There might be more than one datum grid shift in your QGIS working directory. Use the appropriate one for your survey project.

You can find a short summary of this article on the Input app help pages

Capturing geotagged photos with Input app

In this post, we will explore the new feature in the Input app which allows you to record and display photo’s geotag information (e.g. direction, longitude and latitude).

Photos’ metadata

When users take photos in the field, they often would like to record extra information which can help convey a better understanding and awareness of the surroundings. Recent mobile devices allow users to record photo direction, location, time stamp, camera settings, etc when taking photos. This information is often optional or restricted by default (due to privacy) within the mobile settings.

For surveying and data collection, this information can add extra dimension and context. For example, if you are surveying a bat nesting, it is useful to know the directions of the photos you have taken. This will help identifying the site easily in the subsequent site visit.

Geotag information is also useful metadata to have attached to your photos. There are other GIS or non-GIS applications which can read and interoperate the information.

In the recent version of the Input app, we have added a feature which allows you record and display the geotag information. Combined with QGIS styling, you can create a very informative symbology to display the information while you are capturing it in the field.

Before you start

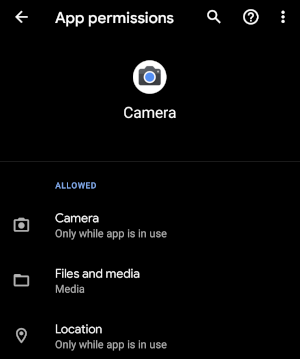
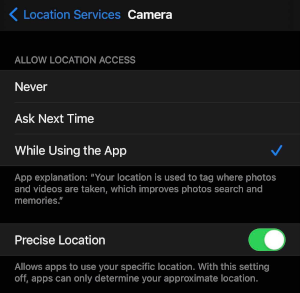
To be able to capture geotag information, you need to enable your Camera app to use location. For that:

  • in Android, from Settings > Apps and notifications > (see all) Camera and under Permission ensure you allow Location

  • in iOS, from Settings > Privacy > Location Services > Camera and the Precise Location is enabled.

Quick start

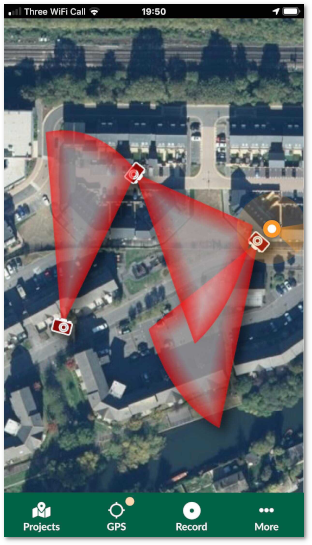
If you want to record photos with directions as shown below, you can follow the following steps:

  • Log into Mergin (or sign up if you have not yet registered)
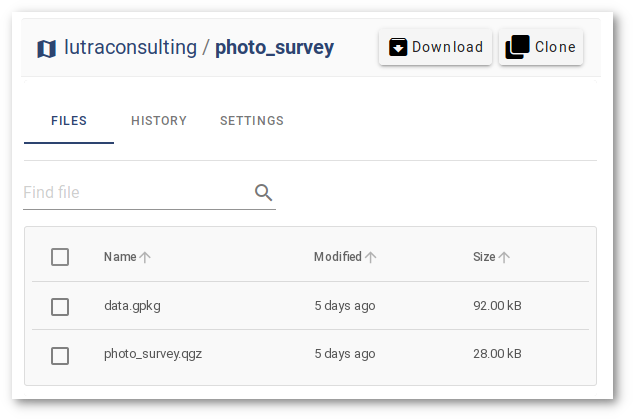
  • Brows to photo survey project
  • On the top right-click on Clone to make a copy of your project in your account. You can choose a different project name:

  • Download and install the Input app

  • Select My projects and log in using your Mergin credentials

  • Download the newly created project from the earlier step

  • Start recording points and add photos, you should see photo direction

More details

The project configuration is done in QGIS. The form has been set up to allow you take photos using Attachment widget. To learn more about different form edit tools in Input app and how to set the up in QGIS, see the Input app help pages.

There are multiple fields to extract geotag information from the photo, as soon as you add the photo either using the camera or the gallery:

  • Direction: read_exif_img_direction(@project_home + '/' + "photo")
  • Latitude: read_exif_latitude(@project_home + '/' + "photo")
  • Longitude: read_exif_longitude(@project_home + '/' + "photo")

As noted, all the above functions take the path to the photo (@project_home + '/' + "photo") and return different metadata related to the image.

In addition to the form, the layer styling has been modified to resemble the direction of the camera and field of view.

To set the camera icon and direction of the camera:

  • For the point styling, select SVG Marker
  • From the list of SVGs, select the camera icon. (ensure to embed the SVG to the project, otherwise it will appear as a question mark in the Input app.)
  • For the Rotation, select direction field

To add field of view:

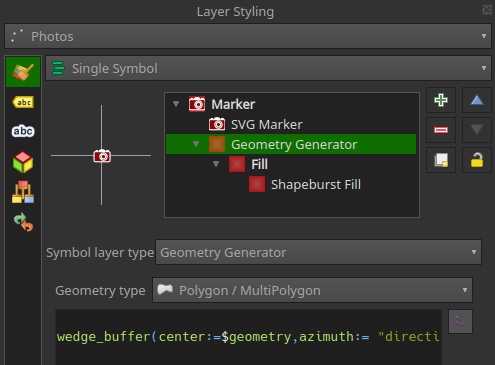
  • Add another symbol layer to your point
  • For Symbol layer type select Geometry Generator
  • For Geometry type select Polygon / MultiPolygon
  • For the expression, type: wedge_buffer(center:=$geometry,azimuth:= "direction",width:=45,outer_radius:=0.0008)
  • For Symbol layer type, select Shapeburst Fill

Feedback and suggestions

Input, a field data collection app based on QGIS. Input makes field work easy with its simple interface and cloud-based sync. Available on Android and iOS.

Screenshots of the Input App for Field Data Collection

Get it on Google PlayGet it on Apple store

If you would like to add a new feature or suggestions to improve the app, do not hesitate to contact us on [email protected]

Tips & tricks for point clouds in QGIS

Just few weeks ago, QGIS 3.18 has been released - the first version to include support for point cloud data, thanks to the great support from the QGIS community in our joint crowdfunding campaign with North Road and Hobu.

We have received a lot of feedback from users and we would like to summarise the most common problems people have faced, and add a couple of tips on useful features that are otherwise easy to overlook.

1. I am unable to load LAS/LAZ files

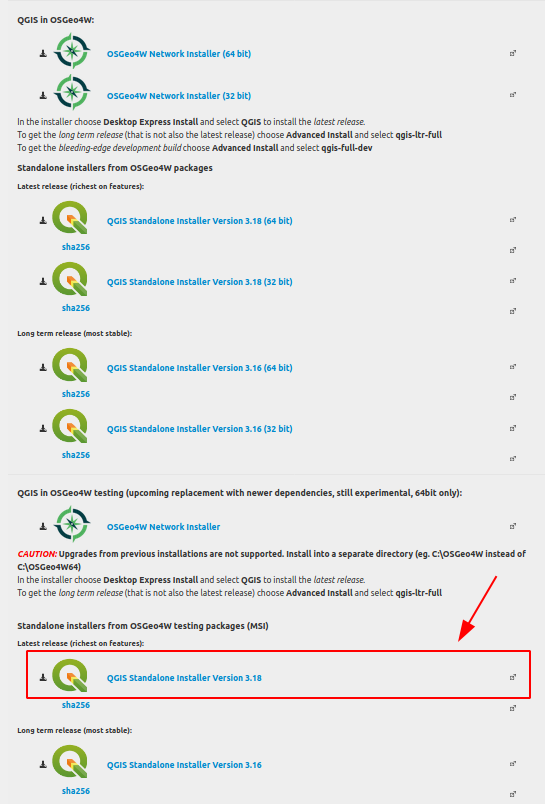
If your QGIS installation does not recognize .las or .laz files (which are the two point cloud formats that we currently support in QGIS), the most likely source of the problem will be that the PDAL library needed for reading LAS/LAZ is missing in your installation. Unfortunately not all installers include it at this point. Particularly on Windows, there are several options how to install QGIS, and only one choice is the right one for PDAL support. At the time of writing (April 2021), you need to download installer from section called “Standalone installers from OSGeo4W testing packages (MSI)”, here’s a screenshot of what to look for:
On macOS the official all-in-one installers include point cloud support. On Linux, PDAL support depends on the particular distribution/packages, but probably most of them include point PDAL library.

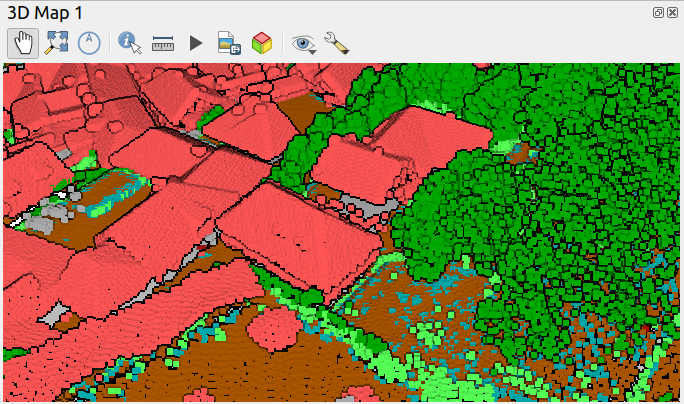
2. Point cloud is completely flat in 3D

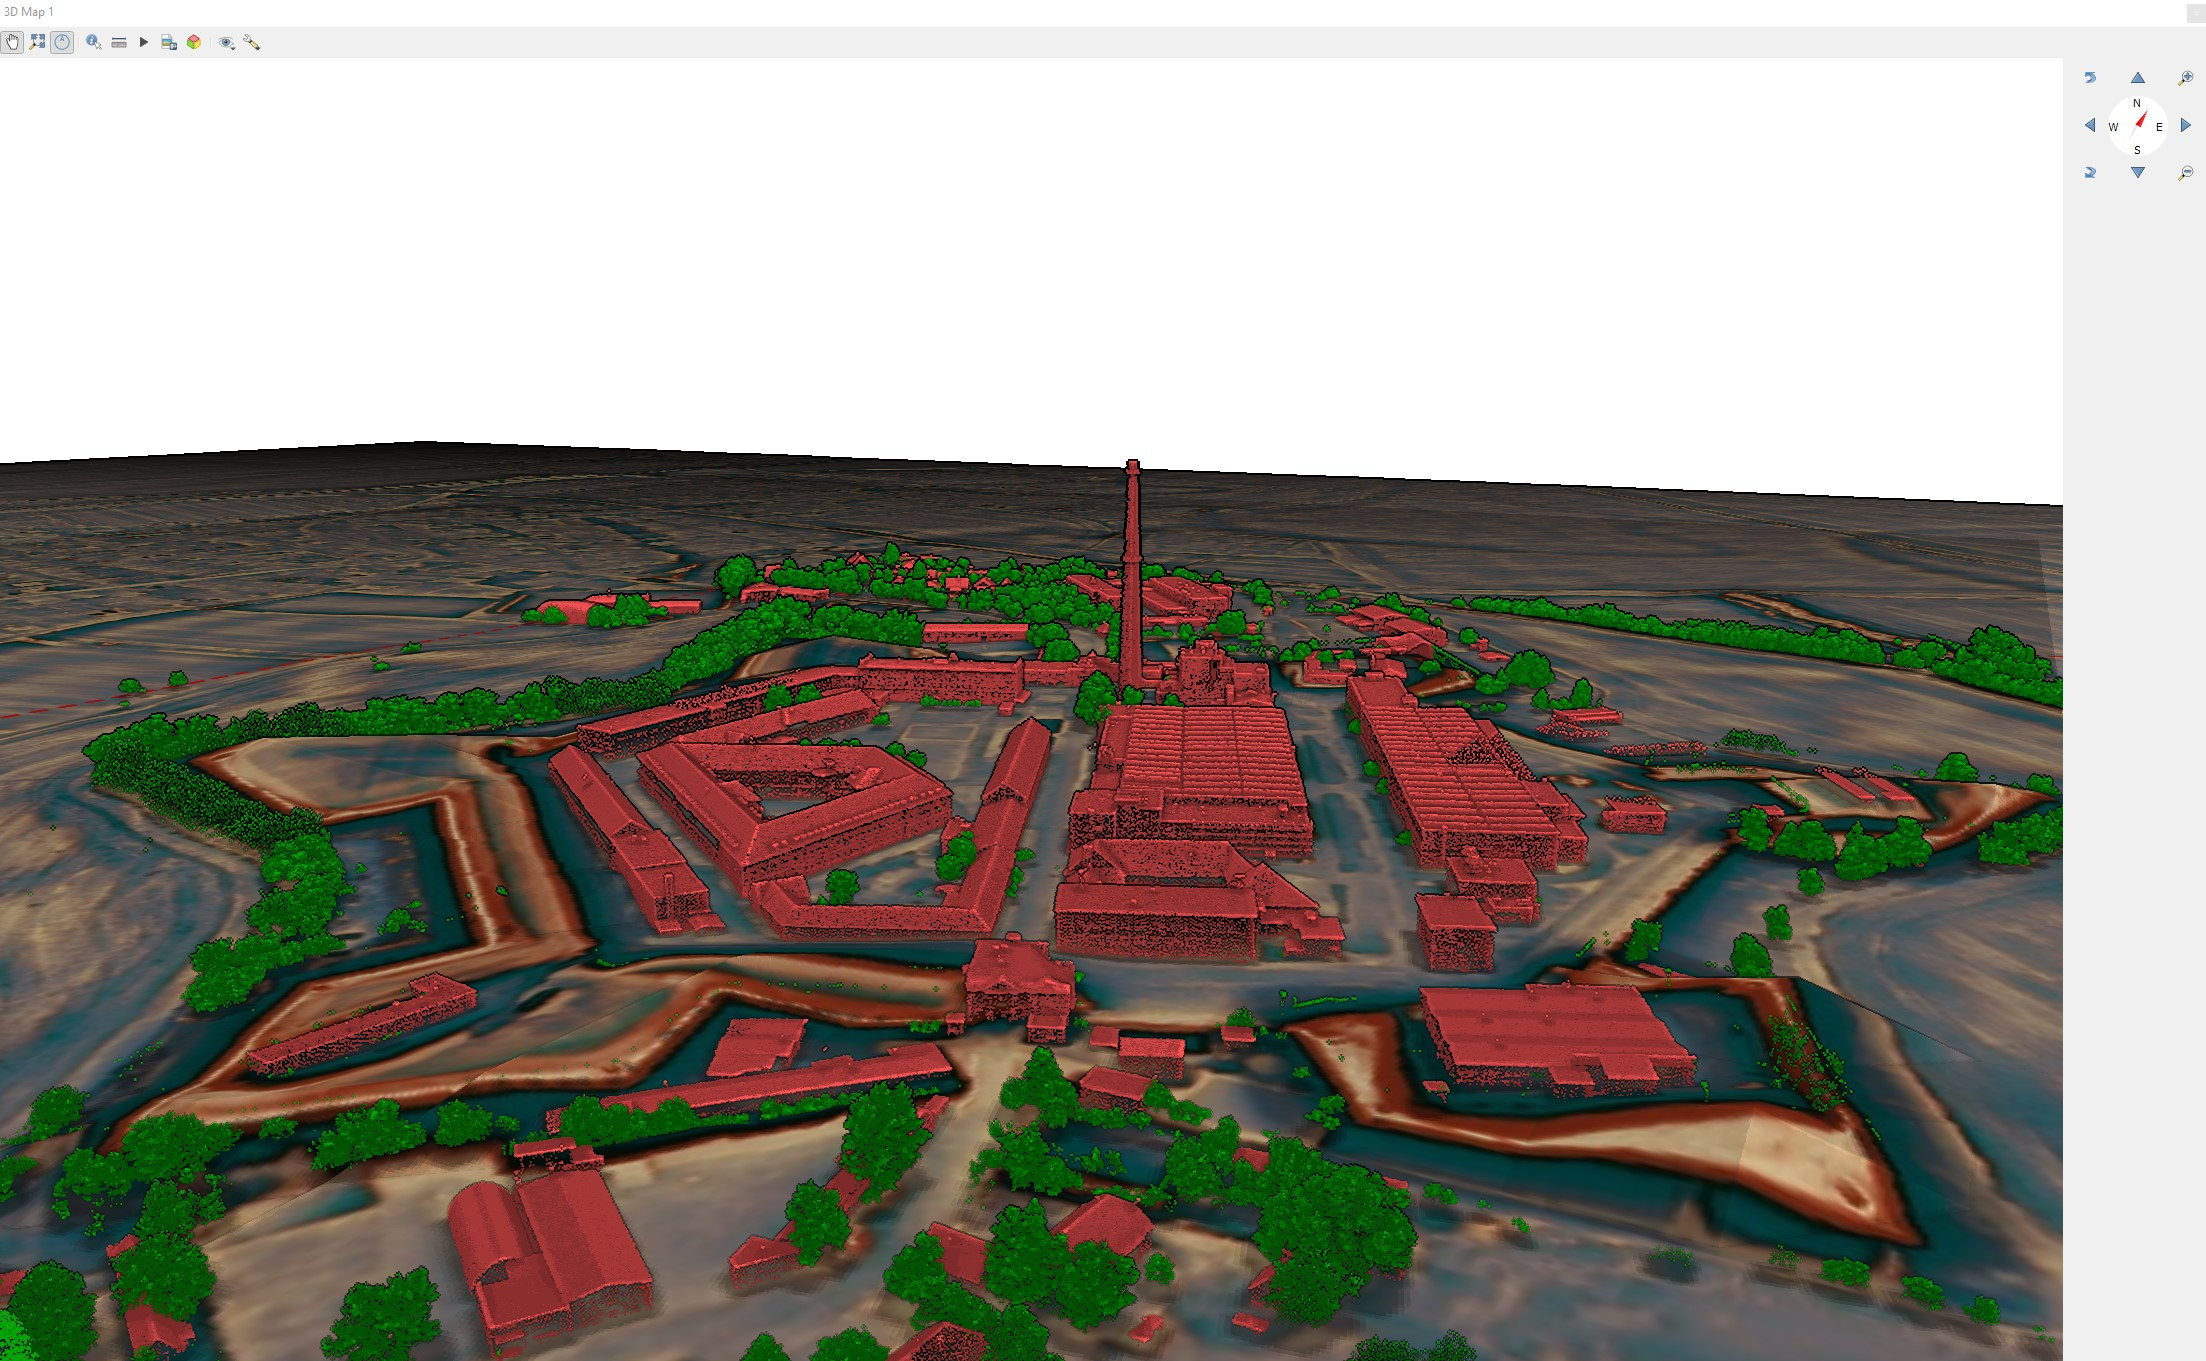
It may happen that you load a point cloud layer, then open the 3D map view and the point is displayed as a flat surface like on this screenshot:
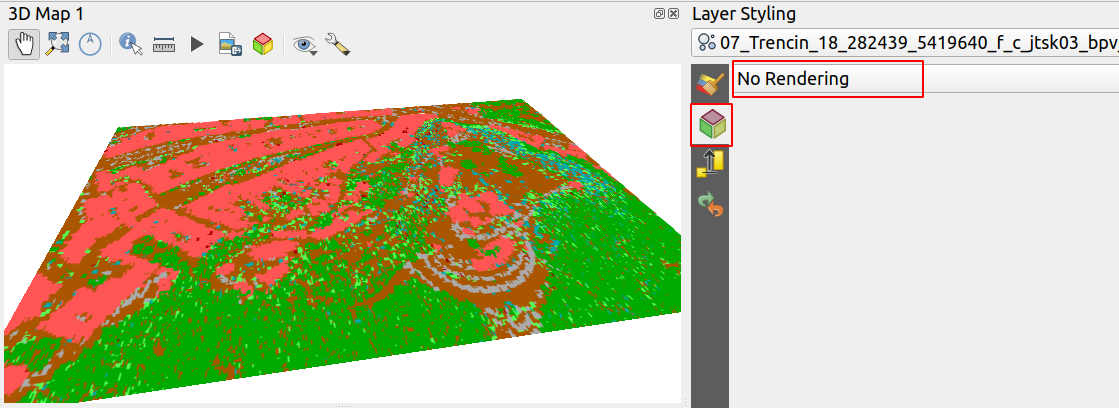
The reason for this is that the 3D renderer is not enabled for your point cloud layer. To enable 3D renderer, open the Layer Styling panel (there’s F7 shortcut to open it!), then switch to the second tab (“3D View” - with a cube icon) and change the “No Rendering” option to some other option - for example “Classification” in case your point cloud is classified. You should then see your point cloud in 3D.

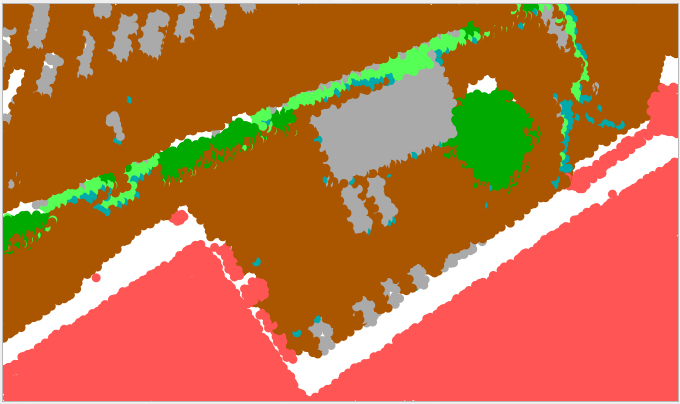
3. Point cloud is rendered twice - in 3D and in 2D (“flat”)

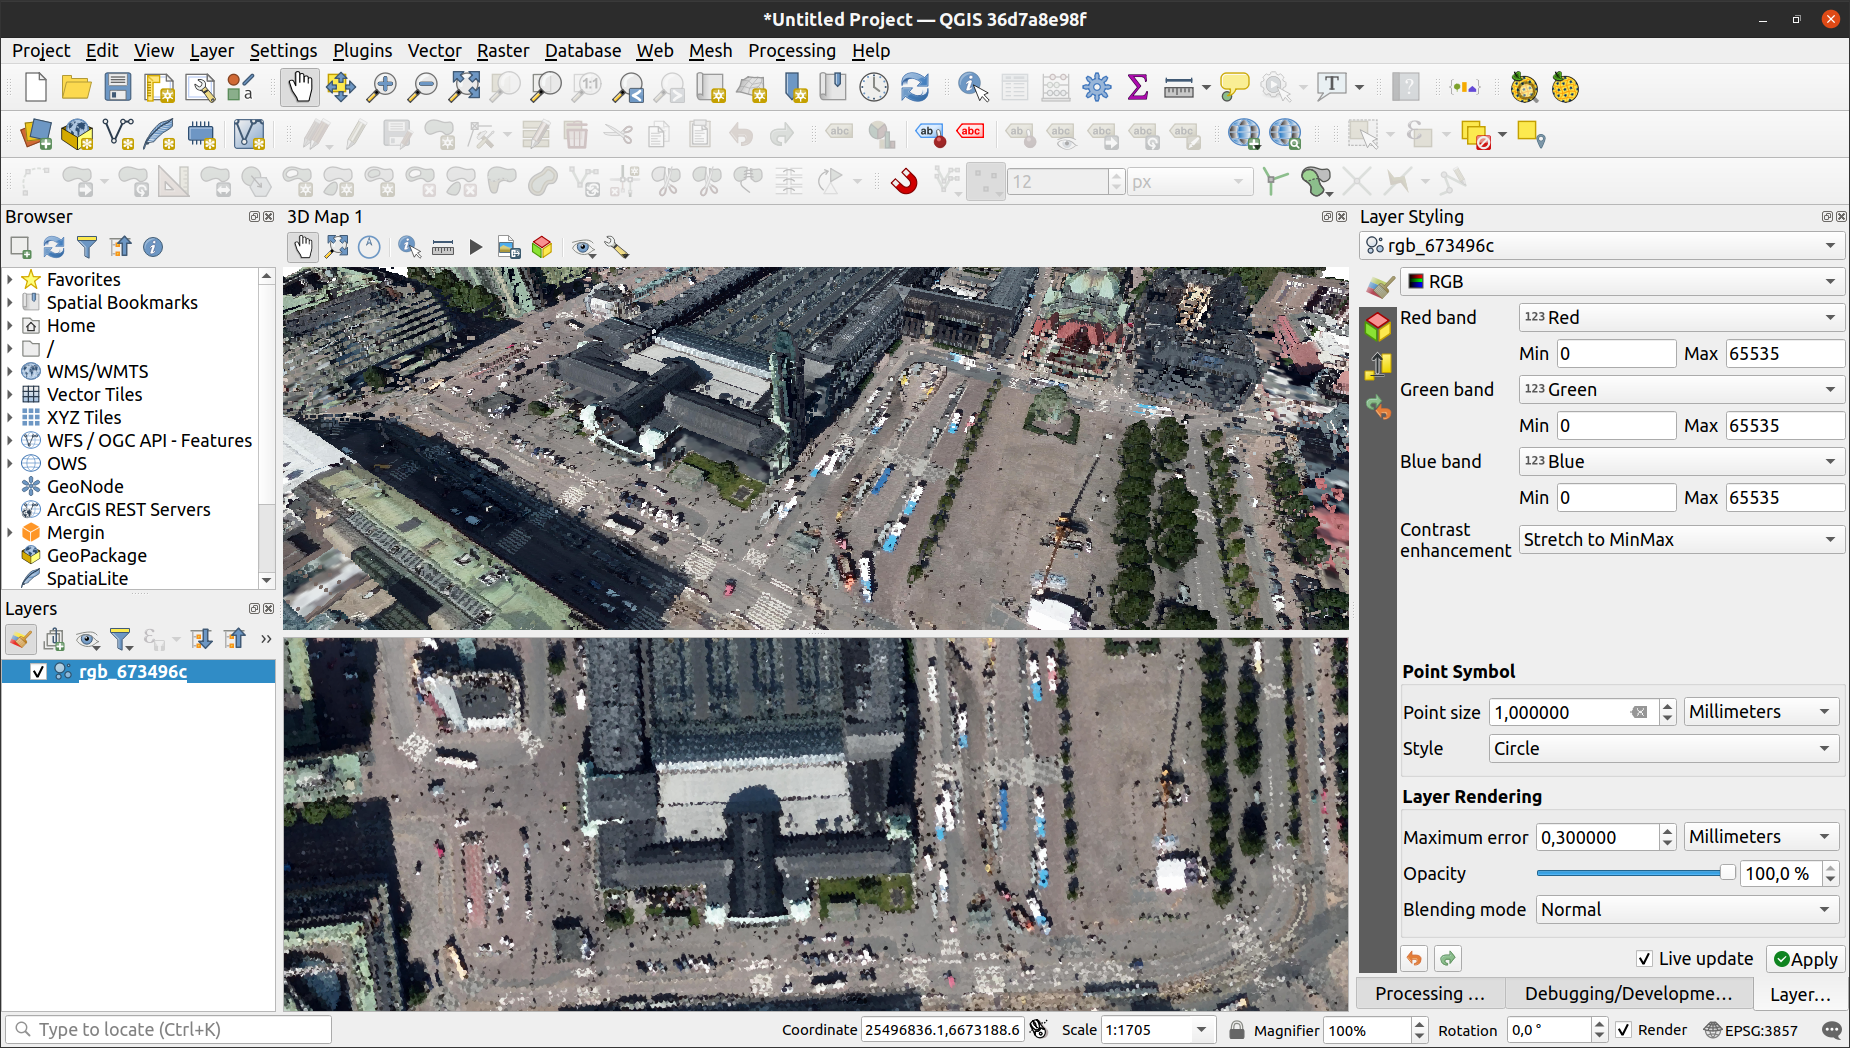
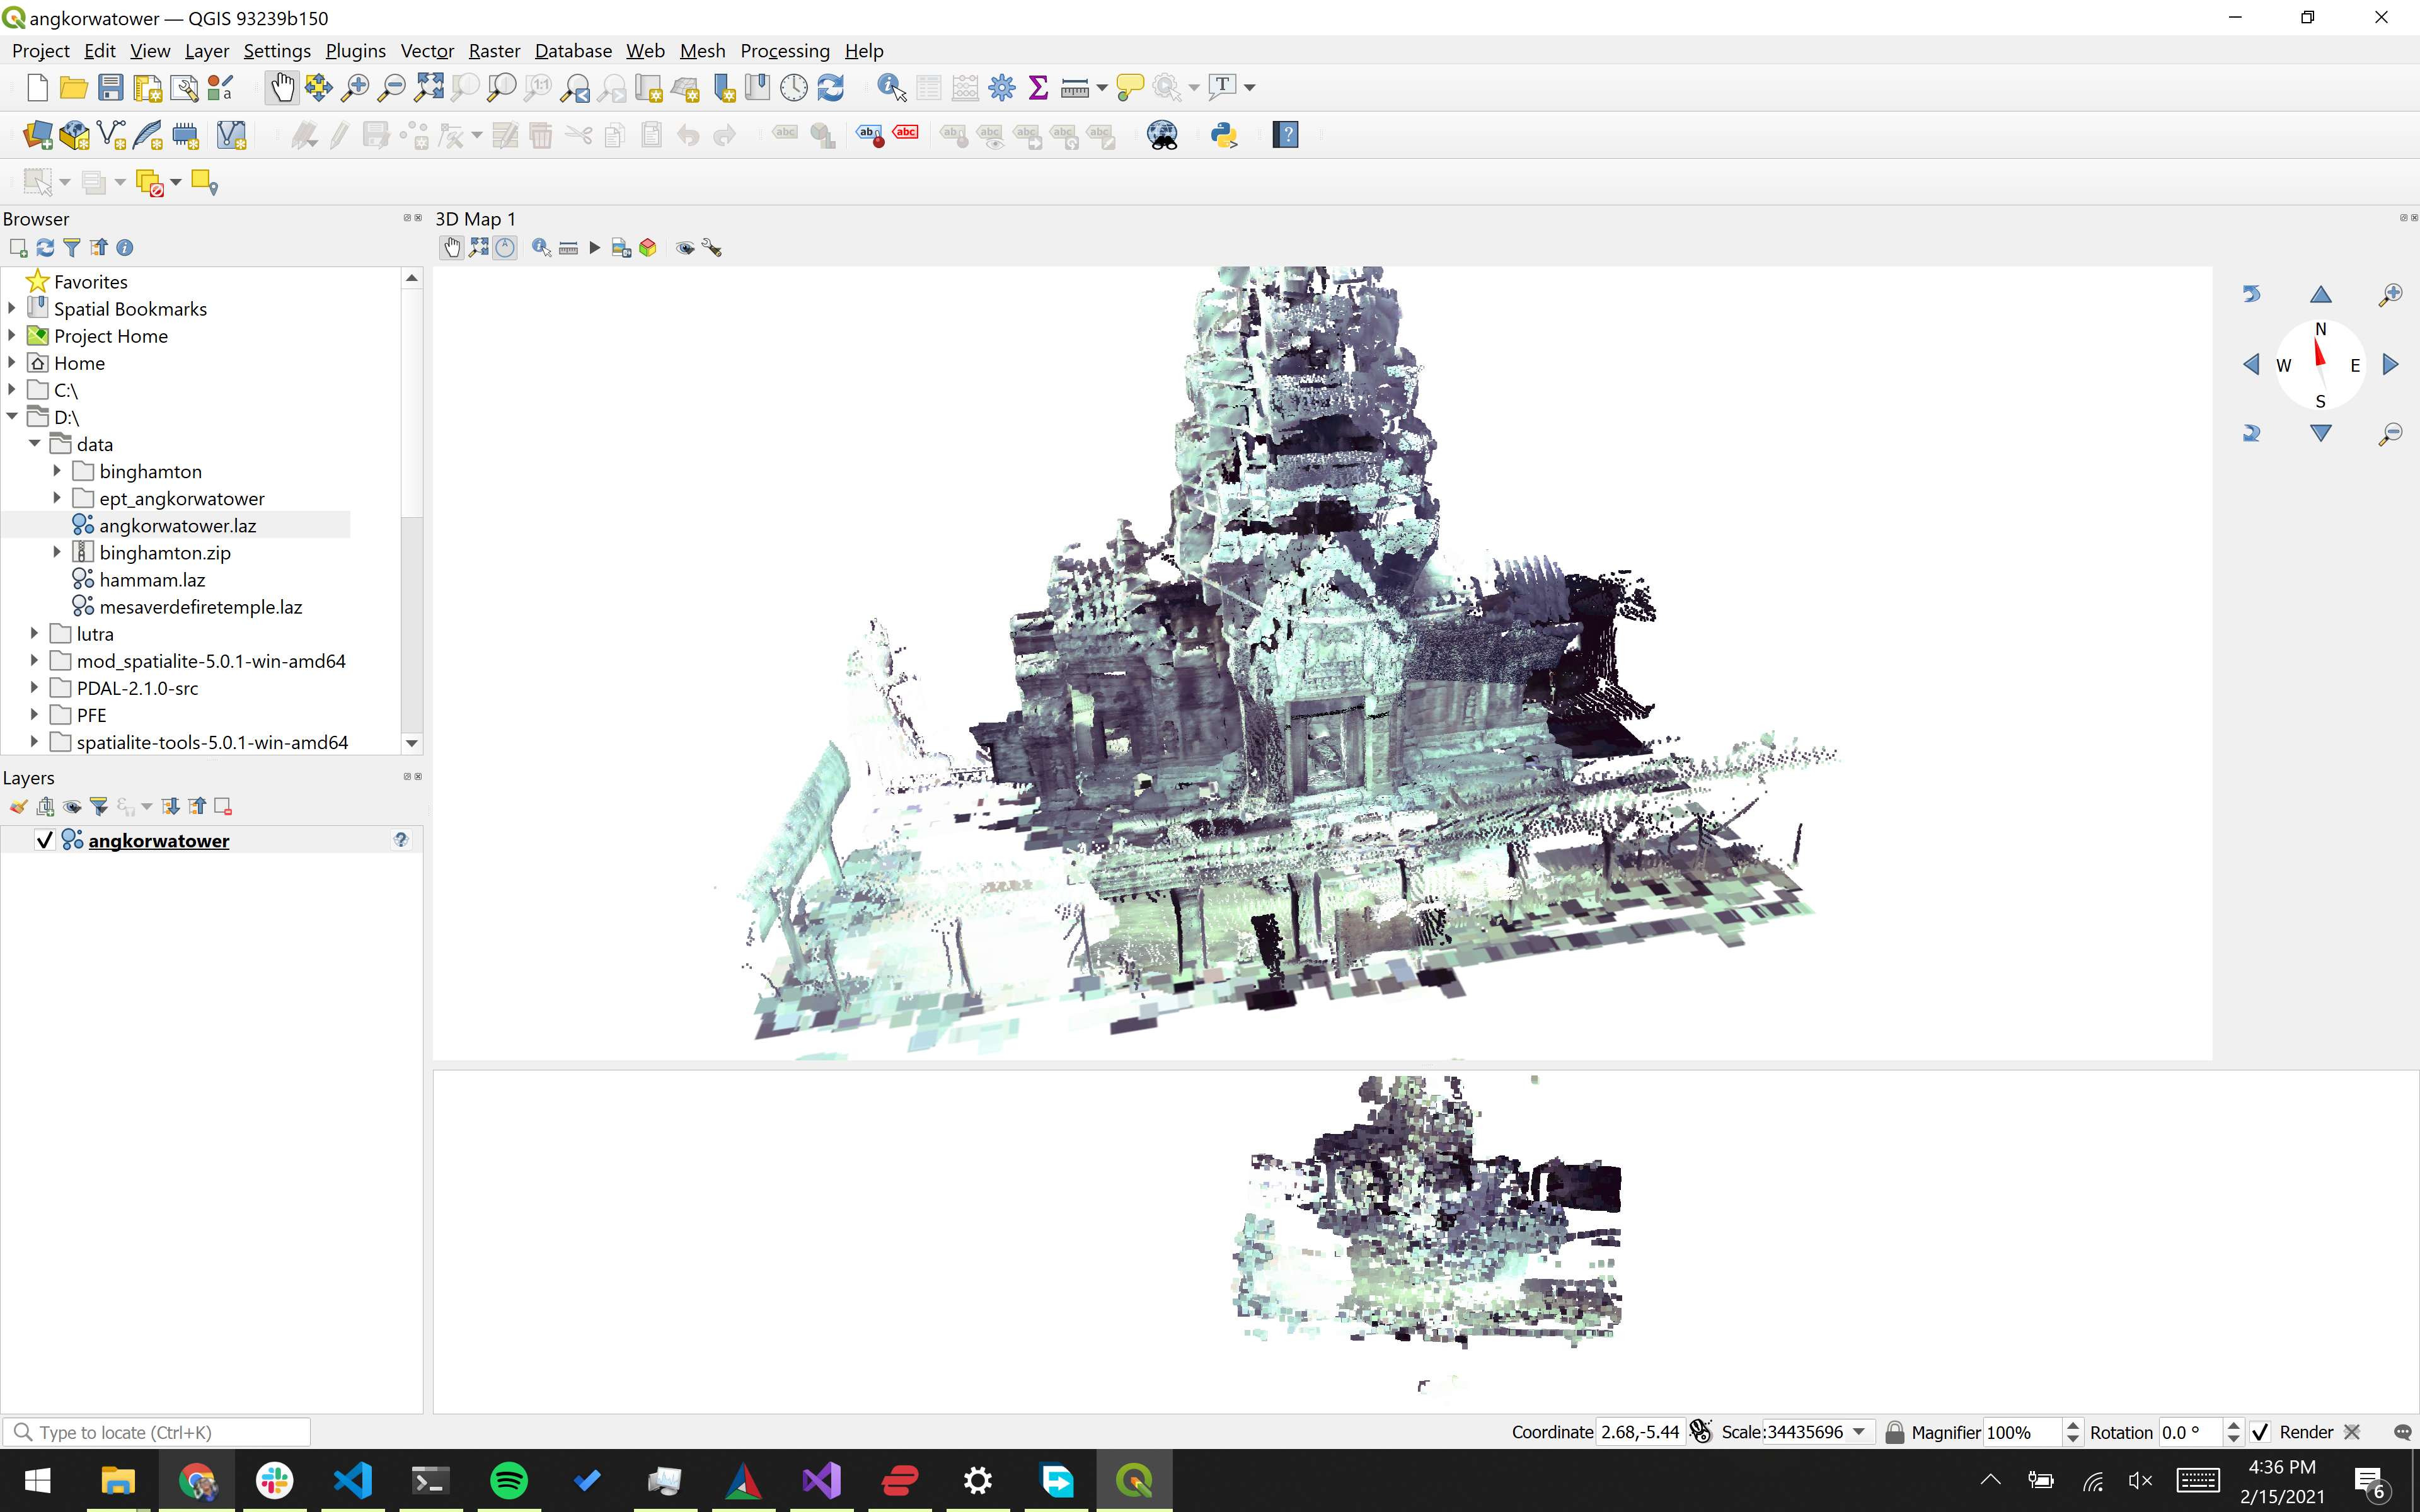
Commonly when people open 3D view with a point cloud, they may see the point cloud rendered twice, like in the following screenshot:
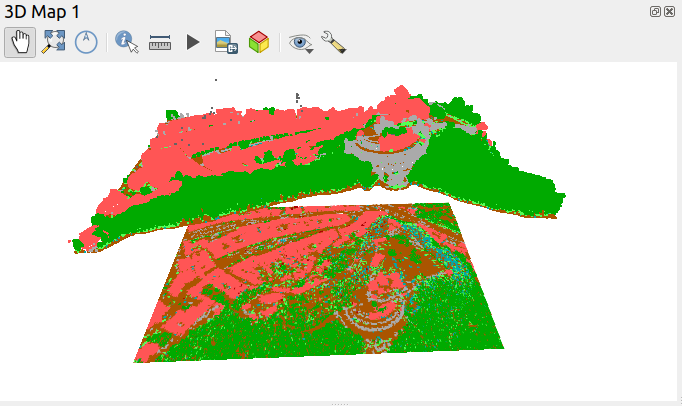
The reason is that both 3D rendering and 2D rendering of point cloud is enabled, and therefore the layer is also rendered as a 2D map texture on top of terrain (which is flat by default). An easy way how to fix this is to set 2D rendering of the point cloud layer to “Extent Only” in Layer Styling panel (in the first tab):
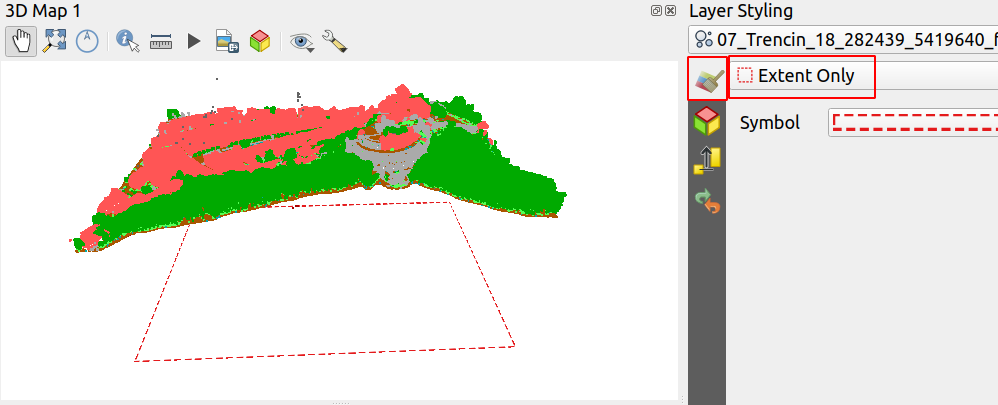
If the dashed rectangle marking the extent is still bothering you, it is possible to change the line symbol to use white (or transparent) colour.

Hopefully in near future we would address unexpected behaviour and layers with a 3D renderer defined would not be rendered as 2D.

4. I still can’t see my point cloud in 3D view

It could happen that if your point cloud is for a small area, yet the elevation of points is relatively high: when you first open 3D view or when you click “Zoom Full” button, the view may get zoomed too close and the actual point cloud data may be behind the camera. Try zooming out a bit to see if it helps. (This is a bug in QGIS - at this point “zoom full” ignores extra entities and only takes into account terrain.)

5. Enable “Eye Dome Lighting” in 3D view

For a much better 3D perception of your point cloud, try clicking the “Options” button (with a wrench icon) in the toolbar of 3D view and enable “Show Eye Dome Lighting” in the pop-up menu. This will apply extra post-processing that adds slight shading based on the positions of nearby points, and adds silhouettes when there is a sudden change in depth:
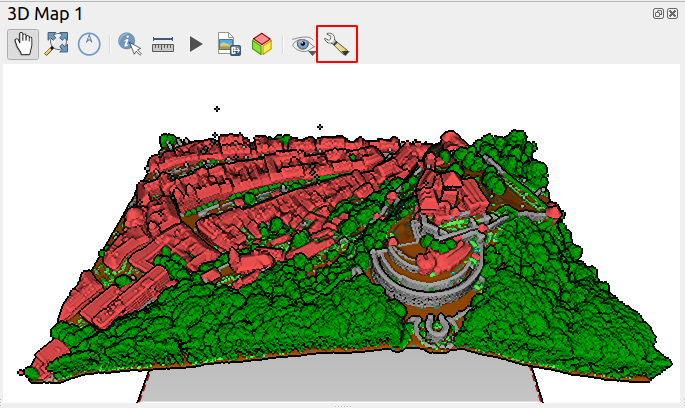
As soon as you zoom into your point cloud more, to the point when individual points can be seen, the eye dome lighting effect will start to disappear. You can try experimenting with the point size (in Layer Panel, 3D View tab) - increasing the point size will help.
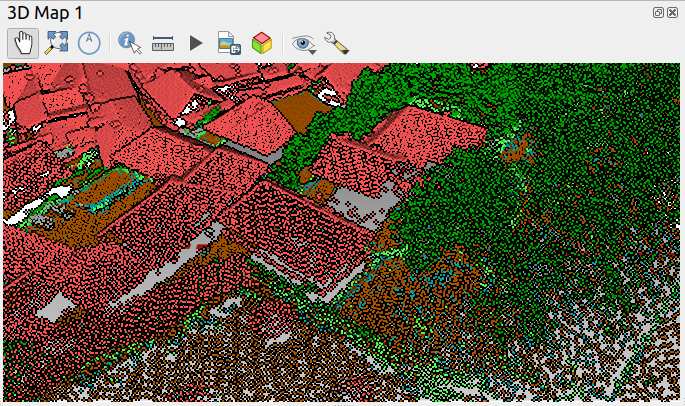
- A view with point size 2.0 pixels

- The same view with point size 6.0 pixels

6. Try the new camera navigation mode in 3D view

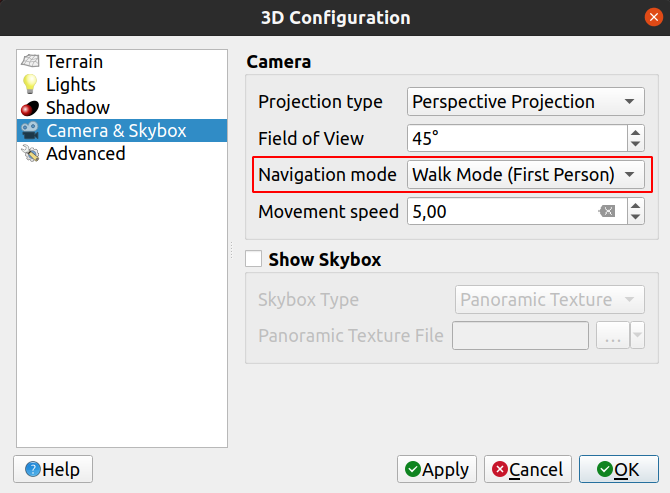
In QGIS 3.18 we have added a new “Walk Mode” camera navigation mode that is much better suited for inspection of point clouds (compared to the default “Terrain Based” camera navigation mode). Open 3D map view configuration dialogue, pick “Camera & Skybox” tab and set it here:
Control                                          Action                                         
Mouse move Rotate camera
Mouse wheel Change movement speed
W / Up Move forward
S / Down Move backward
A / Left Move left
D / right Move right
Q / Page up Move up
E / Page dn Move down

7. Use elevation scaling and offset to your advantage

Sometimes it is useful to modify offset and/or scale of the elevation of points (Z values). For example, if the point elevations do not match your other 3D data, or maybe you have source data where X,Y coordinates are in meters and Z coordinate is in feet!

Another case when this can be useful, is when your point cloud data are further away from the terrain and the default “Terrain Based” navigation mode does not work nicely - it expects that data are near the terrain, and the camera rotates around a point terrain, which may feel strange when browsing point clouds. A workaround is to apply offset to the point cloud layer to move the points near the terrain. For example, this is a point cloud which is roughly at 200 meters elevation (the grey plane is the terrain):

When an offset of -200 is applied to the point cloud in Layer Styling panel, data show up much closer to the terrain and camera navigation feels more natural:

8. Try circular points in 2D maps

By default QGIS draws points as squares as this is the fastest option. But for higher quality output you may want to change point symbol style to circle in Layer Styling panel, which makes things look a little less jagged:
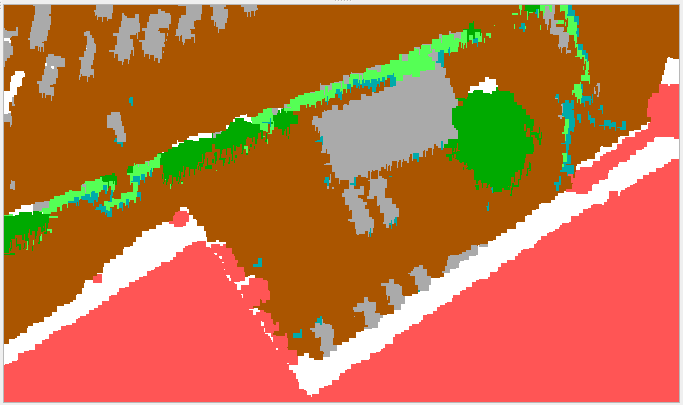
– using squares – using circles

At this point we always use square points in 3D views - in the future we will likely offer circular points in 3D views as well.

9. Give us your feedback

We would love to hear from you about your experience with point clouds in QGIS so far, what features you are missing or what problems you have encountered - feel free to drop us a mail at [email protected]. If you think you have found a bug, best to file an issue for it in the QGIS GitHub repository.

With the QGIS 3.18 release, we know we are only at the beginning of a long journey to provide great point cloud support to the users. The decreasing cost of laser scanning (LIDAR) hardware and increasing availability of photogrammetric methods means that we will be be seeing point cloud data in GIS more and more often. There is still a lot of functionality missing for efficient work with raw point clouds, for easy processing of data and we are still using only a fraction of what the PDAL point cloud library offers. We are dedicated to provide first class support for point clouds in QGIS - however this cannot be done without funding. Therefore, if you would like to help us to push point clouds in QGIS to the next level, please do not hesitate to contact us at [email protected].

You may also like...

Mergin Maps, a field data collection app based on QGIS. Mergin Maps makes field work easy with its simple interface and cloud-based sync. Available on Android, iOS and Windows. Screenshots of the Mergin Maps mobile app for Field Data Collection
Get it on Google Play Get it on Apple store

Movement data in GIS #33: “Exploratory analysis of massive movement data” webinar

Yesterday, I had the pleasure to speak at the RGS-IBG GIScience Research Group seminar. The talk presents methods for the exploration of movement patterns in massive quasi-continuous GPS tracking datasets containing billions of records using distributed computing approaches.

Here’s the full recording of my talk and follow-up discussion:

and slides are available as well.


This post is part of a series. Read more about movement data in GIS.

Movement data in GIS #34: a protocol for exploring movement data

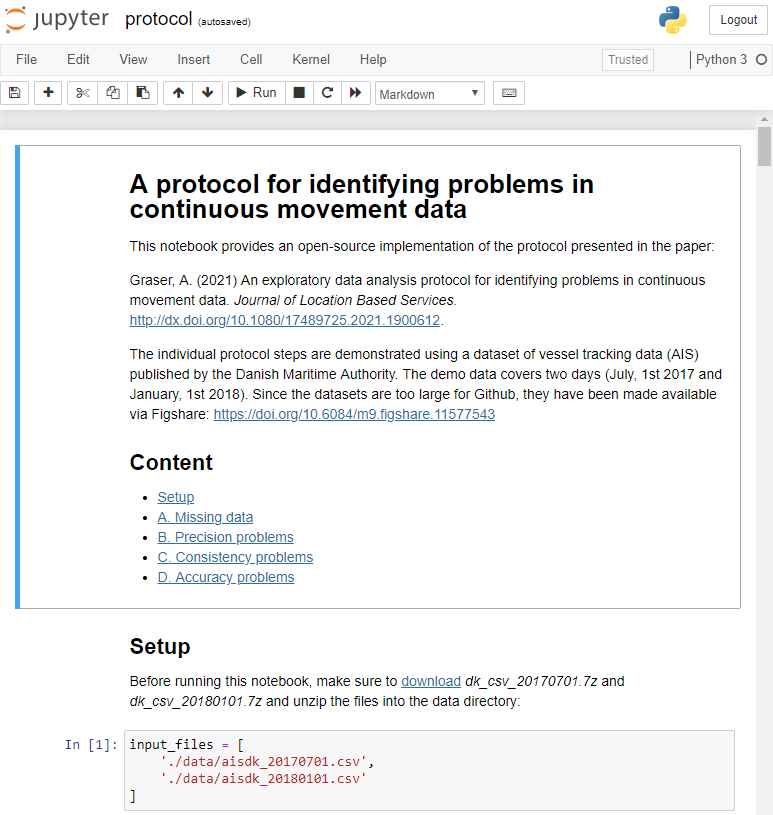
After writing “Towards a template for exploring movement data” last year, I spent a lot of time thinking about how to develop a solid approach for movement data exploration that would help analysts and scientists to better understand their datasets. Finally, my search led me to the excellent paper “A protocol for data exploration to avoid common statistical problems” by Zuur et al. (2010). What they had done for the analysis of common ecological datasets was very close to what I was trying to achieve for movement data. I followed Zuur et al.’s approach of a exploratory data analysis (EDA) protocol and combined it with a typology of movement data quality problems building on Andrienko et al. (2016). Finally, I brought it all together in a Jupyter notebook implementation which you can now find on Github.

There are two options for running the notebook:

  1. The repo contains a Dockerfile you can use to spin up a container including all necessary datasets and a fitting Python environment.
  2. Alternatively, you can download the datasets manually and set up the Python environment using the provided environment.yml file.

The dataset contains over 10 million location records. Most visualizations are based on Holoviz Datashader with a sprinkling of MovingPandas for visualizing individual trajectories.

Point density map of 10 million location records, visualized using Datashader

Line density map for detecting gaps in tracks, visualized using Datashader

Example trajectory with strong jitter, visualized using MovingPandas & GeoViews


I hope this reference implementation will provide a starting point for many others who are working with movement data and who want to structure their data exploration workflow.

If you want to dive deeper, here’s the paper:

[1] Graser, A. (2021). An exploratory data analysis protocol for identifying problems in continuous movement data. Journal of Location Based Services. doi:10.1080/17489725.2021.1900612.

(If you don’t have institutional access to the journal, the publisher provides 50 free copies using this link. Once those are used up, just leave a comment below and I can email you a copy.)

References


This post is part of a series. Read more about movement data in GIS.

Movement data in GIS #35: stop detection & analysis with MovingPandas

In the last few days, there’s been a sharp rise in interest in vessel movements, and particularly, in understanding where and why vessels stop. Following the grounding of Ever Given in the Suez Canal, satellite images and vessel tracking data (AIS) visualizations are everywhere:

Using movement data analytics tools, such as MovingPandas, we can dig deeper and explore patterns in the data.

The MovingPandas.TrajectoryStopDetector is particularly useful in this situation. We can provide it with a Trajectory or TrajectoryCollection and let it detect all stops, that is, instances were the moving object stayed within a certain area (with a diameter of 1000m in this example) for a an extended duration (at least 3 hours).

stops = mpd.TrajectoryStopDetector(trajs).get_stop_segments(
    min_duration=timedelta(hours=3), max_diameter=1000)

The resulting stop segments include spatial and temporal information about the stop location and duration. To make this info more easily accessible, let’s turn the stop segment TrajectoryCollection into a point GeoDataFrame:

stop_pts = gpd.GeoDataFrame(columns=['geometry']).set_geometry('geometry')
stop_pts['stop_id'] = [track.id for track in stops.trajectories]
stop_pts= stop_pts.set_index('stop_id')

for stop in stops:
    stop_pts.at[stop.id, 'ID'] = stop.df['ID'][0]
    stop_pts.at[stop.id, 'datetime'] = stop.get_start_time()
    stop_pts.at[stop.id, 'duration_h'] = stop.get_duration().total_seconds()/3600
    stop_pts.at[stop.id, 'geometry'] = stop.get_start_location()

Indeed, I think the next version of MovingPandas should include a function that directly returns stops as points.

Now we can explore the stop information. For example, the map plot shows that stops are concentrated in three main areas: the northern and southern ends of the Canal, as well as the Great Bitter Lake in the middle. By looking at the timing of stops and their duration in a scatter plot, we can clearly see that the Ever Given stop (red) caused a chain reaction: the numerous points lining up on the diagonal of the scatter plot represent stops that very likely are results of the blockage:

Before the grounding, the stop distribution nicely illustrates the canal schedule. Vessels have to wait until it’s turn for their direction to go through:

You can see the full analysis workflow in the following video. Please turn on the captions for details.

Huge thanks to VesselsValue for supplying the data!

For another example of MovingPandas‘ stop dectection in action, have a look at Bryan R. Vallejo’s tutorial on detecting stops in bird tracking data which includes some awesome visualizations using KeplerGL:

Kepler.GL visualization by Bryan R. Vallejo

This post is part of a series. Read more about movement data in GIS.

Project wizard and packaging for Mergin in QGIS

Based on the feedback from users, it appeared that packaging and creating a stand-alone project for using on the Input app were sometimes cumbersome and confusing. Existing projects have links to several layers and those layers can be spread over different network drives or folders.

With the new release of the Mergin plugin for QGIS, we have introduced a project wizard, which can help users to package and upload the project to the Mergin service. There is also a new toolbar to simplify your workflow.

Easy access to Mergin tools

The plugin now comes with a new toolbar. The common tasks (syncing the project/data and checking the status of the project) are now available from the toolbar.

Project wizard

To create a new project, you can start from a blank project or alternatively open an existing project. You can then select Create Mergin Project from the toolbar:

Project creation icon in toolbar

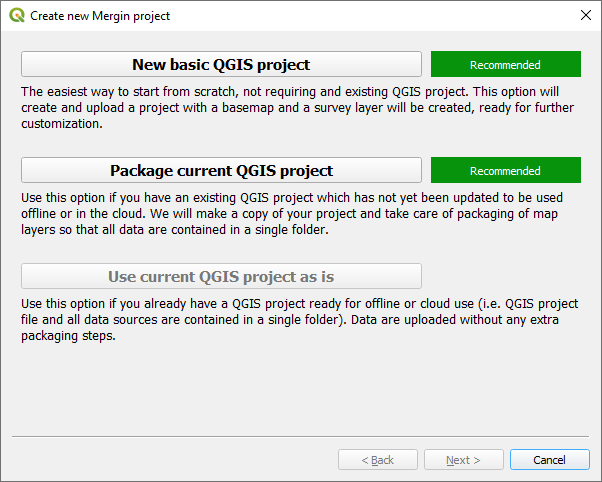
A new window will appear which should give you three options (the last two options are available only if you have an existing project open):

Project wizard - step 1

  • New basic QGIS project: if you are new to QGIS, this is a good starting point. With this option, a project will be created. Within the project there will be a survey layer (a point layer) and background map (OpenStreetMap).

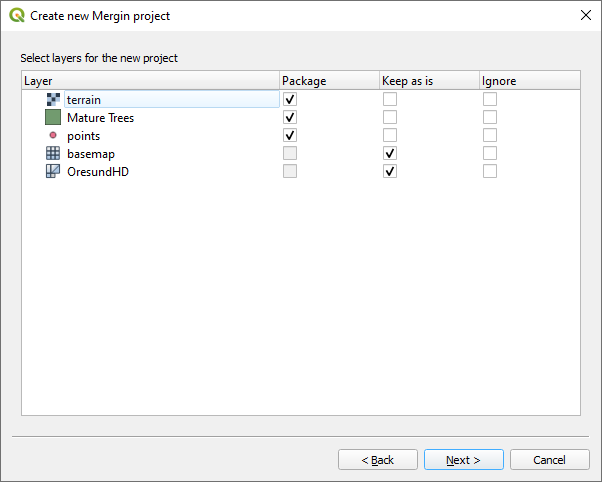
  • Package current QGIS project: this option will create a copy of your project and copies all the files to a single folder. The wizard tries to guess each format and offers users three options to package the layer, keep as is (i.e. the layer will be referenced as is in the new project) or ignore (the layer will not be included in the new project). The default for each layer type is as: the web services (e.g. WMTS, XYZ tiles, vector tile layers) will be referenced in the new project as they are. Vector layers will be all written to Geopackage format (each vector in one Geopackage database). Raster layers will be copied as they are. The layers will be referenced in the new project accordingly.

Project wizard - step 2

  • Use current QGIS project as is: this is for cases when you have already a stand-alone folder with your projects packaged.

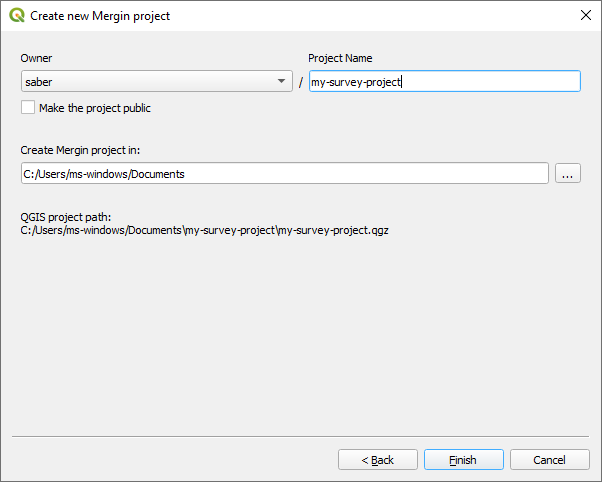
In the next window, you will be prompted to assign a project name and select a path where your project folder and associated files will be generated (this option is only available for the first two choices):

Project wizard - step 2

After the wizard, the new project will be created locally and on the Mergin server.

Validation and status check

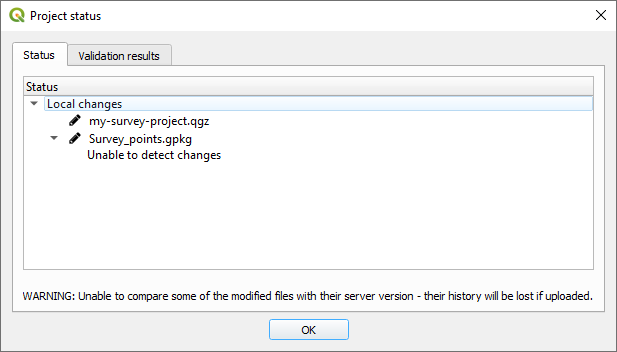
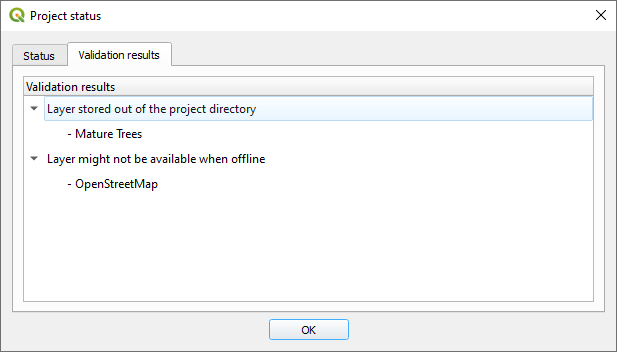
It is recommended to run the project status after changing your layers and project. This will help getting a list of pending changes and also see any warnings or validations of your project. The warnings are related to restructuring of a Geopackage layer (adding/removing a field or addding/removing a layer in a Geopackage database). Validations can be linked to missing layer or availability of a layer when working offline:

Project validation - 1

Project validation - 2

Reporting issues

If you have any issues or suggestion to improve the plugin, you can file a ticket on the Github project repository.

What next

Your project is ready to be used in Input. Get the app for your Android or iOS device. Log into the Mergin service and download the project(s) created in the above section on your device.

Screenshots of the Input App for Field Data Collection

Get it on Google PlayGet it on Apple store

New version of (dutch) PDOKservices plugin for QGIS

Short notice that there is a new version of the PDOKservices plugin for QGIS, adding aerials 2020 and a way to set two favourite layers.

Video recommendations from FOSDEM 2021

The Geospatial Dev Room at FOSDEM 2021 was a great event that (virtually) brought together a very diverse group of geo people.

All talk recordings are now available publicly at: fosdem.org/2021/schedule/track/geospatial

In line with the main themes of this blog, I’d particularly like to highlight the following three talks:

MoveTK: the movement toolkit A library for understanding movement by Aniket Mitra

Telegram Bot For Navigation: A perfect map app for a neighbourhood doesn’t need a map by Ilya Zverev

Spatial data exploration in Jupyter notebooks by yours truly

QGIS 3.18 Zürich is released!

We are pleased to announce the release of QGIS 3.18 ‘Zürich’!

Installers for all supported operating systems are already out. QGIS 3.18 comes with tons of new features, as you can see in our visual changelog. Additionally, QGIS 3.16 ‘Hannover’ has now replaced 3.10 as LTR.

If you are using the OSGeo4W installer, please read the corresponding announcement by our release manager Jürgen Fischer.

We would like to thank the developers, documenters, testers and all the many folks out there who volunteer their time and effort (or fund people to do so). From the QGIS community we hope you enjoy this release! If you wish to donate time, money or otherwise get involved in making QGIS more awesome, please wander along to qgis.org and lend a hand!

QGIS is supported by donors and sustaining members. A current list of donors who have made financial contributions large and small to the project can be seen on our donors list. If you would like to become a sustaining member, please visit our page for sustaining members for details. Your support helps us fund our six monthly developer meetings, maintain project infrastructure and fund bug fixing efforts.

QGIS is Free software and you are under no obligation to pay anything to use it – in fact we want to encourage people far and wide to use it regardless of what your financial or social status is – we believe empowering people with spatial decision making tools will result in a better society for all of humanity.

Powerful and gentle QField 1.8 Selma sneaked in

Get fieldwork smoothly and nimbly done despite the ice and snow outside. Collect accurate data with freehand digitizing and improved form widgets, use the data from your external GNSS receivers without any third-party apps and enjoy the pleasant usability of QField 1.8 Selma.

This year started off hi-speed for us. There’s been already a lot of coding, designing and teaching, and we’ve thrown ourselves into these things we love to do. And we published another QField release last week that I completely forgot to announce in this blog. But here it is. It’s QField 1.8, Selma. And it’s packed with cool features.

Let’s have a look.

Freehand drawing

This might be a feature that brings a lot of fun and professionalism to your work. The freehand digitizing mode allows the user to “draw” lines and polygons with the stylus pen. The mode is available for adding line/polygon features as well as for the ring tool of the geometry editor.

Together with the powerful options in the topological editing where you can snap to existing features and avoid overlaps, it’s very convenient to digitize complex shapes.

Zoom in and out

Speaking of fun. One day, a guy from the QGIS community asked us if we could implement the functionality to zoom in and zoom out like he is able to do with an app called Maps from a company named Google. I didn’t know what he meant, but he explained: Single finger double tap-and-hold zoom gesture (which allows you to zoom smoothly from anywhere on the screen). Wow! Didn’t know it before, but it’s super neat! So we made it available in QField as well.

If you are used to it, it’s quite easy. But for beginners it can be a bit difficult. So for people who are not that deft – and to keep the UX self-explanatory and simple – we also added two buttons + / – to zoom in and zoom out with just one finger. So now even a clumsy pirate with a hook instead of a hand can collect data with QField 🙂

Powerful Relation Reference Widget

Let’s be a little bit more serious and talk about how powerful the relation reference widget has become.

View and Edit selected feature

The intuitive eye icon next to the widget lets you open the form of the referenced parent feature to view and edit it.

Autocomplete mode

When auto-complete is enabled, you can easily perform a search in all available parent features.

autocomplete

With space-separated input, you can search for the beginning of multiple words in the display name of the parent features. So in this example searching for “Ma” will find the name “Mae” and “Marie” and using the second word “buck” it finds the Buckfast bees – so the entries containing both values will be listed on top.

Integration of external GNSS receivers

In case you wondered, why we did not release 1.8 Selma earlier? Because we wanted to have it feature loaded and rocket proof. And one of this cool feature is the integration of external GNSS receivers.

QField can receive and decode NMEA sentences received via Bluetooth from an external GNSS receiver (such as an EMLID Reach RS2) without the need for any third party app.

nmea

Search for paired Bluetooth devices in the device settings, connect to the external device and receive the GNSS information.

Select vertical grid shift files

In the QField settings, you can select a grid file on your mobile device by placing it in a directory named QField/proj in the main folder of the internal storage to increase the vertical location accuracy.

Postgres Config File

If you once started using PostgreSQL configuration files, you don’t want to live without them anymore. And when you use it on your PC, I’m sure you want to use it on your mobile device as well.

Define Postgresql services in a pg_service.conf file and use it on QField by placing it directly in a directory named QField in the main folder of the internal storage.

Add reload data button

The layer properties have been polished and in addition, you will find a button to reload the layer data. This is especially useful if you use WFS layers from which you need to get updates.

nmea

Register extra fonts

Also, you can add TTF and OTF font files into a directory named QField/fonts at the main folder of the internal storage to use the nice fonts you like.

fonts

How beautiful is that!

Support of new raster file formats

By the way: Many new raster file formats are supported – most notably COG. While not yet supported as remote format streamed directly from the web, it is also a high performance format if used locally

What about the cloud?

You might be one of these people eagerly waiting and always receiving the same message: Keep calm, it’s coming soon. Sorry for that. But when we do something, we do it right. And we prefer to have a stable solution than to publish half baked stuff. We are still highly busy coding, testing and promoting QFieldCloud. It’s announced for this spring / early summer.

Also, keep an eye on the @QFieldForQgis and @QFieldCloud twitter accounts to stay updated.

We ♥ our Beta Testers

The Beta Testers are our secret heroes. They report bugs and inconveniences before the normal users are bothered with them. Thanks to the Beta Testers QField is so stable. And at this point we would like to say: Thank you, test heroes!

And what do the beta testers get in return? Well, they can be the very first to try out the great new features. This is exciting and fun. So don’t hesitate. Join the beta.

In the Play Store you should find this section under the “QField for QGIS” app listing. Enjoy the feature frenzy and report the problems at qfield.org/issues

And if you wondered…

… why this release is called “Selma”. It’s of course because of the Mount Selma in Australia… And because it’s the name of my beloved cat. That’s her – Selma Eulenkopf – staring at me while I’m coding QField.

QGIS Grants #6: Call for Grant Proposals 2021

Dear QGIS Community,

We are very pleased to announce that this year’s round of grants is now available. The call is open to anybody who wants to make a funded contribution to QGIS, subject to the call conditions outlined in the application form.

The deadline for this round is 21st March 2021.

For more details, please read the introduction provided in the application form.

We look forward to seeing all your great ideas for improving QGIS!

QGIS Open Day – 26 Feb 2021

On Friday, 26 February 2021 we will be holding our monthly QGIS Open Day! What is a QGIS Open Day you may be wondering to yourself? It is an initiative to replace the wonderful community meetups we used to hold every six months when times were different. Like our in-person meetings, the event is organised on a principle of self-organisation and community participation.

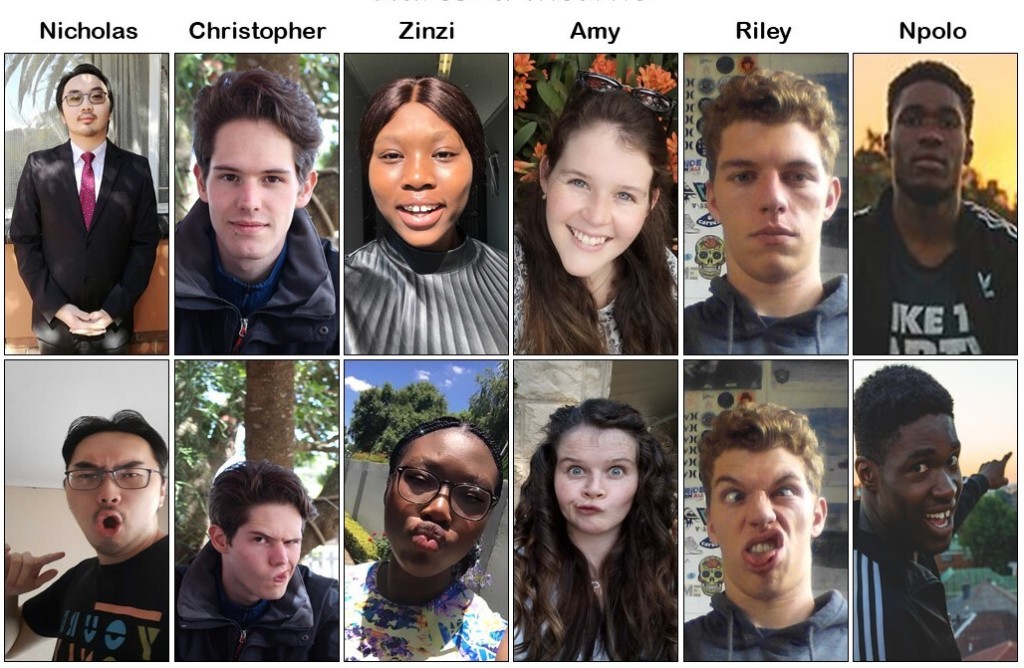
This open day will have the theme of “QGIS Plugged In!” and will be hosted, organised, focussed on and presented by young GIS practitioners from around the world!

Where to watch

Please see the event wiki page for all the details of times and links for participation.

Many of the events may be recorded and made available to users who couldn’t make the live events. YouTube live streams should be automatically available for catchup viewing. Be sure to check back on the wiki page (link above) for updates!

Being a good open source citizen

Participants are kindly reminded to please read and observe our QGIS Code of Conduct and Diversity Statement to make these events a great experience for everyone!

Contact

Please contact Zinziswa Xakayi by email ([email protected]) or via the QGIS Open Day Telegram User Group (https://t.me/joinchat/Aq2V5RPoxYYhXqUPoxRWPQ user @zinzixakayi) if you have any queries or need help setting up events.

We look forward to seeing you there!

Regards the QGIS Open Day Organising Team!

Support for Point Clouds Released in QGIS 3.18

QGIS 3.18 is finally here. This will be the first release of QGIS with native support for point cloud data. This work was made possible by generous contributions from the community.

Point cloud data in QGIS 3D (Data from UGKK SR, made by Tibor Lieskovsky)

Contributors

When we announced the campaign in August 2020, the response was overwhelming and within weeks, we managed to reach and then exceed the amount required.

Below is the list of contributors in no particular order:

Mapfly, Ujaval Gandhi from Spatial Thoughts, National Land Survey of Finland, Daniel Löwenborg, BNHR, Imapct GIS, Andreas Neumann, Kanton Solothurn, Switzerland, City of Vevey, Mapping Automation, Service de la géomatique du canton de Neuchâtel, Hans van der Kwast, 3DGeoCloud, Rudaz+Partner AG, Leonard Gouzin, TileDB, Inc.

We wish to also thank the many anonymous contributors who do not appear in this list.

Note: if you have contributed to the campaign but your name does not appear here, you may not have selected the option to be listed in the campaign form. Please contact us if you’d like to be listed.

In addition to financial contributions, we’d like to extend our gratitude to all those who helped spread the word, helped with the testing and provided feedback and sample data.

New features

Lutra Consulting North Road Hobu

This is a brief summary of new features from our joint work with North Road and Hobu:

  • Introduction of a new map layer type: a point cloud layer
  • Load LAS or LAZ files (either by drag’n’drop or by opening files in Data Sources Manager)
  • Load EPT datasets by pointing QGIS to their ept.json file (currently only supporting datasets on the local drive)
  • Support for rendering point cloud data in 2D and 3D map views
  • Apply various rendering styles in 2D and 3D:
    • “Attribute by Ramp” - draw data based on a single attribute and a color ramp (similar to “Graduated” styling for vector layers)
    • “RGB” - draw data using colors assigned to the points (combining red/green/blue attributes)
    • “Classification” - draw data using different colors for different classes (ground, buildings, vegetation, …), also allowing display of only desired classes
    • “Extent only” (2D only) - draw only bounding box of the point cloud
    • “Single color” (3D only) - draw all points with a single color
  • Set size and shape of points
  • Manually adjust scaling and offset of elevation (Z values) - if needed to match with elevation of other data
  • Point cloud layer properties dialog to see metadata of the point clouds
  • Identify tool supports point cloud layers and shows all attributes of picked points
  • 2D and 3D views only render a subset of the point cloud for the best performance for the given view (for geeks - this is thanks to indexing to octree data structure, using EPT format written by untwine tool packaged with QGIS)
  • Optimize the quality and performance of the 3D view using point budget configuration, which limits maximum amount of point rendered at any time (set to 1 million by default)
  • Enable eye-dome lighting in 3D views for much better depth perception of point clouds
  • New “Walk mode” camera navigation in 3D views - there is now a switch between the original “Terrain based” navigation mode and the new mode, which allow easier navigation through point cloud data

Please note that as this is the initial release (with over 10 thousand lines of new code related to point clouds), there may be still some rough edges here and there, or some data may not load or display correctly. In case you encounter any issues with the new functionality, please let us know - do not hesitate to create a new QGIS issue

Point cloud in action (Data from Helsinki City)

Future work

This has been the start of a larger effort to bring full support for point cloud data into QGIS. We, in collaboration with North Road and Hobu are developing requirements for integrating point cloud data processing and analysis, more data formats, better visualisation, profile tools etc. in future releases of QGIS.

If you’re interested in helping shape those requirements or funding such features, please contact us at [email protected].

You may also like...

Mergin Maps, a field data collection app based on QGIS. Mergin Maps makes field work easy with its simple interface and cloud-based sync. Available on Android, iOS and Windows. Screenshots of the Mergin Maps mobile app for Field Data Collection
Get it on Google Play Get it on Apple store

Test QGIS with Point Clouds on Windows

In the past months, we have been busy adding support for point cloud data in QGIS (3.18). Read more on how to install and test this feature under MS Windows.

Installation

To be able to use this feature, you need extra packages and also the latest OSGeo4W installer.

Update

Since the original post, Jürgen Fischer has created a stand-alone MSI installer. You can download the new installer from the QGIS website. The installer is only for 64-bit platforms and does not support MS Windows 7.

Note that there have been several regressions and bugs with the first release of QGIS 3.18.0. The issues are being addressed and soon there will be an updated version available. The above link is only for those who are eager to test the point cloud data in QGIS.

Installation

To be able to use this feature, you need extra packages and also the latest OSGeo4W installer.

Note: This is a completely revamped and different packaging system than the current OSGeo4W installer. To avoid any clash with your current installation, it is recommended to use different paths for temporary download files and installation of the new packages. The new packaging only supports 64-bit platform.

1- Download and run the NEW OSGeo4W installer

2- Select the Advanced install and pick qgis-dev from the list of packages

Special thanks to Jürgen Fischer for his hard work on preparing the new packages for Windows.

Testing

Once installation is completed, try to run QGIS from the installation path (e.g. C:\OSGeo4W64\bin\qgis-dev.bat). You should be able to load LAS\LAZ file to your map from the Browser panel or the Data Source Manager.

The point cloud data can be visualised in 2D and 3D map canvas.

Point Clouds in QGIS under Windows

Please test and let us know if you encounter any problems when loading, viewing or styling point cloud data. The best way to do that is to create a new issue on GitHub: https://github.com/qgis/QGIS/issues

QGIS 3.18 will be released later this week (February 19), so grab your copy of QGIS today and give it a try, so that we can fix any remaining issues before the release!

Troubleshooting

Problem: I am unable to add any LAS/LAZ point cloud file

Solution: Ensure you have used the correct installer linked above. Development builds of QGIS in the ordinary OSGeo4W installer DO NOT include support for point clouds.

You may also like...

Mergin Maps, a field data collection app based on QGIS. Mergin Maps makes field work easy with its simple interface and cloud-based sync. Available on Android, iOS and Windows. Screenshots of the Mergin Maps mobile app for Field Data Collection
Get it on Google Play Get it on Apple store

  • <<
  • Page 22 of 141 ( 2808 posts )
  • >>

Back to Top

Sustaining Members