As QGIS is such a fast moving project I have decided to make this a regular blog post in order to highlight some new features added to QGIS. If you haven’t already, don’t forget to check out round one.
Remember that some of these features may still only be new which might change between now and the next official released version. With that out of the way lets get listing.
Atlas integration
If you are a regular user of QGIS Python plugins, and who isn’t, then you would have used the awesome Atlas plugin developed by Vincent Picavet. This great tool can be used to generate mapbooks, or an atlas as some people like to say, using a coverage layer and a print composer. What makes this even more awesome is that it is now built into the print composer.

Atlas composer intergration
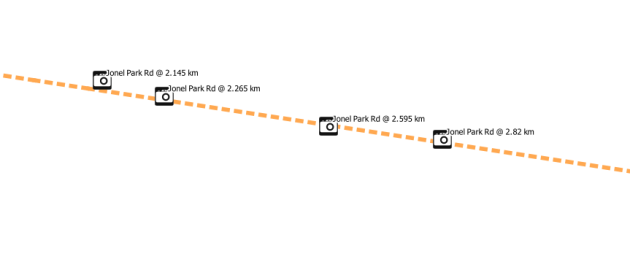
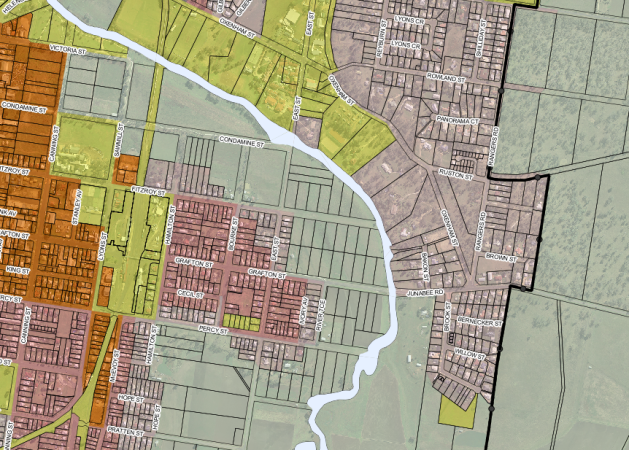
The builtin atlas function also gives you the ability to use an expression to do runtime text replacement, including access to all the fields on the coverage layer. The coverage layer doesn’t even have to be a region layer, it can be a simple point layer, or even a line layer. You can see the result of me running the atlas generation from the above example here
Big thanks to Oslandia for integrating this great feature, and the companies sponsoring the work.
New Python console
This new addition comes from the great work that Salvatore Larosa has been doing to add a better Python console to QGIS.
The new Python console includes attribute auto complete, syntax highlighting, better copy and paste, uploading to codepad, the ability to run code from a file, etc. You don’t realise how much difference there is until you go back to using the old one in version 1.8.

New Python console
Tabbed and groups in builtin forms
One of the things I really loved about QGIS, coming from MapInfo, was the builtin forms. Just having the ability to enter data using controls like combo boxes, calendar widgets, etc makes you one step closer to having better data. This feature is the exact reason I setup a 67 year old for kerb data collection.
As good as they are the builtin forms have an issue of ending up with as a big scrolling list with lots of fields; also the lack of the ability to group or put fields on tabs in the UI meant you had to create a custom form. Well not any more.

There is now a combo box on the Fields tab that allows you to build a generated form but also add tabs and group boxes. You can even have the same field shown more then once on the form, handy for something like an ID field that you would like to show on each tab.

With this new ability the builtin forms can get me 95% of the way for data entry jobs, the other 5% I just make a custom form – but that is very rare.
Sextante
Sextante is a great and powerful analytical framework that has been added to the core of QGIS thanks to Victor Olaya. This is not a feature that I use a lot but this is only due to most of my work being in development and not analysis, however that doesn’t mean that it’s not a really cool feature.
One of the greatest things about the Sextante toolbox is that it allows you to integrate other great open source tools like GRASS, SAGA, R, OTB, etc, right into your QGIS workflow and view the results in the canvas. It even includes a modeller so that you can build a connected diagram of all the bits of your process, even if it crosses between programs.

The toolbox
For me what is even better is that you can use Sextante in your plugins or custom Python code. Sextante has a Python interface – well the whole thing is written in Python – that you can use to run a Sextante supported algorithm.
import sextante
outputs_0=sextante.runalg("grass:v.crossbones", /file, 0, ,, 1, 2, 3, 4, 1=3.0,2=8.0,5=6.0,8=6.0,11=6.0,14=6.0, None)
outputs_1=sextante.runalg("grass:v.delaunay", outputs_0['output'], True, True, None)
outputs_2=sextante.runalg("grass:v.dissolve", outputs_0['output'], , None)
Victor has created a blog to cover some Sextante recipes at QGIS-SEXTANTE cookbook/. There are also some really cool example of Sextante in use at:
Massive amount of composer additions
This last feature, or rather feature set, comes from the sponsorship and support of the World Bank, Australia-Indonesia Facility for Disaster Reduction, Geoscience Australia and the GFDRR. Most of this work was done to aid in the development of a new QGIS plugin called inaSAFE, which has also received some great praise
“(InaSAFE) is very beneficial for all of us. It’s a good example of our partnership.”
Dr Susilo Bambang Yudhoyono – President of Indonesia
Some of the improvements include:
- A new loadFromTemplate method, in the API, that can do text replacement in the QGIS composer template.
- Better support for EPSG:4326 scale bars
- Multipage in one composer
- Automatic overview frame in map frame
- HTML frame
- Zebra style grid frame border
- More control of grid labels. Inside, outside, disabled
- etc, etc

These are great additions to the QGIS composer and I have already used the overview frame feature along with the new atlas integration to make some quick nice looking map books. \
A huge thanks to the World Bank, Australia-Indonesia Facility for Disaster Reduction, Geoscience Australia and the GFDRR, and all the developers included.
You can see some of the output that InaSAFE generates using some of these new features at http://quake.linfiniti.com/
P.S The World Bank also sponsored the new raster Save As.. ability just like we have for vector layers.
Filed under:
Open Source,
qgis Tagged:
FOSSGIS,
gis,
Open Source,
osgeo,
qgis,
Quantum GIS 

![]()


