Related Plugins and Tags

QGIS Planet

Color Ramp Improvements in Upcoming QGIS 3.0

QGIS’ handling of color ramps has just gotten much better with a series of improvements we committed to the open source project’s upcoming version 3.0.

This slide goes through brief summary of changes: Color ramp handling, made fun! Color ramp handling, made fun!

On the developer front, one nice improvement is the addition of an invert() function directly attached to color ramp classes (QgsColorRamp and its children). This removed the need for symbol layers and renderers to implement individual invert-related functions; those are now served with a customized source color ramp, with edited steps and/or reversed order already taken into account.

GDAL 2.1 packaged for Fedora 23 and 24

GDAL logoThe new GDAL 2.1 is now also packaged for Fedora 23 and 24 which is possible due to the tireless efforts of various Fedora packagers.

Repo: https://copr.fedorainfracloud.org/coprs/neteler/GDAL/

Installation Instructions:

su

# Fedora 23+24:
# install this extra repo
dnf copr enable neteler/GDAL

# A) in case of update, simply
dnf update

# B) in case of new installation (gdal-devel is optional)
dnf install gdal gdal-python gdal-devel

The post GDAL 2.1 packaged for Fedora 23 and 24 appeared first on GFOSS Blog | GRASS GIS Courses.

QGIS 2.18 packaged for Fedora 23 and 24

qgis-icon_smallThanks to the work of Volker Fröhlich and other Fedora packagers I was able to create RPM packages of QGIS 2.18 Las Palmas for Fedora 23 and 24 using Fedora’s COPR platform.

Repo: https://copr.fedorainfracloud.org/coprs/neteler/QGIS-2.18-Las-Palmas

The following packages can now be installed:

  • qgis 2.18.0
  • qgis-debuginfo 2.18.0
  • qgis-devel 2.18.0
  • qgis-grass 2.18.0
  • qgis-python 2.18.0
  • qgis-server 2.18.0

Installation instructions (run as “root” user or use “sudo”):

su

# Fedora 23, Fedora 24:
dnf copr enable neteler/QGIS-2.18-Las-Palmas
dnf update
# note: the "qca-ossl" package is the OpenSSL plugin for QCA
dnf install qgis qgis-grass qgis-python qca-ossl

Enjoy!

The post QGIS 2.18 packaged for Fedora 23 and 24 appeared first on GFOSS Blog | GRASS GIS Courses.

QGIS 3.0 + Qt5: Major Improvements in Text Shaping for Complex Languages

TL;DR if all goes according to plan, the next major version of QGIS will feature an updated set of core libraries; among the many benefits this will bring is support for proper rendering for a whole new range of complex languages

QGIS has long been recognized for its excellent Unicode encoding support which enables handling of data and the rendering of maps in a wide range of languages, including but not limited to complex Indic-based writing sytems such as Khmer or Lao.

This is possible in large part due to QGIS’ underlying foundation: Qt. As part of the forthcoming 3.0 release, QGIS is planning to leave Qt4 behind – which has for years now gone into maintenance-only mode - and upgrade to actively developed Qt5, the framework's latest version. This is a significant change and it is cause for celebration as it will come with a wide range of ameliorations all around, across all platforms.

Over here, we are particularly excited about one specific improvement: the revamped text shaping engine.

The what?

Text shaping is the process through which text is converted into glyphs and positioned to form characters. In Qt, that process is handled by a library called harfbuzz. Under Qt4, the library relies on its first generation codebase. Under Qt5 however, a rebooted library codebase (referred to as harfbuzz-ng) is used.

The difference between those two libraries? Over four years worth of improvements! The source tree of the original harfbuzz library saw its last commit on July 30, 2012. The harfbuzz-ng tree however is actively developed, with its latest release, 1.3.0, dating July 21, 2016.

Tangible benefits

Based in Southeast Asia, we routinely produce maps featuring complex languages from the region. One such language is Burmese, which Qt4 simply does not support due to its use of harfbuzz’s first generation codebase.

When rendering Burmese language with QGIS compiled against Qt4, things looked like this: Oh-ho

The glyphs’ shapes and positioning are all wrong, resulting in illegible text. For those who are not familiar with Indic-based languages such as Burmese, the above would be like taking the following text “I love QGIS!” and rendering it “LvQg e! SIo”.

When compiled against Qt5, powered by harfbuzz-ng, QGIS properly shapes Burmese text: Haa

Hurray! 🎉

For those interested in building QGIS against Qt5, follow the instructions on this post by OpenGIS.

Note: Windows users have not – contrary to Linux users - been virtually stuck in 2012 when it comes to text rendering as Qt4 defers to the system’s uniscribe library to do shaping; uniscribe is actively developed by Microsoft with new versions shipped alongside Windows updates.

The Little Things That Matter: Localizing Numerals in Upcoming QGIS 3.0

When producing localized cartographic products, we often have to render numbers - integer and float values - in languages that do not make use of Arabic numerals. For instance, in the map above, area values (in red) are rendered in Thai, based on a numerical field.

In QGIS, until now, users could create an expression-based label that would use a series of replace() function embedded into one another against an numerical field to dynamically localize the numbers:

replace(replace(replace(replace(replace(replace(replace(replace(replace(replace(“my_integer_field”,'0','๐'),'1','๑'),'2','๒'),'3','๓'),'4','๔'),'5','๕'),'6','๖'),'7','๗'),'8','๘'),'9','๙')

To say it didn’t look very good is a gross understatement.

In upcoming version 3.0, the expression engine’s replace() function got upgraded to support arrays (and map) replacement parameters, making for a much cleaner syntax.

For e.g., this is how an expression to convert Arabic numerals into Thai numerals look like:

replace(“my_integer_field”,map('0','๐','1','๑','2','๒','3','๓','4','๔','5','๕','6','๖','7','๗','8','๘','9','๙'))

With a simple replace call, QGIS now allows for on-the-fly localization of number fields. Couple that with the virtual fields feature, users can also have the localized values show up in the attribute table:

I can see!

Style Management Improvements in Upcoming QGIS 3.0

Over the last few weeks, we’ve been busy improving the user interface as well as adding features to QGIS’ style management system. The end result is a streamlined experience with better exposure to saved symbols’ management tools such as tagging and a newly-implemented favorites system.

This slide offers an brief overview of the changes, part of upcoming QGIS 3.0: style management: what's new

We also took the time to update the default set of saved symbols shipped with QGIS: Image description

The new set better serves users looking for usable predefined set of symbols. It also does a good job at reflecting the cartographic capabilities of the software.

For adventurous Linux-based OS users able to compile QGIS, these improvements are now available on the master branch. For Windows users, work is under way to make QGIS 3.0’s underlying libraries available.

Movement data in GIS #4: variations over time

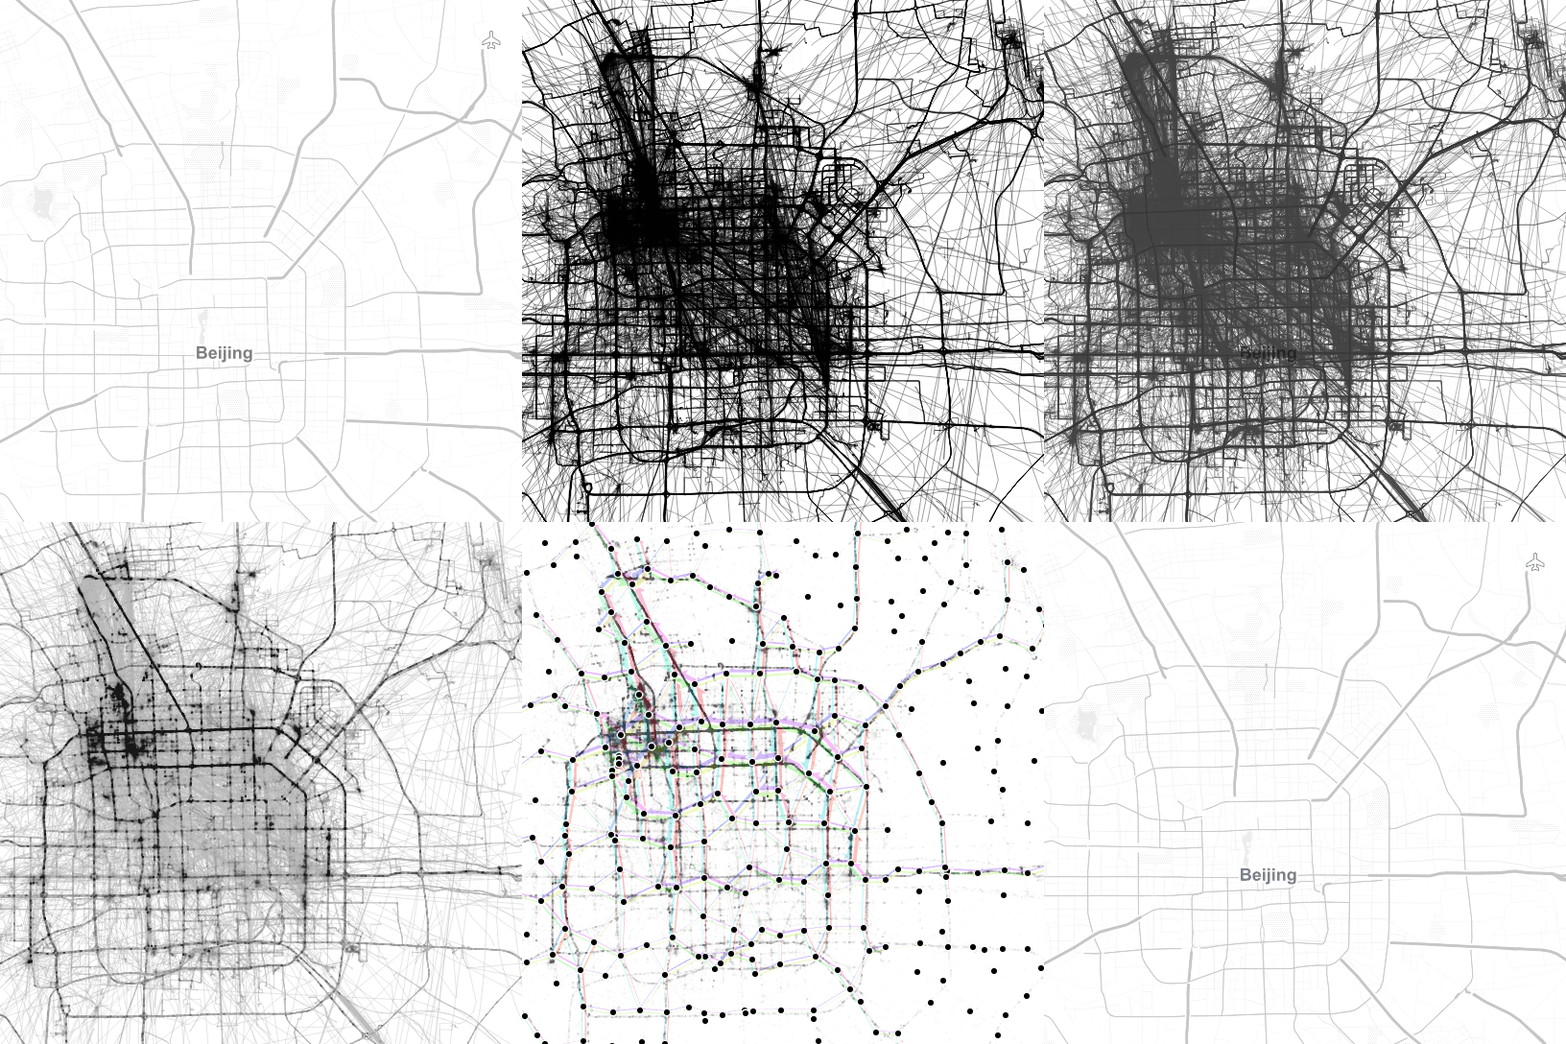
In the previous post, I presented an approach to generalize big trajectory datasets by extracting flows between cells of a data-driven irregular grid. This generalization provides a much better overview of the flow and directionality than a simple plot of the original raw trajectory data can. The paper introducing this method also contains more advanced visualizations that show cell statistics, such as the overall count of trajectories or the generalization quality. Another bit of information that is often of interest when exploring movement data, is the time of the movement. For example, at LBS2016 last week, M. Jahnke presented an application that allows users to explore the number of taxi pickups and dropoffs at certain locations:

By adopting this approach for the generalized flow maps, we can, for example, explore which parts of the research area are busy at which time of the day. Here I have divided the day into four quarters: night from 0 to 6 (light blue), morning from 6 to 12 (orange), afternoon from 12 to 18 (red), and evening from 18 to 24 (dark blue).

 (data credits: GeoLife project,

Aggregated trajectories with time-of-day markers at flow network nodes (data credits: GeoLife project, map tiles: Carto, map data: OSM)

The resulting visualization shows that overall, there is less movement during the night hours from midnight to 6 in the morning (light blue quarter). Sounds reasonable!

One implementation detail worth considering is which timestamp should be used for counting the number of movements. Should it be the time of the first trajectory point entering a cell, or the time when the trajectory leaves the cell, or some average value? In the current implementation, I have opted for the entry time. This means that if the tracked person spends a long time within a cell (e.g. at the work location) the trip home only adds to the evening trip count of the neighboring cell along the trajectory.

Since the time information stored in a PostGIS LinestringM feature’s m-value does not contain any time zone information, we also have to pay attention to handle any necessary offsets. For example, the GeoLife documentation states that all timestamps are provided in GMT while Beijing is in the GMT+8 time zone. This offset has to be accounted for in the analysis script, otherwise the counts per time of day will be all over the place.

Using the same approach, we could also investigate other variations, e.g. over different days of the week, seasonal variations, or the development over multiple years.


blog:borys:2010_01_z_qgisem_wsrod_zwierzat

Miło nam poinformować, że od rewizji 12703, QGIS wzbogacił się w od dawna wyczekiwaną obsługę odbiorników GPS w czasie rzeczywistym. Panel umożliwia podążanie widoku mapy za aktualnym położeniem, automatyczną digitalizację śladu na żywo, import obiektów z odbiornika i wiele innych.

Let’s make a big funding push for QGIS 3.0!

In 2017 we are planning to release QGIS 3.0. This new major version will become the basis of the next LTR release (QGIS 3.2) and is set to be a sea-change in the development of QGIS. It will modernize the architecture to get rid of many legacy issues that we were unable to resolve in the minor release series of 2.x releases. For example we are switching to Qt5, Python3 stripping out deprecated API’s, cleaning away many old code artifacts, and making a huge range of under the hood tweaks to improve the performance and stability of QGIS. Here are some of the other key issues that need to be worked on before we can release QGIS 3.0:

  • QGIS Server needs to be updated to work with QGIS 3.0
  • QGIS Composer needs an overhaul

There are many more ‘under the hood’ items like this that we would like sort out before we can release QGIS 3.0.

Recently we announced the winners for our new grant programme which directly funds developers wishing to make improvements to the QGIS project. We would like to amp things up a notch further and thus with this blog post we would like to make this appeal:

  • If you are an individual user please consider making a donation to the project (donations can be made by PayPal or by direct bank transfer).
  • If you work for a company, please consider becoming a project sponsor. Our entry level sponsorship is not a lot of money and will make a great contribution to the project. We are still looking for our first platinum sponsor – perhaps your company could be the first! Here is the list of sponsorship levels for quick reference:
Euros Sponsorship level
27,000+ Platinum Sponsor
9,000+ Gold Sponsor
3,000+ Silver Sponsor
500+ Bronze Sponsor
  • If you are a company that makes use of contract QGIS developers, include in your contracts a provision for the developer to get your new features into the 3.0 code base with a nice set of tests so that the burden does not get passed upstream to volunteer developers to port your features to QGIS 3.0.
  • If you are a company that has in-house QGIS developers, consider allocating some of their time to supporting the QGIS 3.0 development effort.
  • If you are a country user group, please try to hold a funding drive within your user group and pass the funds either to the upstream QGIS.ORG project or support developers who are in your country to do bug fixing and implementation work for QGIS 3.0.

If you have other ideas about how to support the effort we will be glad to hear them! We will put as much money from QGIS.ORG funds as possible into developers that are willing and able to work on the preparation of QGIS 3.0.

A huge thank you to all of those that have already contributed time and money into the effort to get QGIS 3.0 ready for release!


QGIS UK Edinburgh: an overview

6th Scottish QGIS UK user group meeting
Informatics Forum, University of Edinburgh, Edinburgh
3rd November 2016

A full house with all tickets sold. Our biggest event yet. A last minute decision to video the talks. A first ever raffle to raise funds for the QGIS project. More than half the attendees were at a QGIS user group for the first time. All sectors represented and a range of talks from accessible introductions to QGIS functionality to wonderful technical geekery to varied FOSS4G use cases.

Slides

Video: https://youtu.be/kHDZmmzKU4U

How deep is your loch?
Phil Taylor (@scienceandmaps) from CEH opened up the day with a detailed explanation of how he lovingly captured the plumbed depths of four Scottish lochs and turned them into interactive 3D visualisations. You can see his results at http://contours.org.uk/bathymetry

Slides

Video: https://youtu.be/-q021mocJdI

QGIS Server: the good, not-so-good and the ugly
Fiona Hemsley-Flint showed us the exploratory work she and her team have done with QGIS Server as a possible replacement for MapServer and Cadcorp GeognoSIS. QGIS server is capable and can render complex styles and labels well but was generally 5 to 10 times slower than GeognoSIS in rendering the maps.

Slides

Video: https://youtu.be/TPoOOkurtlA

Installing QGIS on a Network
Tom Armitage (@MapNav_Tom) from the University of Edinburgh gave a quick run through of the requirements for installing QGIS 2.14.3 across 3000 computers.

Slides

Video: https://youtu.be/fv3fgI-u084

Mapping narrative: QGIS in the Digital Humanities 
Anouk Lang (@e_a_lang) from the University of Edinburgh explained how mapping and visualisation were used to engage students and explore literature in a different way.

Slides

Video: https://youtu.be/XlADXIrC9PE

QGIS Plug-in for Parallel Processing in Terrain Analysis
Art Lembo (@artlembo) from Salisbury University, Maryland, USA got everyone excited about advances in personal computing power and how graphics cards can be harnessed to speed up spatial processing. The trouble with geographic data is that it is usually a large chunk of data with relatively little processing required. Parallel processing likes small chunks of data that need huge amounts of processing. The plugin hits the limit of the ability of Python to pass through more data. That’s how fast the graphics cards are.

Slides

Video: https://youtu.be/mkDMFiVLdkg

Viewshed analysis and how to find the heart of Scotland
Neil Benny (@bennymapper) from thinkWhere gave a very useful overview of how to use the different tools in QGIS to generate viewsheds which a lot people at the event could see a use for in their workflows. See https://blog.thinkwhere.com/2016/08/25/viewsheds-and-visibility-analysis-in-qgis/ for more information.

Slides

Video: https://youtu.be/LOPuw2-oaPA

qgis2web: geocrustin’
Tom Chadwin (@tomchadwin) from NNPA gave an entertaining talk on how and why he developed the qgis2web plugin. He showed us how to use it and you can see why it is such a popular extension to QGIS.

Video: https://youtu.be/4gyW1aeoTvU

QGIS 3.0, WMTS previews and XYZ support in QGIS 2.18
Pete Wells (@lutraconsulting) from Lutra Consulting gave a more technical talk on some behind the scenes work that they have been doing to make using QGIS 3.0 even better for the user. No more waiting for the base map to load as the WMS server thinks about the request – tiled services quickly and seamlessly fill the screen. For more information see http://www.lutraconsulting.co.uk/blog/2016/10/26/qgis-xyz-tile-wmts-preview/

Video: https://youtu.be/Q83W0XJ2Y3g

Decision Support Systems in Forestry
Stephen Bathgate (@Forestry_Research) from the Forestry Commission gave a real world example of how a GIS, and then an open source GIS infrastructure, delivered improved workflows, better efficiencies and made a smaller workforce more effective.

Slides

Video: https://youtu.be/94_y1qbqk-w

Collecting spatial survey data with Leaflet and OpenStreetMap
Louise Sing (@sing_louise) from Forestry Commission gave a lightning talk on how she used tips learned at previous QGIS user group meetings to put together a simple Leaflet map to collection information about how people use different areas of forest.
Slides

Video: https://youtu.be/-SCvsqy6txU

Indoor 3D routing with QGIS and pgRouting
Tim Manners (@tmnnrs) from Ordnance Survey demonstrated the interactive 3D route solving application created using QGIS and the QGIS2threeJS plugin. It can be used to route between locations spread across multiple floors in a building. It can take into account width and height restrictions such as doorways and lifts and can be used to model mass evacuations of a workforce.

Slides

Video: https://youtu.be/H-v9SXwc3BQ

Using QGIS for wildlife surveys and reporting
Andrew Whitelee (@VerdantWildlife) from Taylor Wildlife lead an interactive talk highlighting the difficulty of undertaking robust repeatable wildlife surveys in the great outdoors. He showed how the use of high quality mapping and GPS tracking improved the quality of the surveys and how much sense the use of open source software made for small enterprises.

Slides

Video: https://www.youtube.com/watch?v=pJhXdYqEmuQ

Them Thar Hills: shadin’, texturin’, blendin’
Ross McDonald (@mixedbredie) from Angus Council gave a lightning talk on different ways to generate hillshaded images from elevation models. Regular hillshaded images can be enhanced by generating texture shaded images. Texture shading enhances the drainage network and the visual hierarchy of the landscape. Blender can be used to create rich shaded relief by modelling real sunlight and reflection across the landscape. See textureshading.com for more information or press F7 in a recent version of QGIS to open the live style dock.

Slides

Video: https://www.youtube.com/watch?v=0nkNgtKGbw4

DOHA: Doha Online Historical Atlas
Michal Michalski from Scottish Government and the DOHA project showcased the mapping work he has been helping with in Doha and the archaeological investigation into the origins of the city. The website is a fantastic example of the integration of different resources including historic maps, photographs, videos and historic records. See http://originsofdoha.org/doha/index.html for more information.

Video: https://www.youtube.com/watch?v=xYegqHRoAic

3D indoor maps with QGIS
Tim Jenks (@eeGeo) from eeGeo gave a short talk on how QGIS and other tools were used to build navigable 3D maps of cities and buildings. See https://www.youtube.com/watch?v=c6T_v_e5Re8 for a demo.

Slides

Tom Armitage closed with some remarks on how open source software works and how the QGIS community supports the QGIS project. Roger Garbett managed the raffle (all 500 tickets sold!) with some great prizes (Splash-Maps voucher, QGIS t-shirt voucher, OS colouring map book, Art Lembo’s text book on geospatial processing, stickers and others) the proceeds of which will go to the QGIS project. There is, after all, no such thing as a free lunch. Even if fantastic and generous sponsors – Ordnance Survey, thinkWhere, Angus Council, Cawdor Forestry, eeGeo and EDINA – give us a lovely selection of food and drink (thanks BlueSkyCatering) and a top-class venue for a brilliant day out.

Slides

Video: https://youtu.be/cVEPbogf0To

The day ended in the Potting Shed with (strong) cask ales and ciders refreshing parched throats. Always a great way to wrap things up.

qgisug_sponsors_white

QGIS 2.18 ‘Las Palmas’ is released!

We are pleased to announce the release of QGIS 2.18 ‘Las Palmas’. The city of Las Palmas de Gran Canaria was the location of our autumn 2015 developer meeting.

This is the last release in the 2.x series. The current Long Term Release (LTR) remains version 2.14.x. This release provides incremental improvements over our previous release. The majority of activity is currently focused towards the development of QGIS 3.0 which is our next generation release planned for the end of the first quarter of 2017.

We would like to thank the developers, documenters, testers and all the many folks out there who volunteer their time and effort (or fund people to do so). From the QGIS community we hope you enjoy this release! If you wish to donate time, money or otherwise get involved in making QGIS more awesome, please wander along to qgis.org and lend a hand!

QGIS is supported by donors and sponsors. A current list of donors who have made financial contributions large and small to the project can be seen on our donors list. If you would like to become and official project sponsor, please visit our sponsorship page for details. Sponsoring QGIS helps us to fund our six monthly developer meetings, maintain project infrastructure and fund bug fixing efforts. A complete list of current sponsors is provided below – our very great thank you to all of our sponsors!

QGIS is Free software and you are under no obligation to pay anything to use it – in fact we want to encourage people far and wide to use it regardless of what your financial or social status is – we believe empowering people with spatial decision making tools will result in a better society for all of humanity.


Movement data in GIS #3: visualizing massive trajectory datasets

In the fist two parts of the Movement Data in GIS series, I discussed modeling trajectories as LinestringM features in PostGIS to overcome some common issues of movement data in GIS and presented a way to efficiently render speed changes along a trajectory in QGIS without having to split the trajectory into shorter segments.

While visualizing individual trajectories is important, the real challenge is trying to visualize massive trajectory datasets in a way that enables further analysis. The out-of-the-box functionality of GIS is painfully limited. Except for some transparency and heatmap approaches, there is not much that can be done to help interpret “hairballs” of trajectories. Luckily researchers in visual analytics have already put considerable effort into finding solutions for this visualization challenge. The approach I want to talk about today is by Andrienko, N., & Andrienko, G. (2011). Spatial generalization and aggregation of massive movement data. IEEE Transactions on visualization and computer graphics, 17(2), 205-219. and consists of the following main steps:

  1. Extracting characteristic points from the trajectories
  2. Grouping the extracted points by spatial proximity
  3. Computing group centroids and corresponding Voronoi cells
  4. Deviding trajectories into segments according to the Voronoi cells
  5. Counting transitions from one cell to another

The authors do a great job at describing the concepts and algorithms, which made it relatively straightforward to implement them in QGIS Processing. So far, I’ve implemented the basic logic but the paper contains further suggestions for improvements. This was also my first pyQGIS project that makes use of the measurement value support in the new geometry engine. The time information stored in the m-values is used to detect stop points, which – together with start, end, and turning points – make up the characteristic points of a trajectory.

The following animation illustrates the current state of the implementation: First the “hairball” of trajectories is rendered. Then we extract the characteristic points and group them by proximity. The big black dots are the resulting group centroids. From there, I skipped the Voronoi cells and directly counted transitions from “nearest to centroid A” to “nearest to centroid B”.

(data credits: GeoLife project)

From thousands of individual trajectories to a generalized representation of overall movement patterns (data credits: GeoLife project, map tiles: Stamen, map data: OSM)

The resulting visualization makes it possible to analyze flow strength as well as directionality. I have deliberately excluded all connections with a count below 10 transitions to reduce visual clutter. The cell size / distance between point groups – and therefore the level-of-detail – is one of the input parameters. In my example, I used a target cell size of approximately 2km. This setting results in connections which follow the major roads outside the city center very well. In the city center, where the road grid is tighter, trajectories on different roads mix and the connections are less clear.

Since trajectories in this dataset are not limited to car trips, it is expected to find additional movement that is not restricted to the road network. This is particularly noticeable in the dense area in the west where many slow trajectories – most likely from walking trips – are located. The paper also covers how to ensure that connections are limited to neighboring cells by densifying the trajectories before computing step 4.

trajectory_generalization

Running the scripts for over 18,000 trajectories requires patience. It would be worth evaluating if the first three steps can be run with only a subsample of the data without impacting the results in a negative way.

One thing I’m not satisfied with yet is the way to specify the target cell size. While it’s possible to measure ellipsoidal distances in meters using QgsDistanceArea (irrespective of the trajectory layer’s CRS), the initial regular grid used in step 2 in order to group the extracted points has to be specified in the trajectory layer’s CRS units – quite likely degrees. Instead, it may be best to transform everything into an equidistant projection before running any calculations.

It’s good to see that PyQGIS enables us to use the information encoded in PostGIS LinestringM features to perform spatio-temporal analysis. However, working with m or z values involves a lot of v2 geometry classes which work slightly differently than their v1 counterparts. It certainly takes some getting used to. This situation might get cleaned up as part of the QGIS 3 API refactoring effort. If you can, please support work on QGIS 3. Now is the time to shape the PyQGIS API for the following years!


GRASS GIS 7.2.0RC1 released

We are pleased to announce the first release candidate of GRASS GIS 7.2.0

What’s new in a nutshell

This is the first release candidate of the upcoming major release GRASS GIS 7.2.0.

The new GRASS GIS 7.2.0RC1 release provides more than 1900 stability fixes and manual improvements compared to the stable releases 7.0.x.

hexagons_python_editorAbout GRASS GIS 7: Its graphical user interface supports the user to make complex GIS operations as simple as possible. The updated Python interface to the C library permits users to create new GRASS GIS-Python modules in a simple way while yet obtaining powerful and fast modules. Furthermore, the libraries were significantly improved for speed and efficiency, along with support for huge files. A lot of effort has been invested to standardize parameter and flag names. Finally, GRASS GIS 7 comes with a series of new modules to analyse raster and vector data, along with a full temporal framework. For a detailed overview, see the list of new features. As a stable release series, 7.2.x enjoys long-term support.

Binaries/Installer download:

Source code download:

More details:

See also our detailed announcement:

http://trac.osgeo.org/grass/wiki/Grass7/NewFeatures (overview of new 7 stable release series)

First time users may explore the first steps tutorial after installation.

About GRASS GIS

The Geographic Resources Analysis Support System (http://grass.osgeo.org/), commonly referred to as GRASS GIS, is an Open Source Geographic Information System providing powerful raster, vector and geospatial processing capabilities in a single integrated software suite. GRASS GIS includes tools for spatial modeling, visualization of raster and vector data, management and analysis of geospatial data, and the processing of satellite and aerial imagery. It also provides the capability to produce sophisticated presentation graphics and hardcopy maps. GRASS GIS has been translated into about twenty languages and supports a huge array of data formats. It can be used either as a stand-alone application or as backend for other software packages such as QGIS and R geostatistics. It is distributed freely under the terms of the GNU General Public License (GPL). GRASS GIS is a founding member of the Open Source Geospatial Foundation (OSGeo).

The GRASS Development Team, October 2016

The post GRASS GIS 7.2.0RC1 released appeared first on GFOSS Blog | GRASS GIS Courses.

WMTS enhancement and XYZ tile native support in QGIS 2.18

In this post, we will highlight the new features we have added to QGIS 2.18 …

WMTS enhancement

The WMTS provider had not been benefiting from the the QGIS multi-threaded rendering we did earlier in QGIS 2.4.

In previous versions of QGIS, users had to wait until download of all tiles of a layer has finished in order to view the resulting map. This has now been fixed and the tiles show up in map canvas immediately as they get downloaded, improving the user experience by greatly lowering the time until something is shown.

Moreover, previously downloaded tiles from lower or higher resolutions may be used for the preview functionality in the areas where the tiles with correct resolution have not been downloaded yet.

The screencast here shows fetching and rendering a WMTS layer in QGIS 2.14 (left) and the same layer in QGIS 2.18 (right):

Support for XYZ raster tiles

There are a couple of python plugins allowing users to add XYZ tiles (e.g. Bing maps) to QGIS. The plugins only allow certain web services and it is often tricky for supporting the private ones with API keys.

In addition, there are other QGIS applications without python support (e.g. QGIS for Android devices) where they can leverage from having a native support.

Currently, you can only add XYZ tile services from the Browser panel. The video below demonstrates how to add the current precipitation and OpenStreetMap xyz tiles to your QGIS:

Sponsors

WMTS enhancements was sponsored by Land Information New Zealand. Support for XYZ tiles was funded internally.

You may also like...

Mergin Maps, a field data collection app based on QGIS. Mergin Maps makes field work easy with its simple interface and cloud-based sync. Available on Android, iOS and Windows. Screenshots of the Mergin Maps mobile app for Field Data Collection
Get it on Google Play Get it on Apple store

More icons & symbols for QGIS

The possibility to easily share plugins with other users and discover plugins written by other community members has been a powerful feature of QGIS for many years.

The QGIS Resources Sharing plugin is meant to enable the same sharing for map design resources. It allows you to share collections of resources, including but not limited to SVGs, symbols, styles, color ramps, and processing scripts.

Using the Resource Sharing plugin is like using the Plugin Manager. Once installed, you are presented with a list of available resource collections for download. You will find that there are already some really nice collections, including nautical symbols, Mapbox Maki Icons, and my Google-like OSM road style.

resourcesharing_maki

By pressing Install, the resource collection is downloaded and you can have a look at the content using the Open folder button. In case of the Mapbox Maki Icon collection, it contains a folder of SVGs:

resourcesharing_folder

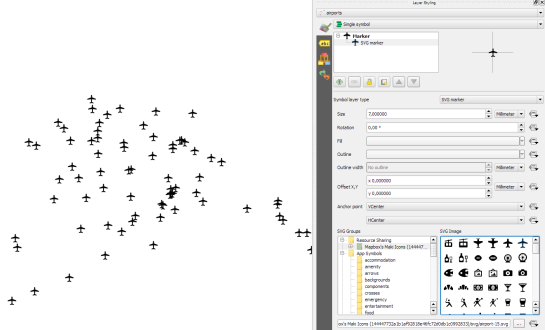
Using the new icons is as simple as opening the layer styling settings and selecting the Mapbox Maki Icons collection in the SVG group list:

resourcesharing_styling

Similarly, if you download the OSM Spatialite Googlemaps collection, its road line symbols are added to your existing list of available line symbols:

resourcesharing_roads2

By pressing the Open Library button, you get to the Style Manager where you can browse through all installed symbols and delete, rename, or categorize them.

resourcesharing_roads

The Resource Sharing plugin was developed by Akbar Gumbira during this year’s Google Summer of Code. The full documentation, including instructions for how to share your own symbols with the community, is available at www.akbargumbira.com/qgis_resources_sharing.


  • <<
  • Page 56 of 141 ( 2820 posts )
  • >>

Back to Top

Sustaining Members