Our ninjas have been so busy that less than a month after we released QField 2.4, we find ourselves with so many new features we simply can’t wait any longer to present to you the latest version of QField: 2.5 “Fancy Flamingo ?”.
Exciting new features
QField’s main new feature of this 2.5 release cycle is its brand new elevation profiling functionality which has been added to the measuring tool. Users are now able to dynamically build and analyze elevation profiles wherever they are – in the field or on their desktop – by simply drawing paths onto their maps and projects.
This is a great example of QField’s capability at bringing the power of QGIS through a UI that keeps things simple and avoids being in your way until you need it. Oh and while we’re speaking of the measuring tool, check out the new azimuth measurement!
This new version also brings multi-column support to feature forms. QField now respects the number of columns set by users in the attributes’ drag and drop designer while building and tweaking projects in QGIS. The implementation will take into account the screen availability and on narrow devices will revert to a one-column setup. Pro tip: try to change the background color of your individual groups to ease understanding of the overall feature form.
Another highlight of this release is a brand new screen lock action that can be triggered through QField’s main menu found in the side dashboard or in the map canvas menu shown when long pressing on the map itself. Once activated, QField will become unresponsive to touch and mouse events while keeping the display turned on. When locked, QField also hides tool buttons which results in a more complete view of the map extent.
Stability improvements
As with every release, our ninjas have been spending time hunting nasty bugs and improving stability and QField 2.5 is no exception. In particular, the feature form should feel more reliable and even more polished.
What a night it was. The “Best of Swiss Apps Awards” took place in Zurich yesterday, November 2, 2022. We were also nominated with QField. And in the enterprise category, the app was so convincing, that it was awarded the highest possible price. So it brought the award “Best of Swiss Enterprise App” home to Graubünden. And as cherry on the cake: QField was also nominated as finalist in the UX/UI category!
We are extremely proud and happy about the received award. And even more when we look at the contendants that won in the other categories. We’re talking companies like SBB, Swiss Life, Switzerland Tourism and, yes, Rivella ?.
If you are interested in more details, we released a press release in German and in English.
QField is an open source mobile app. The app is designed to use and edit geographically referenced data. In urban environments with 5G connectivity, but also with offline data. The mobile GIS app combines minimal design for simplicity with sophisticated technology for a versatile range of uses to bring data conveniently from the field to the offices. The app was started in 2011 and received a major rebuild in 2022.
It offers a seamless QGIS integration and is GPS-centric, with offline functionality, synchronisation options and desktop configuration. QField is designed for fieldwork: simple, but uncompromising. The app is used internationally and is the first choice for mobile GIS projects. In the city, in the countryside and in the forest.
Soon, QFieldCloud will also be launched. QFieldCloud is a cloud service integrated into QField that enables the remote provision and synchronisation of geodata and projects.
And here some moments of the award night. It was a blast!
Michael Quade enterprise jury chair congratulates on the winone of the BOSA2022 trophy360° QField projections!Happy chappiesand formally happy Laudatio
Tired of start/stop editing for every single layer in your project with mixed data sources? Starting from version 3.26, QGIS has a new transaction mode called “Buffered Transaction Groups”.
Within this mode, all layers which are not read-only are put in one “transaction group” and handled together when the actions “Toggle Editing” or “Save Layer Edits” are activated. It doesn’t matter if the layers come from different providers like GeoPackage, PostgreSQL or Shapefile. Edits are buffered locally and saved within one single transaction on all layers per provider. With this, you can store all edited layers with a single click. And in comparison to the well-known “Automatic Transaction Groups” mode you have better performance during editing and fewer problems with locking of the database when multiple users edit the same table in parallel.
To try it out; go to Project -> Properties -> Data Sources -> Transaction mode
Enjoy and let us know what you think!
Limitations:
In databases, transactions are atomic. That is, the data can be completely and correctly written, or it will be completely rolled back. With buffered transactions, QGIS tries to do the same but has less control. When writing to different providers it could happen that, if an error occurs when writing to PostgreSQL, but some data were already written in a Shapefile the rollback will be only partial. This only applies to data from different data sources.
In the past year, the build system behind QField has been ported to vcpkg, a modern C++ dependency management system. It has been a great success for QField and considerably helped to streamline efforts, improve the development experience and to guarantee an outstanding stability of the application. In this blog post we will look at the history of building QGIS based applications for mobile systems and how it has become what it is today.
As we know nowadays QGIS for Android has eventually seen the sunlight and its achievements are still the base for QGIS-based mobile apps like QField.
Sometime later we decided to modernize the build infrastructure into OSGeo4A a set of scripts where each dependency was built with a “recipe”. Modularized this way, it was easier to maintain, and general build code common for all libraries could be isolated. It was good enough to help drive QField for a couple of years, and a copy of it is still in use as the base for nowadays QGIS builds for macOS.
When we decided to make QField also available on other platforms like iOS, Windows and macOS we quickly realized that duplicating build chains scales really bad and maintaining this is an immense effort we wanted to avoid. There are a couple of existing C++ dependency management systems, none of which convinced us ultimately. Lucky for us a mail on the QGIS mailing list mentioned a new one called vcpkg which looked very promising.
A couple of days later we had a build for Windows and later in the same year for macOS. With many dependencies already available in modern versions. Cheers.
What’s left to do than just enable it for Android, and all our problems are suddenly solved? Alas, it’s not so easy. Cross-compiling is always a bit trickier. And so we started another journey to improve the situation. After a while, we had a working build chain based on vcpkg for Android in our R&D labs. Interestingly, this added a couple of features just because the community around vcpkg had already added them. For example using COG-based raster data via HTTP was suddenly working (for the record: thanks to the availability of curl which we never took care of adding ourselves in OSGeo4A).
Soon after we also wanted to try building for iOS with vcpkg, which after a few attempts also was successful, and even managed to resolve some weird crashes and other issues we had experienced with the old buildchain.
The main benefit was that we could upgrade the QGIS base libraries in one single place for every platform, in an isolated branch without playing the Jenga game on each upgrade.
The only unfinished business we still had was that support for iOS and Android was still available only in our own vcpkg fork.
So the last few weeks and months we have been working closely with upstream to bring building for Android and iOS up to the same level as desktop platforms. The relevant parts are now in a clean state.
Advantages of this approach:
• Mutualized efforts on all the base libraries, also with programmers outside the geoverse
• A vibrant community that ensures a noticeably fast upgrade of libraries
• A clean dependency management system
• A consistent set of dependency versions (gdal, geos, libpq, …) across all platforms
• A clean caching system that will only recompile reverse dependencies on updates
• We can upgrade a dependency in an isolated branch and only release it when it works on all platforms
• We can optimize the code for a given set of dependency versions and if a bug is fixed in a certain dependency version, we are sure we can ship this fix on all platforms promptly
• We maintain the QField source code as well as dependency versions in a single repository, what makes development more streamlined
Big thanks go to Alexander Neumann and Kai Pastor who both stand out for doing things the right and future-proof way.
As always, things come at a price, there was a steep learning curve involved, and some edge cases require attention. However, we are thrilled by the simplification this has brought us.
If you are maintaining a customized fork of QField, it is now a good time to start upgrading to vcpkg, since OSGeo4A has been archived and will no longer be maintained. The developer documentation of QField has been updated with relevant instructions.
Starting with QField 2.2, users can fully rely on animation capabilities that have made their way into QGIS during its last development cycle. This can be a powerful mean to highlight key elements on a map that require special user attention.
The example below demonstrates a scenario where animated raster markers are used to highlight active fires within the visible map extent. Notice how the subtle fire animation helps draw viewers’ eyes to those important markers.
The second example below showcases more advanced animated symbology which relies on expressions to animate several symbol properties such as marker size, border width, and color opacity. While more complex than simply adding a GIF marker, the results achieved with data-defined properties animation can be very appealing and integrate perfectly with any type of project.
You’ll quickly notice how smooth the animation runs. That is thanks to OPENGIS.ch’s own ninjas having spent time improving the map canvas element’s handling of layers constantly refreshing. This includes automatic skipping of frames on older devices so the app remains responsive.
Amongst all the processing algorithms already available in QGIS, sometimes the one thing you need is missing.
This happened not a long time ago, when we were asked to find a way to continuously visualise traffic on the Swiss motorway network (polylines) using frequently measured traffic volumes from discrete measurement stations (points) alongside the motorways. In order to keep working with the existing polylines, and be able to attribute more than one value of traffic to each feature, we chose to work with the M-values. M-values are a per-vertex attribute like X, Y or Z coordinates. They contain a measure value, which typically represents time or distance. But they can hold any numeric value.
In our example, traffic measurement values are provided on a separate point layer and should be attributed to the M-value of the nearest vertex of the motorway polylines. Of course, the motorway features should be of type LineStringM in order to hold an M-value. We then should interpolate the M-values for each feature over all vertices in order to get continuous values along the line (i.e. a value on every vertex). This last part is not yet existing as a processing algorithm in QGIS.
This article describes how to write a feature-based processing algorithm based on the example of M-value interpolation along LineStrings.
Feature-based processing algorithm
The pyqgis class QgsProcessingFeatureBasedAlgorithmis described as follows: “An abstract QgsProcessingAlgorithm base class for processing algorithms which operates “feature-by-feature”.
Feature based algorithms are algorithms which operate on individual features in isolation. These are algorithms where one feature is output for each input feature, and the output feature result for each input feature is not dependent on any other features present in the source. […]
Using QgsProcessingFeatureBasedAlgorithm as the base class for feature based algorithms allows shortcutting much of the common algorithm code for handling iterating over sources and pushing features to output sinks. It also allows the algorithm execution to be optimised in future (for instance allowing automatic multi-thread processing of the algorithm, or use of the algorithm in “chains”, avoiding the need for temporary outputs in multi-step models).”
In other words, when connecting several processing algorithms one after the other – e.g. with the graphical modeller – these feature-based processing algorithms can easily be used to fill in the missing bits.
Compared to the standard QgsProcessingAlgorithm the feature-based class implicitly iterates over each feature when executing and avoids writing wordy loops explicitly fetching and applying the algorithm to each feature.
Just like for the QgsProcessingAlgorithm (a template can be found in the Processing Toolbar > Scripts > Create New Script from Template), there is quite some boilerplate code in the QgsProcessingFeatureBasedAlgorithm. The first part is identical to any QgsProcessingAlgorithm.
After the description of the algorithm (name, group, short help, etc.), the algorithm is initialised with def initAlgorithm, defining input and output.
While in a regular processing algorithm now follows def processAlgorithm(self, parameters, context, feedback), in a feature-based algorithm we use def processFeature(self, feature, context, feedback). This implies applying the code in this block to each feature of the input layer.
! Do not use def processAlgorithm in the same script, otherwise your feature-based processing algorithm will not work !
Interpolating M-values
This actual processing part can be copied and added almost 1:1 from any other independent python script, there is little specific syntax to make it a processing algorithm. Only the first line below really.
In our M-value example:
    def processFeature(self, feature, context, feedback):

        try:
            geom = feature.geometry()
            line = geom.constGet()
            vertex_iterator = QgsVertexIterator(line)
            vertex_m = []

            # Iterate over all vertices of the feature and extract M-value

            while vertex_iterator.hasNext():
                vertex = vertex_iterator.next()
                vertex_m.append(vertex.m())

            # Extract length of segments between vertices

            vertices_indices = range(len(vertex_m))
            length_segments = [sqrt(QgsPointXY(line[i]).sqrDist(QgsPointXY(line[j])))
                for i,j in itertools.combinations(vertices_indices, 2)
                if (j - i) == 1]

            # Get all non-zero M-value indices as an array, where interpolations
              have to start

            vertex_si = np.nonzero(vertex_m)[0]

            m_interpolated = np.copy(vertex_m)

            # Interpolate between all non-zero M-values - take segment lengths between
              vertices into account

            for i in range(len(vertex_si)-1):
                first_nonzero = vertex_m[vertex_si[i]]
                next_nonzero = vertex_m[vertex_si[i+1]]
                accum_dist = itertools.accumulate(length_segments[vertex_si[i]
                                                                  :vertex_si[i+1]])
                sum_seg = sum(length_segments[vertex_si[i]:vertex_si[i+1]])
                interp_m = [round(((dist/sum_seg)*(next_nonzero-first_nonzero)) +
                            first_nonzero,0) for dist in accum_dist]
                m_interpolated[vertex_si[i]:vertex_si[i+1]] = interp_m

            # Copy feature geometry and set interpolated M-values,
              attribute new geometry to feature

            geom_new = QgsLineString(geom.constGet())

            for j in range(len(m_interpolated)):
                geom_new.setMAt(j,m_interpolated[j])

            attrs = feature.attributes()

            feat_new = QgsFeature()
            feat_new.setAttributes(attrs)
            feat_new.setGeometry(geom_new)

        except Exception:
            s = traceback.format_exc()
            feedback.pushInfo(s)
            self.num_bad += 1
            return []

        return [feat_new]
In our example, we get the feature’s geometry, iterate over all its vertices (using the QgsVertexIterator) and extract the M-values as an array. This allows us to assign interpolated values where we don’t have M-values available. Such missing values are initially set to a value of 0 (zero).
We also extract the length of the segments between the vertices. By gathering the indices of the non-zero M-values of the array, we can then interpolate between all non-zero M-values, considering the length that separates the zero-value vertex from the first and the next non-zero vertex.
For the iterations over the vertices to extract the length of the segments between them as well as for the actual interpolation between all non-zero M-value vertices we use the library itertools. This library provides different iterator building blocks that come in quite handy for our use case.
Finally, we create a new geometry by copying the one which is being processed and setting the M-values to the newly interpolated ones.
And that’s all there is really!
Alternatively, the interpolation can be made using the interp function of the numpy library. Some parts where our manual method gave no values, interp.numpy seemed more capable of interpolating. It remains to be judged which version has the more realistic results.
Styling the result via M-values
The last step is styling our output layer in QGIS, based on the M-values (our traffic M-values are categorised from 1 [a lot of traffic -> dark red] to 6 [no traffic -> light green]). This can be achieved by using a Single Symbol symbology with a Marker Line type “on every vertex”. As a marker type, we use a simple round point. Stroke style is “no pen” and Stroke fill is based on an expression:
with_variable(

'm_value', m(point_n($geometry, @geometry_point_num)),

	CASE WHEN @m_value = 6
		THEN color_rgb(140, 255, 159)

		WHEN @m_value = 5
			THEN color_rgb(244, 252, 0)

		WHEN @m_value = 4
			THEN color_rgb(252, 176, 0)

		WHEN @m_value = 3
			THEN color_rgb(252, 134, 0)

		WHEN @m_value = 2
			THEN color_rgb(252, 29, 0)

		WHEN @m_value = 1
			THEN color_rgb(140, 255, 159)

		ELSE
			color_hsla(0,100,100,0)

	END
)
And voilà! Wherever we have enough measurements on one line feature, we get our motorway network continuously coloured according to the measured traffic volume.
Motorway network – the different lanes are regrouped for each direction. M-values of the vertices closest to measurement points are attributed the measured traffic volume. The vertices are coloured accordingly.Trafic on motorway network after “manual” M-value interpolation. Trafic on motorway network after M-value interpolation using numpy.
One disclaimer at the end: We get this seemingly continuous styling only because of the combination of our “complex” polylines (containing many vertices) and the zoomed-out view of the motorway network. Because really, we’re styling many points and not directly the line itself. But in our case, this is working very well.
If you’d like to make your custom processing algorithm available through the processing toolbox in your QGIS, just put your script in the folder containing the files related to your user profile:
profiles > default > processing > scripts
You can directly access this folder by clicking on Settings > User Profiles > Open Active Profile Folder in the QGIS menu.
That way, it’s also available for integration in the graphical modeller.
Extract of the GraphicalModeler sequence. “Interpolate M-values neg” refers to the custom feature-based processing algorithm described above.
You can download the above-mentioned processing scripts (with numpy and without numpy) here.
Good things take time (and sponsors), and we wanted our Apple users to enjoy the same solid and seamless experience as our Android users. So we took the time needed and ran beta testing of QField for multiple months. Thanks to all the community feedback and to the uncountable work hours put in by our development team, today we released QField on the iOS Appstore.
Following the naming scheme for the 2.X series, we decided to name QField 2.4 Ecstatic Elk (Cervus Canadensis), honouring “the land of maple leaf ??”, the home country of Mathieu (QField lead UX designer) and origin of some recent funding.
New features, improvements and demo projects
Releasing for iOS is the main news for QField 2.4, but we also added some new features as well as fixed some annoying bugs we had.
New demo projects showing many new QField features. We merged the Bee simple and Bee advanced projects into one bees project and added a wastewater management project that comes with beautiful dark and light themes.
The new features include atlas-driven print layouts that can now be printed through the main menu’s print to PDF item and dragging files onto an iOS device via USB Cable with iTunes support.
Some more UX improvements can be noticed when sending or exporting datasets via the project folder. All sidecars will now be considered so that, for example, you can send your edited shapefiles via your favourite email or messenger app.
Finally, QFieldCloud’s projects are better sorted, and its community tab is now functional.
Bugfixes
During the last sprint, we greatly improved QField’s automated testing framework, greatly decreasing the risks of regressions slipping into future releases. We also ensured that QGIS-shipped SVG markers will now render properly within QField.
Finally, we fixed freehand toggling when using a stylus and ensured the changelog popup doesn’t overlap with the OS’ status bar.
Best of Swiss Apps Nomination
We put a lot of effort into ensuring that QField, is of the highest possible quality, so being nominated as a finalist for the BestOfSwissApps award was even sweeter ???
Beginning of November, we’ll know more about the outcome of the votes ?
QFieldCloud
QFieldCloud has been in Free BETA for half a year now. Thanks to the precious help of the many early adopters (we already have over 30K users), we were able to identify and fix plenty of issues. In the last months, our service status page has been consistently looking super-green
We are extremely happy with how the system is behaving and are even happier with the feedback we are receiving!
As of today, we’ve implemented all the functionality that we want to have for the GA release. All we are missing is finishing testing the billing and payment system and rolling the drums ?
We put a lot of effort into ensuring that QField, is of the highest possible quality and invest a lot of developer time in QField, QFieldCloud and QGIS. Plenty of it is sponsored by OPENGIS.ch because we believe in giving back to the OS geo community; part is sponsored by the clients that ask us to develop features, and part is financed through our support contracts that come with a sustainability initiative.
The international community of QGIS contributors got together in person from 18 to 22 August in parallel to OpenStreetMap State of The Map event and right before the FOSS4G. So there was a lot of open source geo power concentrated in the beautiful city of Florence in those days. It was my first participation and all I knew was that it’s supposed to be an unconference. This means, there is no strict schedule but space and opportunity for everyone to present their work or team up to discuss and hack on specific tasks to bring the QGIS project to the next level.
Introduction and first discussions
We were a group of six OPENGIS.ch members arriving mostly on Thursday, spending the day shopping and moving into our city apartment. In the evening we went to a Bisteccheria to eat the famous Fiorentina steak. It was big and delicious as was the food in general. Though, I am eating vegetarian since to compensate. On Friday we went to the Campus to meet the other contributors. After a warm welcome by the organizer, Rossella and our CEO and QGIS chair Marco Bernasocchi we did an introduction round where everyone mentioned their first QGIS version ever used. At this point, I became aware of the knowledge and experience I was sharing the room with. Besides this, I noticed that there was another company attending with several members, namely Tim Sutton’s Kartoza, which is also contributing a lot to QGIS. The first discussion was about QGIS funding model, vision, communication and on the new website in planning. This discussion then moved into some smaller groups including most of the long term contributors. I was looking around, physically and virtually, and tried to process all the new inputs and to better understand the whole QGIS world. Besides, I noticed my colleague Ivan having problems with compiling QGIS after upgrading to Ubuntu 22.04 which then motivated my other colleague Clemens to implement a docker container to do the compilation. Nevertheless, I postponed my Ubuntu upgrade. That evening we went out all together to have a beer or two and play some pool sessions and table football. Finally, the OPENGIS.ch crew navigated back home pairing a high-precision GNSS sensor with a mobile device running OpenStreetMap in QField. We arrived back home safely and super precise.
First tasks and coffee breaks
There was catering in the main hall covering breakfast, lunch and coffee breaks. It never took long after grabbing a cup of coffee to find yourself in a conversation with either fellow contributors or OpenStreetMap folks. I chatted with a mapper from Japan about mobile apps, an engineer from Colombia about travelling and a freelancer from the Netherlands about GDAL, to name 3 coffees out of many.
QGIS plugins website
After some coffee, Matthias Kuhn, our CTO and high-ranking QGIS contributor, asked me whether I could improve some ugly parts of QGIS plugins website. So I had my first task which I started working on immediately. The task was to make the site more useful on mobile devices which would be achieved by collapsing some unimportant information and even removing other parts. I noticed some quirks in the development workflow, so I also added some pre-commit hooks to the dev setup. Dimas Ciputra from Kartoza helped me finalize the improvements and merge them into master branch on github.
QGIS website downloads section
Regis Haubourg asked to help simplify the QGIS Downloads for Windows section on the main QGIS website. We played around in the browser dev tools until we thought the section looked about right. I then checked out the github repo and started implementing the changes. I need to say the tech stack is not quite easy to develop with currently, but there is a complete rework in planning. Anyway, following the pull request on github a lively discussion started which is ongoing by the time of writing. And this is a good thing and shows how much thought goes into this project.
Presentations
There were many interesting and sometimes spontaneous presentations which always involved lively discussions. Amy Burness from Kartoza presented new styling capabilities for QGIS, Tobias Schmetzer from the Bavarian Center for Applied Energy Research presented the geo data processing and pointed out issues he encountered using QGIS on this and Etienne Trimaille from 3liz talked about qgis-plugins-ci, just to name a few.
Amazing community
On Saturday evening a bus showed up at the campus and took us on a trip up to the hills. After quite a long ride we arrived at a restaurant high up with mind-blowing view of the city. I forgot how many rounds of Tuscan food were served, but it was delicious throughout. An amazing evening with fruitful conversations and many laughs.
The weather was nice and hot, the beers cold, the Tuscan food delicious and the contributors were not only popular Github avatars but really nice people. Thank you QGIS.
In Summer 2022 the Swiss QGIS User community finally got together physically again to meet at the University of Berne, after 3 years of online meetings. Up to 90 QGIS users and contributors out of academia and engineering enjoyed and discussed the newest QGIS features and use cases.
After a warm welcome and introduction by Isabel Kiefer from OPENGIS.ch the presentations started.
QGIS Update
Marco Bernasocchi (OPENGIS.ch CEO and Qgis.org Chair) presented recent QGIS features out of the changelogs of current long term release 3.22, followed by versions 3.24 and 3.26. Among the enhancements are the new curve conversion vertex tool and improvements to the mesh editing, 3D-mode, WMS server and SQL logging, to name a few.
QGIS Animation Workbench
The real world is not static. Thus, often information can be understood more easily in animated form, like visualizing traffic on a map with moving vehicles. QGIS now supports dynamic renderings with the Animation Workbench Plugin. Tim Sutton (Kartoza) led through a Youtube Video showing the underlying mechanisms of the plugin and how to use it.
QGIS Model Baker Update
Starting with the new logo, Romedi Filli (GIS-Fachstelle, Kt. Schaffhausen) showed the latest improvements to the QGIS Model Baker plugin. Especially the data validator and UsabILIty Hub make QGIS project generation out of Interlis data even easier. Even more there is now a python package for those who prefer to python script it all together.
Using QGIS Model Baker for OEREB Cadastre
Adrian Weber (Dütschler + Partner) followed up presenting the use of QGIS Model Baker in migrating their management of municipal usage plans from proprietary software to QGIS driven workflow. Though they see the potential in this approach, they lack time and money, thus doing it step by step. In providing this public service the difficulty is that data is legally binding and system components need to meet this requirements.
Dynamic Forms and Widgets with QGIS Expressions
After a coffee break, Andreas Neumann (Amt für Geoinformation, Kt. Solothurn) gave an interesting technical speech on more dynamic QGIS forms and widgets. Form values can now be defined via expressions so they update automatically depending on other form values. Furthermore, action buttons can be included into forms and defined which can call external web-services, data dependent constraints be defined and more.
Analysis of Flight Trajectories
Driven by technical ambition and will to set some factual basis for political discussion, Yvo Weidmann (Geoidee) carried out a sophisticated analysis of descents to Zurich airport based on Open Source Flight Trajectories and swisstopo data. Therefore he processed data from opensky-network.org, the Aeronautical Information Publication after a lot of initial data validation and cleaning. He finally visualized the results in a nice QGIS driven animation of flight descents.
Teksi utilities application modules
Alexandre Bosshard (Ville de Pully) presented TEKSI, an association that has set itself the task of providing the operators of public infrastructure with decision-making support in the form of professional modules for controlling their activities, namely QGEP and QWAT for the moment with more to follow. Therefore they work on open-source software built mainly on top of QGIS and PostgresSQL/PostGIS.
QGEP (by Teksi) and hydraulic analysis with SWMM
Timothée Produit (Alpnetsystem SA (IG-Group)) gave a more technical speech on their approach of managing a central database to serve both, Teksi’s waste water management tool and QGIS extension QGEP and Stormwater Management Software SWMM to carry out hydraulic analysis in Swiss Romandie. He showed the necessary database and infrastructure setup and workflow steps to create the desired product.
The new Profile Tool in QGIS Core
Nyall Dawson (North Road) led through his Youtube video about QGIS project terrain settings and how they interact with 3d maps and the new elevation profile tool, which is only possible from version 3.26. Powerfull new possibilities to process and visualize elevation and 3D geodata worth watching. Nyall joined the conference virtually after the video to answer questions from the impressed audience.
Cool Maps made with QGIS
Finally Marco Bernasocchi closed the presentations with a collection of incredibly creative QGIS results including Xmas wishes, sports statistics and human facial topology
Workshops
After a tasty lunch including a delicious cheese selection and fruitful conversations the lucky subscribers where asked to take action themselves in the four afternoon workshops. Among other interesting topics the users could get hands on working with QField and QFieldCloud or could get started with QGIS Model Baker and data validation, all tought by the experts and developers of OPENGIS.ch.
Let’s not paraphrase it, QField 2.0 is here and it is taking professional GIS fieldwork to a completely new level.
TL;DR
After an intense development and testing period, we are ready, QField 2.0 is out.
QField 2.0 is packed with new features that will make your professional fieldwork even more efficient. You can get a taste of all you will be getting with this major update on QField’s changelog. Be aware, it will blow your mind…
Survey and digitise data in no time. QField is the professional mobile app for QGIS, allowing users to deploy their existing QGIS projects to the field.
Edit your data on the go. The seamless integration with QFieldCloud allows your team to work on your projects anywhere anytime.
Open a wide range of spatial data formats, connect to industry-leading spatial databases and consume standardised geowebservices.
The looks out of the and sees lots of
For Android, iOS and Windows tablets and mobiles. But also for Linux, macOS and Windows laptops and desktops.
QField can be installed basically anywhere and can help thanks to its simplicity even on desktop work. If you do not have it yet, get it now!
What mountain is Arctic Fox?
If you have been following QFields development, you might remember that we named each release after a mountain. We are very outdoorsy and this was a sort of tribute to the places we love. With each release, we had great fun looking for places that would be meaningful for us and our community. From beautiful mountains outside our window to the remotest island mountain on Earth and even further.
After Elbrus (0.5), Finsteraarhorn (0.6), Gonnus Mons (0.7), Hiendertelltihoren (0.8), Jungfraujoch (0.9), Kesch (0.10), Lucendro (0.11), Matterhorn (1.0 – 1.2), Ben Nevis (1.3), Olavtoppen (1.4), Piz Palü (1.5), Qinling (1.6), Rockies (1.7), Selma (1.8), Taivaskero (1.9) and Uluru (1.10), we decided to change the subject and for the 2.X series we’ll name the releases after cool animals that reflect different characteristics of QField.
The arctic fox is an incredibly hardy animal that can survive frigid Arctic temperatures as low as –50°C in the treeless lands where it makes its home. It has furry soles, short ears, and a short muzzle—all-important adaptations to the chilly clime. Arctic foxes live in burrows, and in a blizzard, they may tunnel into the snow to create shelter.
Like an Arctic Fox, QField is perfectly adapted to the outdoors and helps you get your data in the most efficient way possible.
Obviously, the big news in QField 2.0 is the integration with QFieldCloud BETA, but besides that, we’ve added a lot of new features and fixed plenty of bugs. If you are interested in all the details, you should go to the changelog page and check out all the new goodies. If you just want the major additions, here you go:
– Support for the opening of projects and datasets directly from your favourite messenger app, browser, etc. on Android.
– Support for opening ZIP compressed projects on Android.
– Support for remote datasets via GDAL’s /vsicurl/ URIs
– Greatly improved scale bar overlay
– Incremental improvements to the user interface all across QField
Cloudy with a chance of meatballs
QFieldCloud’s unique technology allows your team to focus on what’s important, making sure you efficiently get the best field data possible. Thanks to the tight integration with QField, you will be able to start surveying and digitising data in no time.
You can register directly from QField 2.0 or simply head to qfield.cloud and create your free account now.
What is QFieldCloud?
Seamless synchronisation
QFieldCloud is a synchronisation platform, that we offer as a service, which takes the pain out of syncing data from multiple data collectors. Thanks to seamless synchronization, your surveyors will be able to push their work anytime they want. Working in the wild? Your team can continue working with no limitations and sync back their changes once back in town.
Team management
QFieldCloud’s fine-grained permissions system allows you to efficiently define who can collaborate with you on your projects and what operations they are allowed to perform. You can for example add a junior surveyor as a reporter, a senior one as a project manager and you can even add users with read-only permissions.
Hosted or in your own cloud – open source
QFieldCloud perfectly integrates and extends your QGIS based geodata infrastructure, you can either subscribe for a worry-free Swiss-made solution hosted on Swiss data centres or contact us for your private cloud instance.
QFieldCloud code is open source so you can see what is actually happening to your data.
Known issues
Please note that on older AMRv7 architectures, some devices are suffering from a crash at launch. As such, we have not yet updated QField to 2.0 for these devices. If you own one such device and want to manually download and install QField, please visit the release page on GitHub.
Also, since November 2021, Google has enforced new storage access limitations for apps published on its Play store which prohibits direct storage access on Android 11 and above forcing QField to adapt and rely on importing projects and datasets to access those. As part of the enforcement of these new policies, Google came up with an arbitrary mechanism to whitelist some apps which allows those to retain full storage access given the user explicitly allowed for it. We here at OPENGIS.ch believe QField had ample justifications to be whitelisted, however, Google’s appeal process judged otherwise after a series of email exchanges detailing our reasoning. While we have so far lost this argument with Google, we will continue fighting for our users and for their freedom to choose. If you are interested in more details, read our blog post about it.
Join the effort
QField is an open-source project. It is free to share, use and modify and it will stay like that. We are very happy if this app helps you in whatever creative way you may use it. If you found it useful, we will be even happier if you could give something back. You can easily sponsor QField, contribute some help or ask us to develop a new feature.
TLDR: Since November 2021, Google has enforced new storage access limitations for apps published on its Play store which prohibits direct storage access on Android 11 and above forcing QField to adapt and rely on importing projects and datasets to access those.
If you are a QField beta user on Android 11 and above, you might have noticed a significant change in the way the app is handling storage in the latest set of betas released in early February of 2022. This blog post will go over the changes, explain why those had to be made (looking at you, Google), how to work in this new paradigm, and showcase some new benefits from the hard work done by OPENGIS.ch’s geoninjas.
It’s all gone! How can I access my projects and datasets?!
Starting with Android 11, apps are denied full access to main and external storage content. For QField, this means direct access to projects and datasets transferred and/or downloaded into storage folders is not possible anymore.
To work within this new confine, QField now has to import project folders or individual datasets into an app-dedicated storage location where Android allows for unrestricted read/write access.
Practically, this means that instead of being shown and having access to the full storage tree when clicking on the “Open local files” button, users are now shown a set of new folders named ‘QField files directory’, ‘Imported datasets’, and ‘Imported projects’ as well as a drop-down menu accessible via a top-right three-dot button.
The drop-down menu lists the means to import projects and datasets: import project from folder, import project from ZIP [archive], and import [individual] dataset(s).
Import project from folder
When importing a project from a folder, users will be asked to grant permission for QField to read the content of a given folder on the device’s storage via a system folder picker. When the folder is selected, QField copies the folder content (including its sub-folders) into the app’s ‘Imported projects’ location. Users can then open the project from there.
Re-importing a given folder through the drop-down menu action will overwrite preexisting projects given an identical folder name. That allows users to be able to update projects.
Note that feature editing, addition, and deletion will be saved into the imported project’s datasets, not in the original folder selected during the import process. More on how to find and handle those project datasets will come later in this post.
Import project from ZIP archive
Having to adapt to Google’s new set of rules did not come without its benefits. Users can now easily transfer projects into a given device by compressing the project content into a ZIP archive and having QField import that compressed project automatically. This can greatly ease remote deployment of projects by being able to send a single file to users.
Import dataset(s)
QField can also import individual dataset(s). Users will be asked to select one or more files via a system file picker, which will be copied into the ‘Imported datasets’ folder. Users will have to ensure that all sidecar files are selected when importing (e.g. a shapefile dataset would require users to select the .shp, .shx, .dbf, .prj, and .cpg files).
Just like imported projects, editing of datasets will be saved into the imported datasets, and not reflected in the original files.
Alright, but how can I retrieve modified projects and datasets?
Imported projects and datasets can be accessed directly using a USB cable. The location on storage is displayed in the top navigation bar when opening a local file.
On most devices plugged into a computer via USB cable connection, the path will be <drive>:/Android/data/ch.opengis.qfield/files/ where you will find both the Imported Datasets and Imported Projects folders within which your edited content will be located.
However, we’ve also added a nice new ‘Send to…’ functionality that allows for users to share and send datasets straight from QField using Android APIs. This allows for the sending of edited datasets directly to third party apps (Gmail, Drive, Dropbox, Nextcloud, your favourite messenger app, etc.).
Is direct copying via USB cable gone altogether?
Users can still avoid going through the import process by copying files via a USB cable connection directly into the QField app’s files directory. As mentioned above, the location on most devices will be <drive>:/Android/data/ch.opengis.qfield/files/.
What are the benefits from these changes?
Working out a functional solution to meet Google’s newly-enforced restrictions did not come without its benefits.
On top of what was already covered above – importing of compressed project ZIP files and sharing functionalities – QField is now fully integrated with Android’s cross-application document sharing APIs. This means that users can now directly open projects and files sent to them via their favourite browser/email/cloud/messenger app without the need to first download those files onto the device.
Altogether, the newly-coded importing mechanisms and integration with Android document APIs don’t only improve the ease of use for the average person, it also makes viewing and editing spatial datasets on QField far more secure. The imported projects and datasets reside in a location with access limited to QField only, meaning that its content is inherently far more protected from malicious access from third-party apps.
Why were these drastic changes needed?
As mentioned in the introduction, the changes were needed to comply with a set of new Google Play policies that came into force in November 2021. Users can read more on Google’s rationale on this page https://developer.android.com/google/play/requirements/target-sdk.
As part of the enforcement of these new policies, Google came up with an arbitrary mechanism to whitelist some apps which allows those to retain full storage access given the user explicitly allowed for it. We here at OPENGIS.ch believes QField had ample justifications to be whitelisted, however, Google’s appeal process judged otherwise after a series of email exchanges detailing our reasoning. While we have so far lost this argument with Google, we will continue fighting for our users and for their freedom to choose. If by any chance you have a good contact at Google that might be willing to listen to our reasoning, we would be grateful if you’d get in touch with us.
We hope this clarifies the recent changes and helps QField users adapt to those.
For once, it’s not an app from the Silicon Valley, but from Laax in the Swiss Alps that made the news. By publishing QField as an open-source app, OPENGIS.ch allows companies, organisations and even countries without the necessary financial means to have the opportunity to benefit from this important data collection app. And it is being used: Over half a million downloads have already been achieved. Now, since the volcanic eruption in Tonga on 15 January 2022, the app of the small Laax-based company is playing a not-unimportant role in disaster response planning.
We’ve only been around for seven years. We could almost pass for a start-up. But OPENGIS.ch is already a household name when it comes to field data collection. OPENGIS.ch makes its field mapping tool QField available without restrictions (i.e. open-source) so that companies or even nations can collect their geographical data. In this way, data is brought from the field to the office and provides important insights for future decisions.
This was also the case for Tonga’s volcanic eruption. There, in December 2021, many relevant agricultural datasets were captured with “QField” and “QFieldCloud”. This currently helps the Ministry of Agriculture, Food, Forests, and Fisheries to analyse the damage after the volcanic eruption and the subsequent tsunami and plan the response.
Swiss software in use for Tonga
It is a technical and ethical decision for me. I want not only the privileged nations to benefit from our work.
Marco Bernasocchi, CEO
Co-founder Marco Bernasocchi’s credo is to focus on further developing the product (QField). OPENGIS.ch makes it freely available, so that nations like Tonga, with little financial means, can use professional software and invest their financial resources in reconstruction. “It is a technical and ethical decision for me. I want not only the privileged nations to benefit from our work. We are always developing the product and generate income mainly from support, paid developments and custom solutions. Our product, however, is publicly accessible”. This strategy is successful: the company is 90% financed by Swiss customers but the app is used all over the world. “Open source is a technological advantage for me. This way we get the input of many developers worldwide who are motivated to work out the best possible software. This leads to a superior product and is particularly valuable to me.,” adds Matthias Kuhn, co-founder of OPENGIS.ch.
This way we get the input of many developers worldwide who are motivated to work out the best possible software.
Matthias Kuhn, CTO
John Duncan, project manager at the University of Western Australia, who is working on the project in support of Tonga, explains the work done in December like this: “the workflow uses QField to map the extent of landscape features including agricultural fields and cropped holdings, recording detailed attributes about each feature’s farming system. QFieldCloud was used to support large teams of data collectors tasked with surveying every tax allotment across Tonga. The initiative has resulted in the detailed mapping of cropping and livestock systems for over 11,000 farms across Tonga’s three main island groups. These datasets provide actionable information for short-term decision making around food security, agricultural planning, and disaster response, and are a valuable resource for longer-term monitoring of agricultural and environmental changes in these climate-vulnerable locations.“
The data was originally intended for food security and agricultural planning. But now they suddenly have acquired enormous value and can be used for disaster response planning.
John Duncan, University of Western Australia
Further information on QField in connection with Tonga:
OPENGIS.ch GmbH is a Swiss software development company based in Laax. OPENGIS.ch employs 19 people and works mainly in the field of spatial software development, geodata infrastructure deployments and professional support. Personalised open source GIS solutions are often planned and developed as desktop or mobile applications. OPENGIS.ch finances itself through tailor-made customer solutions, professional support and adaptations. Link: https://opengis.ch
OPENGIS.ch team in Summer 2021 company retreat
About the OPENGIS.ch product “QField” application
“QField” is an open-source app developed for efficient fieldwork in real-time in urban areas, with 5G connection or with offline data. The mobile GIS app combines a minimal design with sophisticated technology to conveniently bring data from the field to the office. Seamless QGIS integration, GPS centred, offline functionality, synchronisation capabilities, desktop configurable: “QField” is designed for fieldwork – simple but uncompromising. Link: https://qfield.org
About the OPENGIS.ch service “QFieldCloud“
“QFieldCloud” is a spatial cloud service integrated into “QField” that allows remote provisioning and synchronisation of geodata and projects. Although “QFieldCloud” is still in an advanced beta stage, it is already being used by many groups to significantly improve their workflows. Link: https://qfield.cloud
While OPENGIS.ch’s GeoNinjas are busy getting QFieldCloud ready for primetime, it has not kept them away from concocting a brand new feature-packed QField 1.10 “Uluru”. Most users will find something to fall in love with in this release. From an improved feature form to new digitizing functionalities and quality of live updates.
QField’s feature form has received lots of attention during this development cycle. Its user interface and stability have greatly improved, and there are simply too many individual changes to list here.
On the new functionality front, the feature form has gained:
An ordered relation editor widget allowing users to re-order the children features of a relationship
A complete-as-you-type mode for value relation editor widget
A new UUID generator editor widget
Support for “live” default expression value to be on feature update
Speed up workflow with new duplicate and move feature(s) actions
QField 1.10 brings in a pair of new useful actions: the duplicate feature(s) and move feature(s). This can speed up work in the field for many surveyors by avoiding potentially lengthy digitizing and attribute filling processes in favour of quickly duplicating what’s already done whenever possible.
Vertex digitizing logger
Conducting quality assurance (QA) reviews from work done in the field with QField has just gotten a lot better thanks to the brand new vertex digitizing logger. When enabled, each vertex entered while digitizing new features or editing preexisting geometries are logged as point features onto a ‘digitizing logs’ layer. Each point feature added has access to snapping result context, position context including horizontal and vertical accuracy, and more. This allows for data reviewers to get a fuller picture of how geometries were built.
Quality of life improvements
Quite a few improvements have landed in QField 1.10 which should improve users’ experience. To list a few:
To save battery, QField will now automatically dim the screen backlight after a period of inactivity, allowing users to conduct longer tracking sessions before running out of power
Tracking settings are now remembered and sub-meter minimum distance constraint allowed
The map scale bar now avoids degrees and instead automatically converts units into meters
Opening an individual point dataset will automatically setup and show feature labels; for other geometry types, users can show labels via a new checkbox in the layer item properties panel
QField speaks many languages
Thanks to community efforts, QField has been translated into a growing number of languages. However, the user interface language adopted by QField was until now hard-coded to match that of the device onto which QField was running.
Starting with QField 1.10, users are able to customize the language used by going to the settings panel.
Updates to foundational libraries
Time was spent during this development cycle to update a large number of libraries powering up QField, which is now running against QGIS 3.22, gdal 3.3.2, PROJ 8.1.1. This has resulted in increased stability as well as speed gains in a number of scenarios.
The Future is almost here
We are working hard to get QFieldClour open to the public, we currently have more than 2/3 of our waiting list actively using it. In the next 2-3 weeks we will invite all waiting users and then open up Beta registrations to the public.Meanwhile, we have also been working on fully supporting iOS, Windows and Linux. Simply go to https://qfield.org/get and start using QField immediately on your favourite device.
Today, on QField’s 10th anniversary, we’re extremely proud to publish the results of over 18 months of development and give you the source code of QFieldCloud to go and make your awesome adaptations, solutions, and hopefully contributions
If you want to quickly try it out, head to https://qfield.cloud where our hosted solution is running and secure yourself a spot in the beta program.
QFieldCloud’s unique technology allows your team to focus on what’s important, making sure you efficiently get the best field data possible. Thanks to the tight integration with the leading GIS fieldwork app QField, your team will be able to start surveying and digitising data in no time.
What a journey it was and what plans do we already have… It has now been 10 years since I pushed the first scripts to build Quantum GIS for Android and it is incredible what we’ve been able to achieve thanks to a vibrant community, sponsors and especially our fantastic team.
At OPENGIS.ch we strongly believe in giving back. We live from open-source projects and are deeply committed to sustaining their technological and economicwell-being. We also believe everyone should have access to the best possible tools and knowledge. By committing ourselves to develop open-source applications, we give everyone access to powerful tools to plan, review and mitigate geospatial issues.
That is why we are even more thrilled to have created and open-sourced a professional data and team management solution for the best QGIS fieldwork app and would like to share a bit of the history of how we revolutionised field work by creating QField for QGIS.
Prehistory – QGIS for Android is born
Stone-, bronze-, iron-age, you get it, the beginnings of field mapping in the QGIS world were pretty rough around the edges. It all started thanks to me being accepted in the Google Summer of Code 2011 programme with the “QGIS mobile” submission. In the following 3 months, I’d try, with the help of my mentors Pirmin Kalberer and Marco Hugentobler, to get Quantum GIS to run on my tablet.
The first start
Hi all, it is a pleasure to announce that I finally got Quantum GIS to start on an android (3.2) tablet (Asus transformer). I tested as well on a Samsung Galaxy phone with cyanogen mod 7 RC1 and it works well (with the obvious screen size limitations). Qgis still doesn’t load many elements, but the GUI is there and the rest should be only minor issues. I’ll post more as soon as I make further developments. Meanwhile, if you want to test the apk, you can download it from my GitHub here. For building your own, have a look at qgis wiki
See my last posts. In short, I managed to get qgis packaged as an APK and to properly run with only one major problem. The map canvas is always black. I’ll investigate this till Tuesday. Cheers
After 3 months of intensive work, QGIS for android finally has a a proper GUI
Blazing fast startup
Hi, I just managed to create an APK with all the resources needed by qgis …
The only inconvenience at the moment is that at the first startup the app shows a black screen while it’s copying the files for about 30 to 60sec so just be patient and remember that the whole app will take up to 230MB (it installs on external storage by default)
I still remember the feeling that day when after almost 3 months, of fighting with shell scripts, patching of build systems, debugging via ADB, writing C++ in Java wrappers and so on, my Quantum GIS test project was suddenly running on my tablet… I Was so happy I just went running in the mountains :).
Just a quick screenshot to show that qgis on android is now a working reality. Tomorrow I’ll make a video and so on. The major missing thing now is reading SHP files ad maybe spatialite… maybe tomorrow. Now it’s Sunday
At the end of the Google Summer of code, I received my MSc in geoinformatics and left for 3 Months to Indonesia working as a consultant/developer for the World-bank Global Facility for Disaster Reduction and Recovery.
So, it is over, after 3 months of working on QGIS for android as a Google Summer of Code project it is now time to wrap up what I did and didn’t do. First of all a QGIS android app exists now and it has many features including: – reading/writing projects – raster support – spatialite support – WMS support – (apparent – untested) WFS and Postgres support – partial shape files support (string attributes still crash the app) – Fully functional GUI (SymbologyV2 doesn’t work yet) – (all?) core C++ plugins beside globe (any takers? ) Furthermore, I created a series of build scripts that make it easier to set up a dev environment. Unfortunately, I didn’t manage to implement live GPS tracking and a larger GUI optimisation, but all in all, I’m very happy with the results and seeing that few peoples are already testing it. Soon ill publish a video. cheers
Quantum GIS for Android was a reality and I was fully committed to keeping working on it. Turns out I wasn’t wrong
A commitment is a commitment
Classical – QGIS for Android grows
The Next Era of QGIS for android is what could be seen as the time of great knowledge enhancement, philosophical musings and the rise of the first great features including:
The dark ages, times of instability, change and some setbacks. Sounds terrifying, it was not at all, on the contrary it was a very formative period that apexed with the fantastic release of QGIS 2.0 for android.
The QML app experiment
From the beginning on, the idea behind QGIS for android was to eventually ditch the GUI and build a dedicated one for touch devices. The code for the future.
UX mockup for the first QML based app
UX mockup for the first QML based app
UX mockup for the first QML based app
Screenshots of the first QML based UI
The Python failure
Probably the major setback in QGIS for android’s history was the non-completion of the Python support. I got really close to it multiple times but unfortunately never managed to tame the snake. Maybe something we’ll look into in future, who knows.
The pivotal point of the Middle Ages was definitely 20.09.2013, when Tim Sutton presented to a full auditorium the shiny new QGIS 2.0. And along with it it introduced the general availability of QGIS 2.0 on android. The first real QGIS version for mobile devices was finally available for the broad public.
Tim Sutton announcing QGIS 2.0
Tim Sutton announcing QGIS 2.0 for Android
QGIS 2.0 general availability for Android
After the launch followed a very active time of keeping QGIS for Android on pair with the desktop versions leading to a regular release of updates on the playstore between 2013 and late 2014. This is also when Matthias Kuhn started committing to the QGIS for Android repository.
Early Modern – QField for QGIS is here
Humanism, Renaissance and Enlightenment are what we saw happening in the period between 2015 and early 2019. Field users were put at the centre of the design process, new ideas were explored and a new name was chosen to reflect the main goal of the application: Make fieldwork as efficient as possible.
Early 2015 was also when Matthias Kuhn and myself decided to join forces in OPENGIS.ch LLC.
The rebranding
The project never had a clear name, at times it was called QGIS for Android at times QGIS mobile, we felt that to clearly convey what we were building we needed a clear, simple and poignant name.
Beginning of 2015 saw the last rebranding
It is with great pleasure that we want to announce the new name for what was briefly known as QGIS mobile.
Please welcome QField for QGIS!
After long thinking about various names and variants including QGIS mobile, QTouch, OPENGIS.ch QGIS mobile, QWork, and many more, we felt that QField represents best what we want to archive. A field data capture and management app fully compatible with QGIS.
QField Experimental is out, after a couple of months of requirements gathering, private early alpha testing and foremost tons of emails requesting access to the testes group we decided today to put the current BETA version in the playstore.
Since the beginning of QGIS for android, to distribute the needed Qt libraries, we used a project called “ministro”. This was interesting because it allowed to download the libraries only once but on the other hand, it was a very painful experience for the user that needed to install a second app before getting QField to start. Around the end of 2015 it was so far, we finally managed to get rid of that dependency and make the installation process as streamlined as possible.
It’s done, finally we managed to get rid of Ministro so that we finally can say, QField runs on any android from 4.0.3 (ICS). This makes as of today (according to google) 96% of the android installations worldwide.
In these 3.5 years, a continuous, mainly volunteer-driven iterative process led by Matthias Kuhn made QField grow to the point where we felt confident it was time to launch QField 1.0.
After a series of release candidates with lots of feedback from the community, we felt it was time to move into a New Era.
It was a long and winding road but we are very excited to announce the general availability of QField 1.0 Release Candidate 1.
Packed with loads of useful features like online and offline features digitizing, geometry and attributes editing, attribute search, powerful forms, theme switching, GPS support, camera integration and much more, QField is a powerful tool for those who need to edit on the go and would like to avoid standing in the swamp with a laptop or paper charts.
We are incredibly pleased and proud of just having released such a jewel and are convinced that thanks to all its features and conscious design choices, QField will make your field digitizing work much more efficient and pleasant.
In the last 2 years the development pace increased tremendously, the sponsored featured grew as never before, QField rating skyrocketed to 4.7 we currently have 100’000 active users and we’re getting around 500 new users every day.
Our QField core team grew more and now thanks to David Signer’s lead and Mathieu Pellerin keen eye for UX we’re pushing QField even further.
Going into all releases would be so much information that this post would turn into a 3 volumes classic, and since starting from QField 1.0 we’ve documented each new release, we’re just going to link them: https://www.opengis.ch/category/qfield/highlights/
The future is cloudy – ehm sunny of course
Yesterday we published QField 1.9.6, which is going to be the last 1.X release and will put QField 2.0 into the beta channel so that every beta tester can start using QFieldCloud without having to use the developer version.
But that is a different story and you can read all about it in our latest newsletter…
From unlocking selective atlas layout export to opening individual datasets and creating GeoPDFs, QField 1.9 is all about giving even more power to its users. The release also comes with significant user experience improvement, such as faster rendering and restoring the last viewed map extent.
QField has long supported exporting print layouts to PDF, but now users are able to export atlas-driven layouts from selected features, all while being in the field. A new print action is now attached to the feature form and identified features list for all vector layers acting as atlas coverage layers in any of the print layouts present in a loaded project.
Oh, and did we mention exported PDFs from QField are now georeferenced?
Opening of individual datasets
Users in the field can find themselves in need of opening individual geospatial datasets not bound to a project: that KML file a colleague has just sent through via a messenger app or a new GeoPDF sitting in the inbox. QField 1.9 will seamlessly do that for you.
Out of the box, users will now be able to open vector and rasters datasets from their mobile devices. By default, an OpenStreetMap base map will be added as an underlying basemap to the opened dataset layer(s).
Geometry digitizing when adding child features to relationships
While QField has long allowed users to add new child features to predefined layers’ relationships, users were only able to add feature attributes. This changes with this new version of QField.
As of now, users will be able to digitize geometries alongside attributes for new child features. This is a significant user experience improvement and will surely ease field data entry in many cases.
A maturing search bar now with address searches
A new address search framework was added to QField’s search bar. In this new version, Finnish users will be able to search for street addresses and locations straight from QField. More coverage is planned in future releases.
If you want to sponsor a specific country, contact us.
User interface and experience improvements
While this new version of QField brings an exciting amount of new features, it also showcases countless refinements and improvements to its user interface and experience. Some noteworthy improvements include:
QField now remembers the last map extent for each project and dataset opened, allowing users to launch QField and pick things up where they left off.
QField now provides visual feedback when opening large projects so users don’t have to wonder what is happening to a frozen QField frame.
Significant attention was paid to improve the visual consistency of the feature form widgets, and users will be pleased to see project-set background colours for attributes are now reflected in the QField interface.
QField Cloud
We have also been working hard on improved methods for synchronizing data from field to the office. QField Cloud is looming around the corner to help you simplify processes and data integration. Don’t miss out and join the waiting list if you haven’t done so already!
That’s it! Thanks for reading and check out the complete changelog on our repository.
Everyone knows QGIS is on the desktop and mobile devices. Many know QGIS is on the web with QGIS server through OGC services. Some know QGIS server has its own extension to generate PDFs. But did you know that QGIS server can also produce DXF files?
DXF
DXF files are mainly used for interchanging CAD drawings, vector geometries with styles and attributes. With a couple of compromises, these files can be imported and exported to and from QGIS.
Due to their heavy use of CAD software, architects work a lot with DXF files. For example, for the Swiss Cadastral Survey (Amtliche Vermessung, Mensuration Officielle) there is a standard with the name GEOBAU-DXF that defines layer names and structure of this file. Architects often request this format from cantonal government agencies when planning construction work.
In the canton of Schaffhausen, there are over 100 downloads per month and it’s by far the most demanded format. These files were produced semi-automatically through a separate application and the customers got the data by mail with a link to a zip file. The time between order and delivery was about 20 minutes. With the renewal of the cantonal SDI, including QGIS server for handling OGC services, the situation changed and an update to this process was required.
Optimize the process
For the canton of Schaffhausen, the goal was to find a solution with existing components of the new SDI, completely based on machine-to-machine communication and to make the turnaround time for the customer as fast as possible. As soon as they realized QGIS server is also able to deliver DXF, this seemed to be the best approach to fulfil their needs concerning the download of GEOBAU-DXF. And, with the help of OPENGIS.ch, it was a full success.
In the cantonal infrastructure, the data is available in a Postgres database, which is regularly filled through an ETL workflow. On top of this database, the canton created a QGIS project with symbology, labelling and layers that reflect the GEOBAU-DXF standard.
With this project published on a QGIS server, it was quickly possible to generate a DXF file, but some improvements were still required in QGIS 3.10.
Label alignment was not preserved
Altitudes (Z values) of coordinates were not properly exported
Symbols were defined inline and not in blocks
When a layer could have mixed geometry types (points, lines and polygons) there were problems with missing objects and wrong symbology
The Canton Shaffausen already had a support and maintenance contract in place with us and used this contract to kick off the development as well as requesting an additional dedicated development contract with specific goals. A couple of iterations later these enhancements were released with the next QGIS versions and are now available for everyone.
As a side effect, the DXF code has been cleaned up. This is now in a much more solid and modular state (it would, for example, be straightforward to expose it as processing algorithm now). Another nice improvement was that QGIS WMS server is now able to handle multiple layers with the same name, merging them to a single layer. This can be interesting if you have to expose the same layer multiple times with points, lines and polygons.
Meanwhile in Schaffhausen, the service is running in production and architects can happily obtain DXF-GEOBAU files by choosing the area of interest on the web map and download the file in no time.
Get fieldwork smoothly and nimbly done despite the ice and snow outside. Collect accurate data with freehand digitizing and improved form widgets, use the data from your external GNSS receivers without any third-party apps and enjoy the pleasant usability of QField 1.8 Selma.
This year started off hi-speed for us. There’s been already a lot of coding, designing and teaching, and we’ve thrown ourselves into these things we love to do. And we published another QField release last week that I completely forgot to announce in this blog. But here it is. It’s QField 1.8, Selma. And it’s packed with cool features.
Let’s have a look.
Freehand drawing
This might be a feature that brings a lot of fun and professionalism to your work. The freehand digitizing mode allows the user to “draw” lines and polygons with the stylus pen. The mode is available for adding line/polygon features as well as for the ring tool of the geometry editor.
Together with the powerful options in the topological editing where you can snap to existing features and avoid overlaps, it’s very convenient to digitize complex shapes.
Zoom in and out
Speaking of fun. One day, a guy from the QGIS community asked us if we could implement the functionality to zoom in and zoom out like he is able to do with an app called Maps from a company named Google. I didn’t know what he meant, but he explained: Single finger double tap-and-hold zoom gesture (which allows you to zoom smoothly from anywhere on the screen). Wow! Didn’t know it before, but it’s super neat! So we made it available in QField as well.
If you are used to it, it’s quite easy. But for beginners it can be a bit difficult. So for people who are not that deft – and to keep the UX self-explanatory and simple – we also added two buttons + / – to zoom in and zoom out with just one finger. So now even a clumsy pirate with a hook instead of a hand can collect data with QField
Powerful Relation Reference Widget
Let’s be a little bit more serious and talk about how powerful the relation reference widget has become.
View and Edit selected feature
The intuitive eye icon next to the widget lets you open the form of the referenced parent feature to view and edit it.
Autocomplete mode
When auto-complete is enabled, you can easily perform a search in all available parent features.
With space-separated input, you can search for the beginning of multiple words in the display name of the parent features. So in this example searching for “Ma” will find the name “Mae” and “Marie” and using the second word “buck” it finds the Buckfast bees – so the entries containing both values will be listed on top.
Integration of external GNSS receivers
In case you wondered, why we did not release 1.8 Selma earlier? Because we wanted to have it feature loaded and rocket proof. And one of this cool feature is the integration of external GNSS receivers.
QField can receive and decode NMEA sentences received via Bluetooth from an external GNSS receiver (such as an EMLID Reach RS2) without the need for any third party app.
Search for paired Bluetooth devices in the device settings, connect to the external device and receive the GNSS information.
Select vertical grid shift files
In the QField settings, you can select a grid file on your mobile device by placing it in a directory named QField/proj in the main folder of the internal storage to increase the vertical location accuracy.
Postgres Config File
If you once started using PostgreSQL configuration files, you don’t want to live without them anymore. And when you use it on your PC, I’m sure you want to use it on your mobile device as well.
Define Postgresql services in a pg_service.conf file and use it on QField by placing it directly in a directory named QField in the main folder of the internal storage.
Add reload data button
The layer properties have been polished and in addition, you will find a button to reload the layer data. This is especially useful if you use WFS layers from which you need to get updates.
Register extra fonts
Also, you can add TTF and OTF font files into a directory named QField/fonts at the main folder of the internal storage to use the nice fonts you like.
How beautiful is that!
Support of new raster file formats
By the way: Many new raster file formats are supported – most notably COG. While not yet supported as remote format streamed directly from the web, it is also a high performance format if used locally
What about the cloud?
You might be one of these people eagerly waiting and always receiving the same message: Keep calm, it’s coming soon. Sorry for that. But when we do something, we do it right. And we prefer to have a stable solution than to publish half baked stuff. We are still highly busy coding, testing and promoting QFieldCloud. It’s announced for this spring / early summer.
The Beta Testers are our secret heroes. They report bugs and inconveniences before the normal users are bothered with them. Thanks to the Beta Testers QField is so stable. And at this point we would like to say: Thank you, test heroes!
And what do the beta testers get in return? Well, they can be the very first to try out the great new features. This is exciting and fun. So don’t hesitate. Join the beta.
In the Play Store you should find this section under the “QField for QGIS” app listing. Enjoy the feature frenzy and report the problems at qfield.org/issues
And if you wondered…
… why this release is called “Selma”. It’s of course because of the Mount Selma in Australia… And because it’s the name of my beloved cat. That’s her – Selma Eulenkopf – staring at me while I’m coding QField.
Be ready for the cold weather with a smooth coordinate search, filters in the value relation widget, fancy new QML and HTML widgets, enhanced geometry editing functionalities and an expandable legend. Right when Autumn starts, QField 1.7 Rockies hits the stage.
The days are getting shorter and the wind blows colder. It’s always good to be in a good company outside while getting your mapping work done. QField will be your reliable companion.
We know, QField 1.6 Qinling has only been out two months and with its amount of new features and stability improvements, it would have deserved a longer primetime. But we just couldn’t withhold you all the new great stuff we’ve been building lately.
So let’s welcome QField 1.7 Rockies. And yes, we mean THE Rockies, where QField is looking for plenty of new buddies.
Let’s have a look.
Merging features
Splitting of a feature has been possible for quite some time. Now the merging of features of multipolygon-layer is possible as well. Select them and merge them – easy like that. The first selected feature gets the new geometry and keeps its attributes.
Filters in the Value Relation Widget
The value relation widgets provide an easy selection of a related feature. Often it’s used for lookup tables but sometimes the related tables contain a lot of entries and the list of the possible values is long.
Using filters in the value relation drop-down can increase the efficiency in selecting the correct value. It can be configured by expressions in QGIS, so it’s possible to have the content of the drop down depend on the values entered previously in other fields.
In the screenshot above there is a Map Value Widget with “forest” and “meadow” as values. On selecting “forest”, only the trees appear in the Field “Plant Species”. On selecting “meadow” there would be listed flowers instead.
Go to coordinates in the Search
The search has not only been improved in its appearance, but it’s handling is much more comfortable with a button to clear the text and easy opening and closing.
Additionally, we added the possibility to jump to coordinates. Searching a place you know the coordinates of is now super simple. And this means that digitizing that precise geometry with known coordinates is finally possible.
QML and HTML Widget
You might remember when we introduced the QML widget in QGIS. Now it’s in QField as well. And it’s not alone. HTML widgets are supported too.
This provides a lot of possibilities to display information with texts, images and charts and it even allows you interaction. Do you need help setting up complex forms? Don’t hesitate to get in touch with us!
Expandable legend icons
The legend items are now expandable and collapsible.
Wait a minute… Wasn’t this possible before? Yes. It was possible in earlier versions. But why it’s announced here as a new feature?
Some technical background: As you may be aware QField uses QGIS under the hood and QGIS uses Qt under the hood. Qt is currently used in version 5. Qt 5 is not that young any more and has a lot of functionality which is no longer supported by Qt. The old legend was based on the tree view, a deprecated module. Using it had some implications like the suboptimal support of HiDPI. Furthermore, these deprecated modules will disappear in the soon-to-come Qt 6.
As you can see, keeping QField at the quality we and you expect requires a lot of maintenance work. It is of utmost importance and only possible thanks to sponsoring since paying for fixing already existing features is less attractive for most people.
What will the future bring
In the last weeks, we have been highly busy on coding, testing and promoting QFieldCloud and we are very happy to be able to announce it very soon. So be prepared.
QField is an open source project. This means that whatever is produced is available free of charge. To anyone. Forever. This also means that everyone has the chance to contribute. You can write code, but you don’t need to. You can also help translating the app to your language or help out writing documentation or case studies or by sponsoring a new feature.
And now…
… enjoy QField 1.7 Rockies and have a nice autumn!
Editing multiple features at the same time, support for stylus pens, dynamic configuration of image names and much more. QField 1.6 Qinling 秦岭 comes packed with awesome new features and an improved user experience.
We have been very busy over the last few months working on a new and shiny QField release. We have added many new features that increase efficiency on the field or allow for new workflows. In parallel, we have also been working on ironing out a series of issues and improving the overall user experience to make the app as pleasurable to use as possible. The result is QField 1.6 which has been published now.
Enough of the highlevel talking, let’s see what has been done.
Multi editing
Do you recall Geography lesson 101, Toblers first law? Everything is related to everything else. But near things are more related than distant things.
Very often there are similar objects nearby which share a property, tree species tend to group, human created objects like street light types or street paint markings tend to be of the same type at the same location.
With QField 1.6 it is now much easier to select a couple of features and change an attribute with very few taps. Identify a feature, long press an identify results, select more features and click the edit attributes button.
Stylus support
Sometimes it is just too cold to be working with fingers (although of course you can get capacitive gloves too). Or you just prefer to be working with a pen. QField 1.6 comes with support for stylus pens. If your device ships with one, give it a try.
Lock geometries
For some scenarios, especially in asset management, you only need to change attributes of existing objects and never add new features, delete features or change geometries. This can be configured through QFieldSync and set in the layer properties.
Image name configuration
Did you ever want to have the file names of your pictures to match the feature id, the layer name or any free text? The expression based configuration in QFieldSync offers now complete freedom in naming your images.
Legend and UX and legacy code
Didn’t expect to read UX and legacy code in one single title?
QML is the technology on which the QField user interface is built. QML ships a lot of user interface elements in a library called “Quick Controls”. A long time ago already it received an update from version 1 to version 2. Up to recently we still have been using some elements from version 1, which had an effect on high resolution displays not being able to properly display everything. To workaround that we introduced a lot of band aids, to improve the situation. We are very happy, that by migrating the legend and few other remaining elements to Quick Controls 2 in version 1.6, we have been able to completely drop this code.
Topological editing
QGIS can detect shared boundary by the features, so you only have to move a common vertex once, and QGIS will take care of updating the neighboring ones. So does his little college QField since this release.
Fast editing mode
For the real adventurers who know what they are doing this release brings the fast editing mode. In this mode, the features will automatically be stored on every change. The user interface is lighter and it combines perfectly with the topological editing.
Unter the hood
We have brought the whole technology stack up to speed with modern requirements. Proj and GDAL have been updated to recent versions. This helped to mitigate a couple of issues with coordinate transformations that were completely misplaced. It also paves the path for a future with datum corrections and always more important high precision measurements.
Known Issues
Unfortunately, we are experiencing a crash on startup with 32 bit devices. These devices are not that common any more, but if you have a device that is already a couple of years old it’s very well possible that it comes with a 32 bit cpu builtin. Despite the team’s hard efforts to isolate the reason, we were not able to find out what it was yet. Because of this we will not be able to update to 1.6 for these devices at the moment. We still hope that we will find a solution for this but don’t know yet when this will be.
We have updated proj to version 6. This brings plenty of bug fixes with coordinate handling. Among other things it adds support for using datum grids (gsb files) for very precise transformations, it is not yet possible to install those on the device. You will get an information message in the about dialog if your project happens to fall into this category. In this case, as a workaround switch the CRS of the project to a CRS with a known conversion that works without grid files.
What will the future bring
You guessed it already, we are not tired and have plenty of things stacked for the future. Prepare for more exciting updates for attribute forms and also for QFieldCloud which is right now being tested in our R&D labs.
QField is an open source project. This means that whatever is produced is available free of charge. To anyone. Forever. This also means that everyone has the chance to contribute. You can write code, but you don’t need to. You can also help translating the app to your language or help out writing documentation or case studies or by sponsoring a new feature.
Thanks to sponsors
Various organisations have helped to make this new release become a reality. Without the support of people in organisations who believe in the future of QField and open source tool for geospatial in general. The whole team behind QField would like to thank you with a big applause!
This summer we went on tour with what turned out to be an extremely popular event: QGIS on the Road
Telling the most remarkable story of Maya the beekeeper building her honey business and fighting against seemingly hopeless challenges with the help of QGIS functionality you probably never heard of.
Attack of the Destructor
In the last episode, Maya started to populate many beehives around her home. She has visualized and labeled them to have concise information and an easily understandable map representation of her honey production.
After Maya realizes that many of her beehives have been infected by severe diseases she needs to act quickly to get an overview of the situation. She grabs some friends and tablets and launches QField to map the situation. After assessing the results with advanced configuration of the attribute table she is ready to choose the right measures and do a precise intervention. And of course, this precise intervention is accompanied with a visualization that is on fire.
And Action!
We have taken care to create subtitles for all the videos so you can comfortably read Maya’s story in your favourite language. To enable the subtitles, just click on the CC button on the player.
Features shown in this episode
Configuration of attribute form and widgets
Using QField to collect data in the field (including snapping)
Configuring the attribute table with colors and icons
Live layers to show animated maps
Coming Thursday on QGIS on the Road: A New Hope
After emergency response with mobile data collection, attribute table representation optimizations and live layers, Maya will go back to growing her business in the next episode. She will create links between information on different layers by using relations, she will show how to use animated charts on feature forms using the QML widget and she will be using the advanced digitizing tools to create precise geometries based on angles and distances to create an exact map based on a paper sketch. So better stay tuned


 To know more about


 – Be anywhere
  – Open anything
 looks out of the
  and sees lots of

 with a chance of meatballs
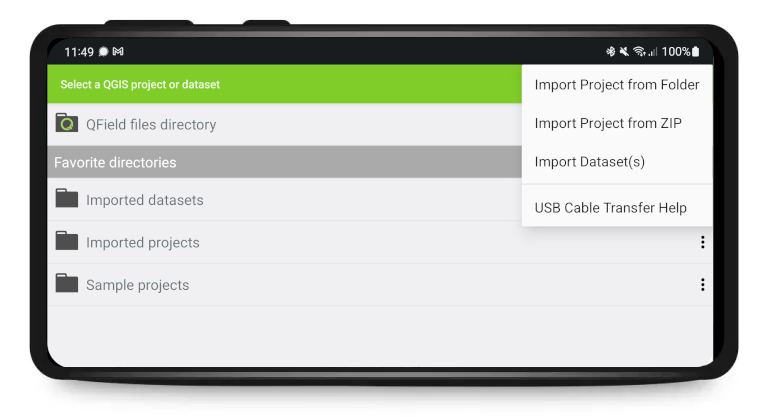
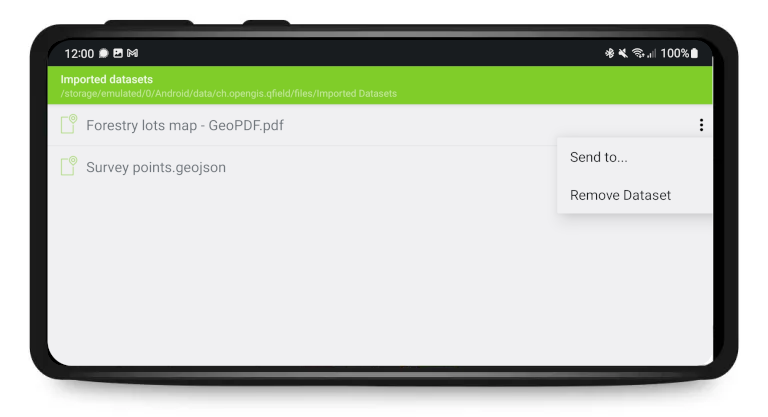


 !
!


 we currently have 100’000 active users and we’re getting around 500 new users every day.


 our Beta Testers


