Related Plugins and Tags

QGIS Planet

QGIS UI themes plugin

Scrap that idea. Seems there is already a  plugin to do this called Load QSS.  I’m not going to duplicate effort. Use that one and we can all make it better.

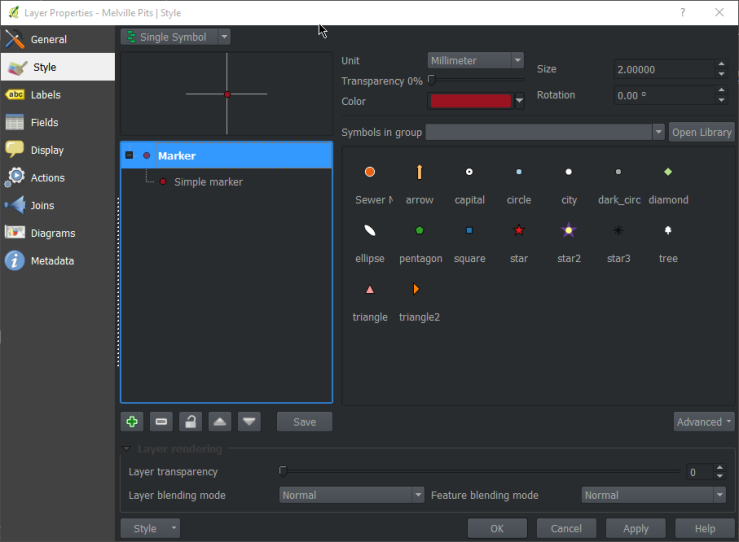
Want to have a dark theme, or even your own custom theme, for QGIS?  No worries. The UI Theme plugin has your back. Grab it from the plugin installer.  

Change the theme using Plugins -> UI Themes -> Theme It!

theme

Just select a theme and the interface will change styles.  Here is the dark theme called “Much Dark. Such Goth” :)

dark

I will let you try the “Oh my eyes” theme.

Themes can be added by creating a {name}.css file in plugin folder themes folder and edited __init__.pyfile to list the theme.  I’m working on this to make it better but I wrote this in about half an hour so it’s not all there yet.

The active themes is saved in the settings and restored on QGIS load.

If you make a cool theme feel free to make a pull request or ticket so it can be added to the plugin for others to use.  There is heaps that can be done with the Qt stylesheets so go nuts and make something cool.

Note: It’s a work in progress and things might not always look right.


Filed under: Open Source

Hat racks; or appreciating people for what they do.

The biggest thing with open source work is that it can be pretty thankless. There is a lot more that goes into a open source project then just some lines of code, there is events, documentation, API documentation, PR material, more documentation, websites, build setups, etc. It’s quite easy to just look at a project on GitHub, check out the graphs and see the top contributors and never think about it again. Because the code is all that matters right?

githubn

All hail Jürgen and Nyall!

Getting back to the point.  There is a lot of stuff that goes into an open source project that can go unnoticed and under appreciated.  Stuff that isn’t code is hard to track.  Do you know who maintains the QGIS website? What about who translates the UI? What about who ran the last dev meetings? These projects are non code related but are normally things that go unnoticed or under appreciated simply because it’s not a fancy chart in GitHub.  Making people feel welcome and appreciated in a project normally leads to a higher retention rate and a better overall feel for the project.  I remember when I was first thanked for the work I added to QGIS and how it made me feel, still here doing the same thing so it must have worked pretty well.

At PyCon AU 2015  Katie McLaughlin gave a talk about welcoming contributions to a project and being generally being nice to people. Not just being nice but actively thanking people for what they do and how it makes you feel. People generally put a lot of time into the projects they involve themselves in knowing you are appreciated makes you feel good.

Katie got the idea for the project from the talk and post titled A Place to Hang Your Hat by Leslie Hawthorn.  It seems like a silly title but read it and it will all make sense.

Her sub text makes the perfect summary:

On getting many good things done. And no one knows you’re doing any of it.

I’m not going to copy the post here but I will steal her tl;dr part:

  • If someone has volunteered to help your project, take the time to write a 2-3 sentence summary of what they did to help.
  • You can send it to them, along with a thank you note, or offer to post it on their LinkedIn profile. (Remember, users can approve recommendations before they’re added to their profile.)
  • Let’s spend some time celebrating our successes and all of our contributions! Let folks know you’re celebrating that success using #LABHR as a hashtag.
  • #LABHR stands for Let’s All Build a Hat Rack. For why its an awesome acronym, you have to read the post.

And here is the example post she makes:

Sample Recommendation

Deb Nicholson, Board Member, Open Hatch
While not strictly related to her work as an OpenHatch board members, Deb has given me invaluable counsel on fundraising for various non-profits I’ve been affiliated with. She’s also trained numerous community members on how to perform in-person advocacy for free and open source software projects, and software patent reform. As part of that training, she’s also convened numerous meetings and round tables to help people get things done in the open source world. She performs all this work with grace and patience for our sometimes difficult personalities. She’s brilliant and utterly unflappable. Cannot recommend her work highly enough.

So go ahead. Write something nice about someone and what they have done. Send it to them, blog about it, put it in Twitter, LinkedIn, etc.


Filed under: Open Source

Accessing composer item properties via custom expressions in QGIS

So here is a neat trick. Lets say you wanted to access the scale of a composer map to make it part of a label. The scale bar can already be set to numeric to show the number value but what if it needs to be part of an existing label with other text. Not to fear, expression functions are here.

  • Create a new composer. Add the map frame and a label.
  • Set the item ID of the map frame to something you can remember, lets just use themap
  • Select the label and add some text
  • Click Insert Expression

Now for the cool part

  • Select Function Editor
  • Click New File. Give the file a new name and hit save. I called it composer functions.

In the code editor paste this code:

from qgis.utils import iface
from qgis.core import *
from qgis.gui import *

@qgsfunction(args="auto", group='Composer')
def composeritemattr(composername, mapname, attrname, feature, parent):
    composers = iface.activeComposers()
    # Find the composer with the given name
    comp = [composer.composition() for composer in composers 
                if composer.composerWindow().windowTitle() == composername][0]
    # Find the item
    item = comp.getComposerItemById(mapname)
    # Get the attr by name and call 
    return getattr(item, attrname)()
  • Click Run Script

run

Now in your label use this text:

Scale: [% composeritemattr('Composer 1', 'themap', 'scale')%]

Update the Composer 1 to match your composer name, and the themap to match your item ID.

and like magic here is the scale from the map item in a label:

2015-05-21 22_00_09-Composer 1

Check the expression error section if the label doesn’t render

error


Filed under: Open Source, qgis Tagged: composer, python, qgis

A interactive command bar for QGIS

Something that has been on my mind for a long time is a interactive command interface for QGIS.  Something that you can easily open, run simple commands, and is interactive to ask for arguments when they are needed.

After using the command interface in Emacs for a little bit over the weekend – you can almost hear the Boos! from heavy Vim users :) – I thought this is something I must have in QGIS as well.  I’m sure it can’t be that hard to add.

So here it is.  A interactive command interface for QGIS.

commandbar

commandbar2

The command bar plugin (find it in the plugin installer) adds a simple interactive command bar to QGIS. Commands are defined as Python code and may take arguments.

Here is an example function:

@command.command("Name")
def load_project(name):
    """
    Load a project from the set project paths
    """
    _name = name
    name += ".qgs"
    for path in project_paths:
        for root, dirs, files in os.walk(path):
            if name in files:
                path = os.path.join(root, name)
                iface.addProject(path)
                return
    iface.addProject(_name)

All functions are interactive and if not all arguments are given when called it will prompt for each one.

Here is an example of calling the point-at function with no args. It will ask for the x and then the y

pointat

Here is calling point-at with all the args

pointatfunc

Functions can be called in the command bar like so:

my-function arg1 arg2 arg2

The command bar will split the line based on space and the first argument is always the function name, the rest are arguments passed to the function. You will also note that it will convert _ to - which is easier to type and looks nicer.

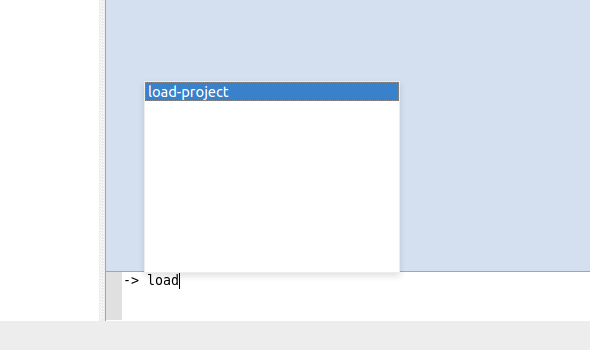
The command bar also has auto complete for defined functions – and tooltips once I get that to work correctly.

You can use CTRL + ; (CTRL + Semicolon), or CTRL + ,, to open and close the command bar.

What is a command interface without auto complete

autocomplete

Use Enter to select the item in the list.

How about a function to hide all the dock panels. Sure why not.

@command.command()
def hide_docks():
    docks = iface.mainWindow().findChildren(QDockWidget)
    for dock in docks:
        dock.setVisible(False)

alias command

You can also alias a function by calling the alias function in the command bar.

The alias command format is alias {name} {function} {args}

Here is an example of predefining the x for point-at as mypoint

-> alias mypoint point-at 100

point-at is a built in function that creates a point at x y however we can alias it so that it will be pre-called with the x argument set. Now when we call mypoint we only have to pass the y each time.

-> mypoint
(point-at) What is the Y?: 200

You can even alias the alias command – because why the heck not :)

-> alias a alias
a mypoint 100

a is now the shortcut hand for alias

WHY U NO USE PYTHON CONSOLE

The Python console is fine and dandy but we are not going for a full programming language here, that isn’t the point. The point is easy to use commands.

You could have a function called point_at in Python that would be

point_at(123,1331)

Handling incomplete functions is a lot harder because of the Python parser. In the end it’s easier and better IMO to just make a simple DSL for this and get all the power of a DSL then try and fit into Python.

It should also be noted that the commands defined in the plugin can still be called like normal Python functions because there is no magic there. The command bar is just a DSL wrapper around them.

Notes

This is still a bit of an experiment for me so things might change or things might not work as full expected just yet.

Check out the projects readme for more info on things that need to be done, open to suggestions and pull requests.

Also see the docs page for more in depth information


Filed under: Open Source, python, qgis Tagged: plugin, pyqgis, qgis

Function editor for QGIS expressions

A new feature for QGIS 2.8 is a function editor for expressions. Being able to define your own custom functions has be possible for a while now, over a year, I even have a plugin (Expressions+) that adds some extra ones, however it wasn’t easy for new users and required you to create files that lived on python path while also editing the startup.py file for QGIS so that functions got registed at start up. Way too much effort for my liking.

This feature is now exposed via the expression builder on the Function Editor tab. The function editor will create new Python files in qgis2\python\expressions and will auto load all functions defined when starting QGIS. I remember Sean Gillies saying that Python support in a field calculator should be a gateway to full Python programming, can’t get any more Python then full Python modules.

The best way to show this feature is a quick video so here it is

The play button in the editor will run the current editor file in the QGIS session and register any functions it finds, it will also save the file in the expressions folder.

You can make a new file by pressing the new file button which will add the basic function template, changing the name in the combobox and hitting save will save the file.

The function editor allows you have to define reuseable functions for your QGIS. If you want to share a function you simply share the .py file from the expressions folder and give it to another user. In future versions of QGIS we might have a way to download other users functions.

Auto expanding values

You can also use the args="auto" keyword in place of the number of args which will let QGIS work it out and expand the arguments for you.

Here is an example

@qgsfunction(args="auto", group='Custom')
def myfunc(value1, value2 feature, parent):
    pass

and can be used like this:

myfunc('test1', 'test2')

QGIS will workout how many arguments your function takes based on what you have defined. Note: The last arguments should always be feature, parent, these are not included in the count.

Raising errors

If you need to report a error from a function simply use the raise method like normal in QGIS and raise an exception.

@qgsfunction(args="auto", group='Custom')
def myfunc(value1, value2 feature, parent):
    raise Expection("Hahah Nope!")

The function wrapper will catch the exception and raise it though the expression engine.

A couple of things to note

  • New functions are only saved in the expressions folder and not in the project file. If you have a project that uses one of your custom functions you will need to also share the .py file in the expressions folder.
  • The editor doesn’t unregister any functions. If you define a function called test, hit play, change the name to test_2, hit play, both functions will exist until you reload QGIS.

Filed under: Open Source

New addition

Stace and I would like to welcome Matilda Anne Woodrow, born 5/1/15 at 10:36am.

tilly

She is a nice way to start 2015.

After the pretty crappy year that was 2014 it was finally nice to see Matilda in the flesh. The relief of seeing her alive and well is hard to put in words after losing Ellie in 2013.

People always ask about the lack of sleep, but it feels like we have more energy now then we did before. The emotional and physical toll that the pregancy took on our family had pretty much run us into the ground and it felt like it was never ending.

The toll of the pregancy had lead me to massive lack of motivation towards QGIS and pretty much everything else in life, which isn’t healthy when you have a family to look after. Pro Tip: Get help if you find yourself in this spot, it be hard to recover if you go over the edge.

Anyway. Here is to a new year. A better year.


Filed under: Open Source

Shortcuts to hide/show panels in QGIS

Just a quick one to show how to assign shortcuts to hide and show for panels in QGIS. Add this to your .qgis2\python\startup.py

from functools import partial
from qgis.utils import iface

from PyQt4.QtCore import *
from PyQt4.QtGui import *

mappings = {"Layers": Qt.ALT + Qt.Key_1,
            "Browser": Qt.ALT + Qt.Key_2,
            "PythonConsole": Qt.ALT + Qt.Key_3}
shortcuts = []

def activated(dock):
    dock = iface.mainWindow().findChild(QDockWidget, dock)
    visible = dock.isVisible()
    dock.setVisible(not visible)

def bind():
    for dock, keys in mappings.iteritems():
        short = QShortcut(QKeySequence(keys), iface.mainWindow())
        short.setContext(Qt.ApplicationShortcut)
        short.activated.connect(partial(activated, dock))
        shortcuts.append(short)

bind()

and now you can hide and show using ALT + number


Filed under: Open Source

Using Hy, a dialect of Lisp for Python, with QGIS

So tonight I rediscovered Hy. I had seen Hy before a while ago but never really sat down and tried it. Tonight just must have been one of those days to try something new.

So Hy is a dialect of Lisp but embedded in Python which means you can use any Python library will using a Lisp dialect. Pretty nifty.

My next thought was, how would this look using the QGIS libraries. So lets give it a try.

First we need to install Hy:

pip install Hy

Now just create a .hy file and add some code

(import qgis)
(import [qgis.core [QgsVectorLayer]])
(import [qgis.core.contextmanagers [qgisapp]])

(setv layers [])

(defn load-layer [file name]
    (setv layer (QgsVectorLayer file name "ogr"))
    (.append layers layer))

(defn print-layer [layer]
    (print "Layer Name:" (.name layer))
    (print "Valid:" (.isValid layer))
    (print "Extents:" (.toString (.extent layer))))

(defn main [app]
    (load-layer r"F:gis_datatest.shp" "test")
    (for [layer layers] (print-layer layer)))


(with [[app (apply qgisapp [] {"guienabled" False})]]
    (print "Loading QGIS")
    (main app))

run it in our shell and bingo.

F:devhy-qgis>hy qgistest.hy
Loading QGIS
Layer Name: test
Valid: True
Extents: 392515.3457026787800714,6461581.2076761415228248 : 392683.3794420150225051,6461705.1012571481987834

Sweet.

Just for reference the Python version of the above would be:

import qgis
from qgis.core import QgsVectorLayer
from qgis.core.contextmanagers import qgisapp

layers = []

def load_layer(file, name):
    layer = QgsVectorLayer(file, name, "ogr")
    layers.append(layer)

def print_layer(layer):
    print "Layer Name:", layer.name()
    print "Valid:", layer.isValid()
    print "Extents:", layer.extent().toString()

def main(app):
    load_layer(r"F:gis_datatest.shp", "test")
    for layer in layers:
        print_layer(layer)

with qgisappl(guienabled=False) as app:
    main(app)

More readable? No doubt, that is why I love Python, however the strange thing is the first time I looked at Lisp, including Hy, I thought “whoa all those parentheses back it up!1!” but strangely after using it for a while (read: not even a few hours) they don’t seem to be an issue, or not much of one anyway. YMMV.

The cool thing with using Hy is you can still use all the libraries you are used to as the example above shows, PyQt, QGIS, anything.

The other interesting, and pretty funky, thing is that you are able to import .hy files like normal Python files. If you create a file winning.hy you can just import winning into any Python application and it works.

Why bother? Mainly because learning something new is never a bad thing, and you never know what you might pick up.

Check out the Hy for more info on what you can do and how it works

I have also created a hy-qgis GitHub repo for some experiments.

Enjoy!


Filed under: Open Source

Animated QGIS map canvas item

Have you ever wanted to animate a QGIS map canvas item. No? Well soon you will.

First we need to create a custom QgsMapCanvasItem

from PyQt4.QtCore import QPointF, QRectF, QTimer, QObject, pyqtProperty, QPropertyAnimation, Qt
from PyQt4.QtGui import QPainter, QBrush, QColor
from qgis.gui import QgsMapCanvasItem
from qgis.core import QgsPoint

class PingLocationMarker(QgsMapCanvasItem):
    """
    Position marker for the current location in the viewer.
    """
    class AniObject(QObject):
        def __init__(self):
            super(PingLocationMarker.AniObject, self).__init_<a href="https://woostuff.files.wordpress.com/2014/10/marker.gif"><img src="https://woostuff.files.wordpress.com/2014/10/marker.gif?w=300" alt="marker" width="300" height="193" class="alignnone size-medium wp-image-61493" /></a>_()
            self._size = 0
            self.startsize = 0
            self.maxsize = 32

        @pyqtProperty(int)
        def size(self):
            return self._size

        @size.setter
        def size(self, value):
            self._size = value

    def __init__(self, canvas):
        self.canvas = canvas
        self.map_pos = QgsPoint(0.0, 0.0)
        self.aniobject = PingLocationMarker.AniObject()
        QgsMapCanvasItem.__init__(self, canvas)
        self.anim = QPropertyAnimation(self.aniobject, "size")
        self.anim.setDuration(1000)
        self.anim.setStartValue(self.aniobject.startsize)
        self.anim.setEndValue(self.aniobject.maxsize)
        self.anim.setLoopCount(-1)
        self.anim.valueChanged.connect(self.value_changed)
        self.anim.start()

    @property
    def size(self):
        return self.aniobject.size

    @property
    def halfsize(self):
        return self.aniobject.maxsize / 2.0

    @property
    def maxsize(self):
        return self.aniobject.maxsize

    def value_changed(self, value):
        self.update()

    def paint(self, painter, xxx, xxx2):
        self.setCenter(self.map_pos)

        rect = QRectF(0 - self.halfsize, 0 - self.halfsize, self.size, self.size)
        painter.setRenderHint(QPainter.Antialiasing)
        painter.setBrush(Qt.green)
        painter.setPen(Qt.green)
        painter.drawEllipse(QPointF(0,0), self.size, self.size)

    def boundingRect(self):
        return QRectF(-self.halfsize * 2.0, -self.halfsize * 2.0, 2.0 * self.maxsize, 2.0 * self.maxsize)

    def setCenter(self, map_pos):
        self.map_pos = map_pos
        self.setPos(self.toCanvasCoordinates(self.map_pos))

    def updatePosition(self):
        self.setCenter(self.map_pos)

marker = PingLocationMarker(iface.mapCanvas())

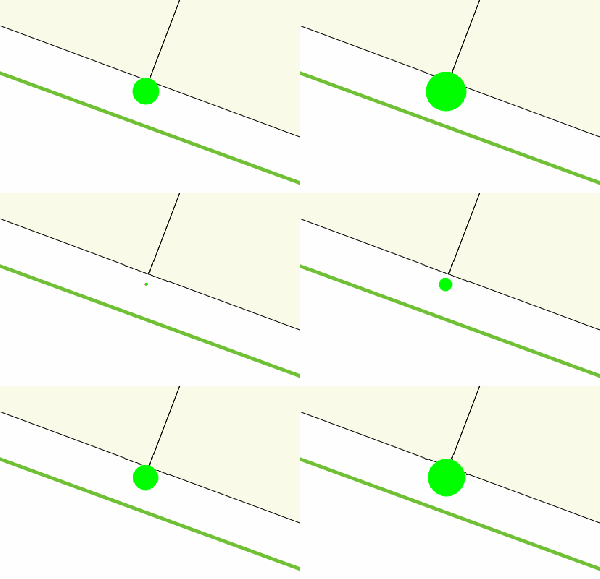
and this is the result

marker

wweeeee animated canvas item.

Run the above code in a QGIS Python console editor window and you should get the same effect.

So what is this magic? Well it turns out to be pretty easy all thanks to the handy class QPropertyAnimation. QPropertyAnimation takes a QObject and sets a property value until the end value is hit over the duration, the cool thing with this class is that it can take any QVariant type, which is pretty much anything, and it will go from start value to end value. You can also use other easing curves to change how the values change over time.

Super nifty!

The main important part of this is:

self.anim = QPropertyAnimation(self.aniobject, "size")
self.anim.setDuration(1000)
self.anim.setStartValue(self.aniobject.startsize)
self.anim.setEndValue(self.aniobject.maxsize)
self.anim.setLoopCount(-1)
self.anim.valueChanged.connect(self.value_changed)
self.anim.start()

which calls the value_changed and self.update() methods, when update is called paint will be called and we grab the current animation value. Note: -1 loop count means run forever.

self.aniobject is a custom QObject to hold our current animation value. QgsMapCanvasItem is not a QObject so we have to make another object to hold that value for us. I tried double inheritance here and it didn’t like it so I went with a nested class which is nice anyway.

And that is all you need to make a animated QgsMapCanvasItem, remember that QPropertyAnimation can be used on any QObject so you could do some pretty cool stuff with this if you have the need.

Be interested to hear any ideas on if we can use this in QGIS.

Note: A canvas item like this isn’t part of any layer. Canvas items live on on the canvas itself, above or below the map image. The markers that you see when you enable editing on a layer are canvas items, as are the lines when drawing a measure line, even the image you see in the canvas is a canvas item, etc.


Filed under: Open Source

Thank you from Stacey and I.

Though the kindness of everyone we made it to over $2000 to donate two, not one like we had planned at the start, camera packs to hospitals that need them. One will be going to the new Gold Coast hospital where Ellie was born and the other to another hospital who needs it. Both cameras will have Ellie’s name on them in her memory. They will go a long way to help preserve the memories of those last minutes just like it did for us with Ellie.

The money is now with Heartfelt and hopefully the cameras will be done soon. I will update this post with photos once they are done.

It was really amazing to see the number of people who I have never meet in person from all over the internet throwing in what they could to help us reach the goal. We are extremely grateful for everything everyone put in.

A massive thanks to everyone who donated:

  • Lyn Noble
  • Kylie and Nathan
  • Luke Bassett
  • Joanne Smith
  • Darryl & Angela Browning
  • Digital Mapping Solutions
  • David Baxter
  • Carl Wezel
  • Grandad and Grandma Woodrow
  • Bill Williamson
  • Helen Gillman
  • Karlie Jones
  • Lisa Gill
  • Andrew & Peta
  • Sally Drews
  • Matt Travis
  • Mummy, Daddy, Harry & Little Sis..
  • Terry Stigers
  • James McKeown
  • Jill Pask
  • Kym Zevenbergen
  • Jessica Nayler
  • Amelia Woodrow
  • Judy Burt
  • Russell and Suzann Woodrow
  • Jenny & Mark Gill
  • Emeley Sands
  • Rebecca Penny
  • Larissa Collins
  • Ross McDonald
  • Shantelle Sweedman
  • Rebbecca Ben izzy Erica
  • Aidan Woodrow & Andrew Smith
  • simbamangu
  • Sarah Rayner
  • Sassá
  • Matt Travis
  • Marco Giana
  • Heikki Vesanto
  • Jorge Sanz
  • Pure K.
  • Toby Bellwood
  • Andy Tice
  • Ujaval Gandhi
  • Matt Robinson
  • Geraldine Hollyman
  • Anonymous
  • Teresa Baldwin
  • Alexandre Neto
  • Chelsea Fell
  • Stephane Bullier
  • Nathan Saylor
  • Adrien ANDRÉ
  • Steven Feldman
  • Anita Graser
  • Chris Scott
  • Vicky Gallardo
  • Anonymous
  • Anonymous
  • Stevie Little

I will also add a massive thank you to DMS who has been super supportive though this whole year since Elly died, and they know very well the effect it has had on Stace and I over the past year.

In a perfect world we would never had to run a fund raiser for this but I’m glad Heartfelt exist to help those of us in need at the time.

Thank you from Stacey and I.


Filed under: Open Source

QGIS atlas on non geometry tables

This is proof that no matter how close you are to a project you can still miss some really cool stuff that you never knew or considered was possible.

The problem to solve:

You have a CSV with a row of colours. Each row should be a new map and each column is the colour for that feature.

This is example of that kind of input

A       B
#93b2f3    #FF0000 
#dfbdbb    #FF0000
#f9d230    #FF0000

This questhion was asked on GIS.SE this morning. When I first saw it I had no idea it was even possible, I was thinking along the same lines as the person asking, that it would have to be done with Python. Not hard, but a lot harder then something built in and I put it in the too hard basket. I thought the atlas can almost do that, almost but not really.

Well almost was wrong. It can.

Note: You will need QGIS 2.5 (2.6 when released) for this to work

Lets make some cool maps! (and go to GIS.SE and upvote Nyalls answer)

First open your vector layer and the CSV. Don’t worry about style just yet, we will do it later.

Create a composer and add your map.

Here comes the first part of the trick.

Enable Atlas and set the coverage layer to the CSV layer. Wait? What? That doesn’t make any sense. If you think about it for a while it does. We need a map for each row (or “feature”) in the CSV and atlas does just that.

atlas_colours

How do we style the features? Well here is the other part of the trick. In 2.6 there is a magic expression function that returns a field value from another feature. And it’s as simple as attribute( $atlasfeature , 'A' ) – give me the attribute from the current atlas feature for field ‘A’. Simple.

First we categorize our features so we have a symbol for each feature. I’m using a sample layer I have but you can understand how this works. The first feature is A and the other is B, etc, etc

render

Now to use another awesome feature of QGIS. The data defined symbol properties (and labels too). Change each symbol and define the colour data defined property. Using attribute( $atlasfeature , 'A' ) for the first one and attribute( $atlasfeature , 'B' ) for the second.

atlas_feature

That is it. Now jump back over to your composer and enable Atlas preview.

atlas1

atlas2

Bam! Magic! How awesome is that!

Now my other thought was. “Ok cool, but the legend won’t update”. I should learn by now not to assume anything. The legend will also update based on the colours from the feature.

atlas1_legend

atlas2_legend

How far can we take this. What if you need the label to match the colour. Simple just make the label text look like this:

<h1 style='color:[% "A" %]'>This is the colour of A</h1>

atlas1_label

Heaps of credit to Nyall and the others who have added all this great stuff to the composer, atlas, and the data defined properties. It’s not something that you will do every day but it’s great to see the flexibility of QGIS in these situations.

You can even make the background colour of the page match the atlas feature

atlas1_back

but don’t do that because people might think you are mad ;)


Filed under: Open Source

Fundraising for Eloise and Heartfelt

The death of our daughter was one of the hardest things my wife and I have ever had to deal with. It’s not something that I wish anyone ever have to experience and feel really sorry for those who have had to do it many times. There is something really raw about losing your own flesh and blood. It cuts deep, really really deep. There are really no words to describe the emptiness that you feel, or the feelings that follow after the event. Even with all the pain of loosing a child there is a great Australian service that helps to capture some of the final monents. The service is called Heartfelt and we used them for Ellie.

Heartfelt is a great free service that provides a photo session, including editing and prints (hard and digital) after, in the last and final days. This is the quote from their site:

Heartfelt is a volunteer organisation of professional photographers from all over Australia dedicated to giving the gift of photographic memories to families that have experienced stillbirths, premature births, or have children with serious and terminal illnesses.

Heartfelt is dedicated to providing this gift to families in a caring, compassionate manner.

All services are provided free of charge

Pretty impressive stuff. The last thing you want to have to do in a time like that is shell out for photos when you have other pressing issues.

As Ellie’s 1st Birthday is coming in up October Stace and I would love to raise enough money to donate a camera pack to a hospital though Heartfelt in Elly’s name. We have created a fundraiser page in her name at: http://www.mycause.com.au/page/79669/eloises1stbirthdayheartfelt in order collect dontations for anyone who would like to help.

Camera packs can be donated to a hospital to allow staff at the hospital to capture photos if Heartfelt can’t make it. The bonus is that Heartfelt will still edit and print the photos. How bloody awesome is that! More info on the camera packs is at: http://www.mycause.com.au/page/79669/eloises1stbirthdayheartfelt

We would be greatful for any donations, big or small, so we can donate a camera pack in Elly’s name.

We love and miss you a lot Eloise.


Filed under: Open Source

Function editor for QGIS expressions

A new feature for QGIS 2.8 is a function editor for expressions. Being able to define your own custom functions has be possible for a while now, over a year, I even have a plugin (Expressions+) that adds some extra ones, however it wasn’t easy for new users and required you to create files that lived on python path while also editing the startup.py file for QGIS so that functions got registed at start up. Way too much effort for my liking.

This feature is now exposed via the expression builder on the Function Editor tab. The function editor will create new Python files in qgis2\python\expressions and will auto load all functions defined when starting QGIS. I remember Sean Gillies saying that Python support in a field calculator should be a gateway to full Python programming, can’t get any more Python then full Python modules.

The best way to show this feature is a quick video so here it is

The play button in the editor will run the current editor file in the QGIS session and register any functions it finds, it will also save the file in the expressions folder.

You can make a new file by pressing the new file button which will add the basic function template, changing the name in the combobox and hitting save will save the file.

The function editor allows you have to define reuseable functions for your QGIS. If you want to share a function you simply share the .py file from the expressions folder and give it to another user. In future versions of QGIS we might have a way to download other users functions.

Auto expanding values

You can also use the args="auto" keyword in place of the number of args which will let QGIS work it out and expand the arguments for you.

Here is an example

@qgsfunction(args="auto", group='Custom')
def myfunc(value1, value2 feature, parent):
    pass

and can be used like this:

myfunc('test1', 'test2')

QGIS will workout how many arguments your function takes based on what you have defined. Note: The last arguments should always be feature, parent, these are not included in the count.

Raising errors

If you need to report a error from a function simply use the raise method like normal in QGIS and raise an exception.

@qgsfunction(args="auto", group='Custom')
def myfunc(value1, value2 feature, parent):
    raise Expection("Hahah Nope!")

The function wrapper will catch the exception and raise it though the expression engine.

A couple of things to note

  • New functions are only saved in the expressions folder and not in the project file. If you have a project that uses one of your custom functions you will need to also share the .py file in the expressions folder.
  • The editor doesn’t unregister any functions. If you define a function called test, hit play, change the name to test_2, hit play, both functions will exist until you reload QGIS.

Filed under: Open Source

  • <<
  • Page 2 of 6 ( 108 posts )
  • >>
  • open source

Back to Top

Sustaining Members