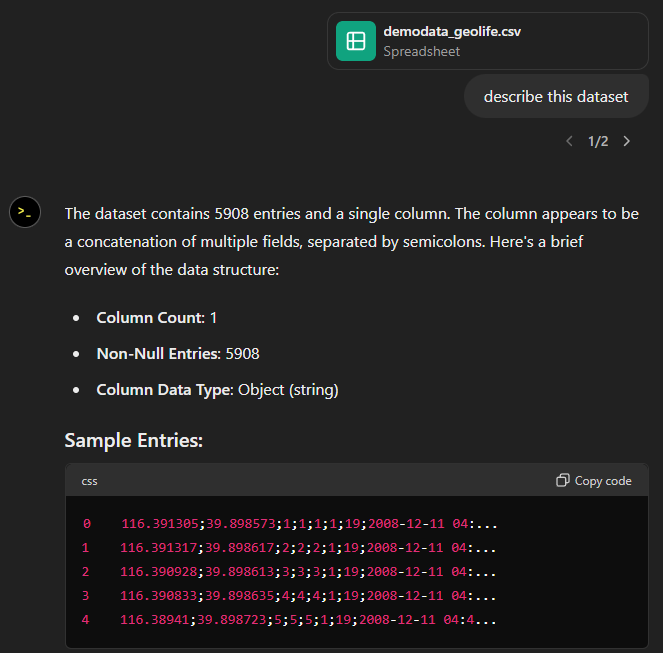
New interactive trajectory plots for MovingPandas & experiments on their interpretation using ChatGPT 4o

With the release of GeoPandas 1.0 this month, we’ve been finally able to close a long-standing issue in MovingPandas by adding support for the explore function which provides interactive maps using Folium and Leaflet.

Explore() will be available in the upcoming MovingPandas 0.19 release if your Python environment includes GeoPandas >= 1.0 and Folium. Of course, if you are curious, you can already test this new functionality using the current development version.
This enables users to access interactive trajectory plots even in environments where it is not possible to install geoviews / hvplot (the previously only option for interactive plots in MovingPandas).
I really like the legend for the speed color gradient, but unfortunately, the legend labels are not readable on the dark background map since they lack the semi-transparent white background that has been applied to the scale bar and credits label.

Speaking of reading / interpreting the plots …
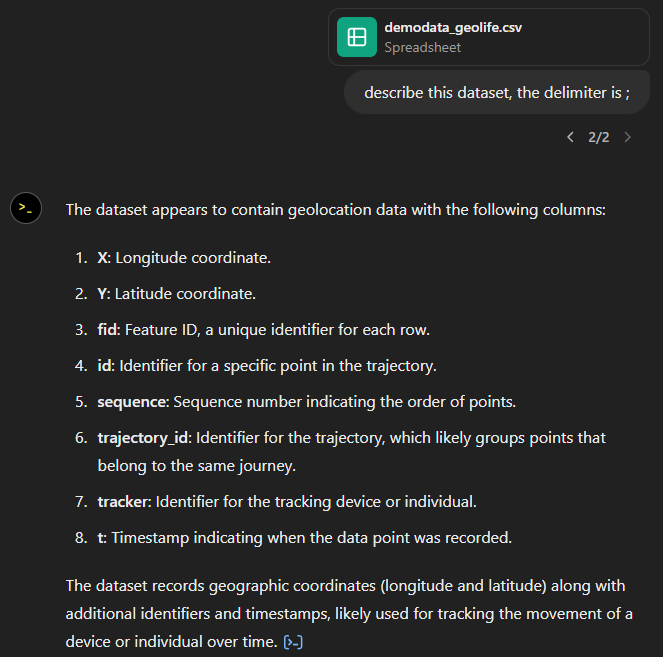
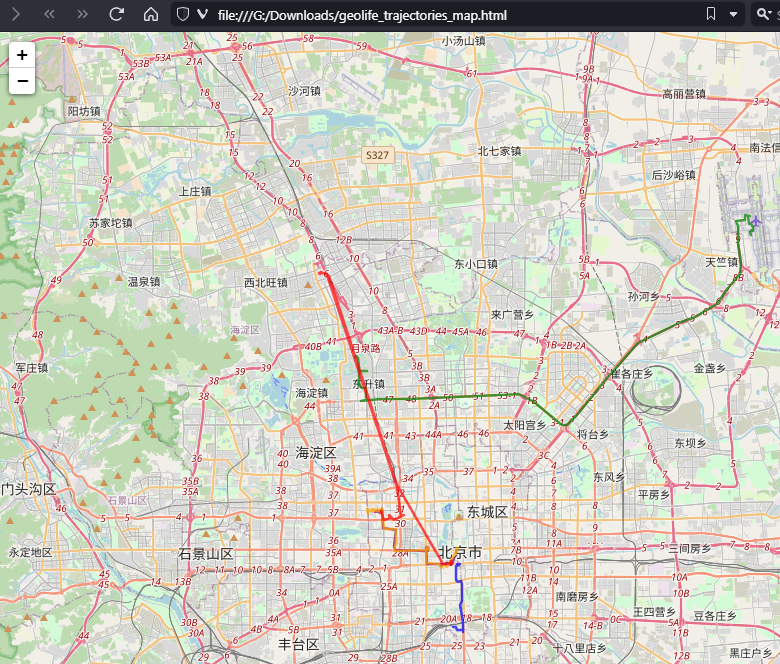
You’ve probably seen the claims that AI will help make tools more accessible. Clearly AI can interpret and describe photos, but can it also interpret MovingPandas plots?
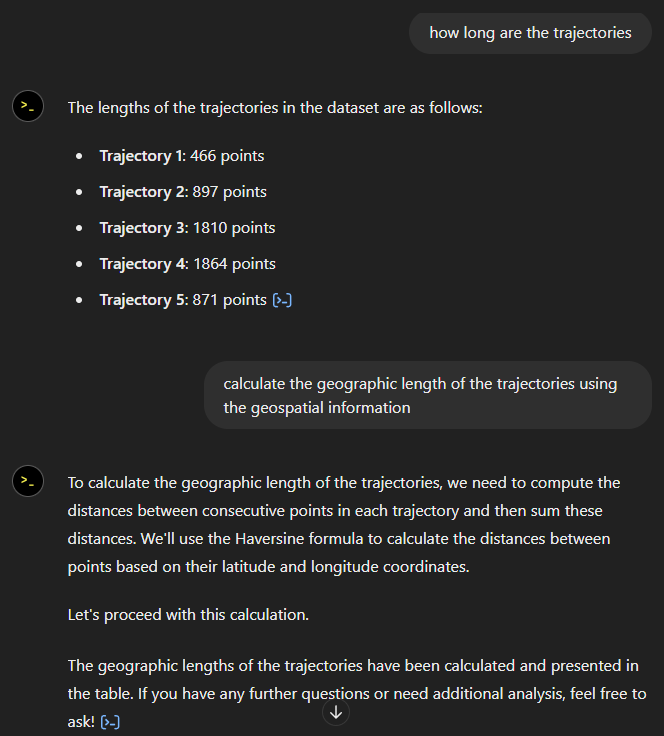
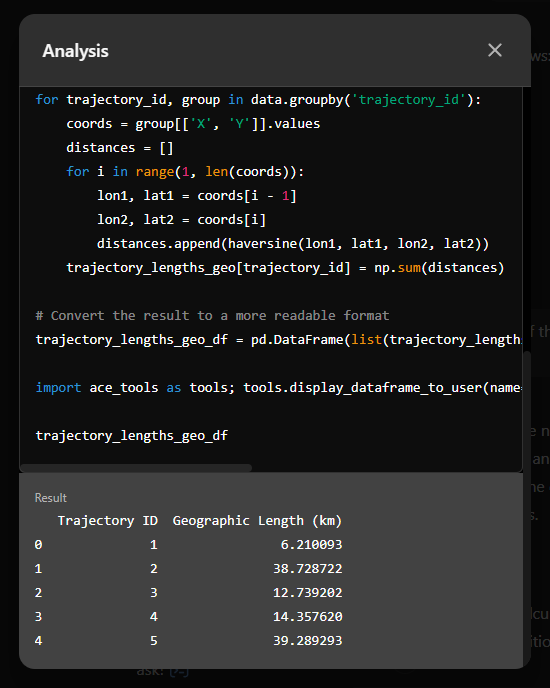
ChatGPT 4o interpretations of MovingPandas plots

Not bad.
And what happens if we ask it to interpret the animated GIF from the beginning of the blog post?

So it looks like ChatGPT extracts 12 frames and analyzes them to answer our question:

Its guesses are not completely off but it made up the facts such as that the view shows “how traffic speeds vary over time”.
The problem remains that models such as ChatGPT rather make up interpretations than concede when they do not have enough information to make a reliable statement.


