Users now have the flexibility to utilize a variety of distance units in the stake out mode, moving beyond the conventional meters. This enhancement allows for a more customized and user-friendly experience, catering to diverse geographic contexts and preferences.
To configure these distance units, navigate to QGIS project settings and change “distance units“ to your preferred units.
In our latest update, we've turbocharged the speed of feature identification on the map! Enjoy a faster and more responsive experience as you navigate and identify features with efficiency.
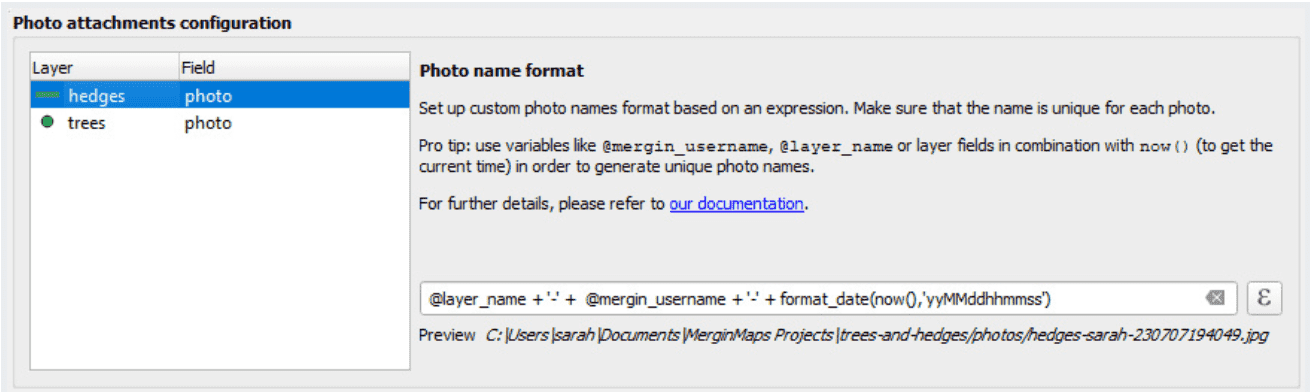
Mergin Maps QGIS plugin is now capable of setting a custom QGIS expression that will be used as a name for the photos taken in the Mergin Maps mobile app. It is possible to combine field values, variables (even Mergin Maps variables) and other QGIS expression elements to create your custom photo name format (subfolders supported). You can find this configuration in the QGIS project settings > Mergin Maps.
Available since Mergin Maps QGIS plugin 2023.2 and Mergin Maps mobile 2.2
David Galloway works as a volunteer with the Wallcliffe Volunteer Fire Brigade in Western Australia. Volunteer brigades are the front line of firefighting and prevention across the State.
With the recent changes to the Mergin Maps plugin for QGIS, you can visualise the local changes before synchronising your data. Read more in our blog post!
Introducing an easier way to prepare offline projects!
Now, you can download vector tile layers seamlessly by simply right-clicking on the layer and selecting 'Make available offline...' - making offline project preparation a breeze.
For a step-by-step guide, check out our documentation here. Enhance your offline mapping experience today!
With Mergin Maps QGIS Plugin 2024.1 you can now revert local changes of your QGIS project. Click on synchronise button in the toolbar and in the “Project status” dialog you will see new button to “Reset Changes”
I’m continuously testing the algorithms integrated so far to see if they work as GIS users would expect and can to ensure that they can be integrated in Processing model seamlessly.
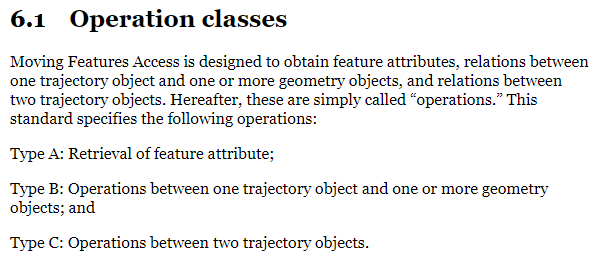
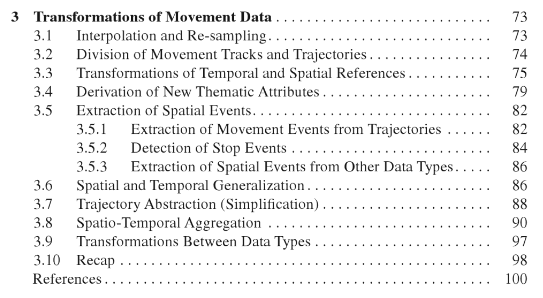
Because naming things is tricky, I’m currently struggling with how to best group the toolbox algorithms into meaningful categories. I looked into the categories mentioned in OGC Moving Features Access but honestly found them kind of lacking:
… but I’m not convinced yet. So take the above listed three categories with a grain of salt. Those may change before the release. (Any inputs / feedback / recommendation welcome!)
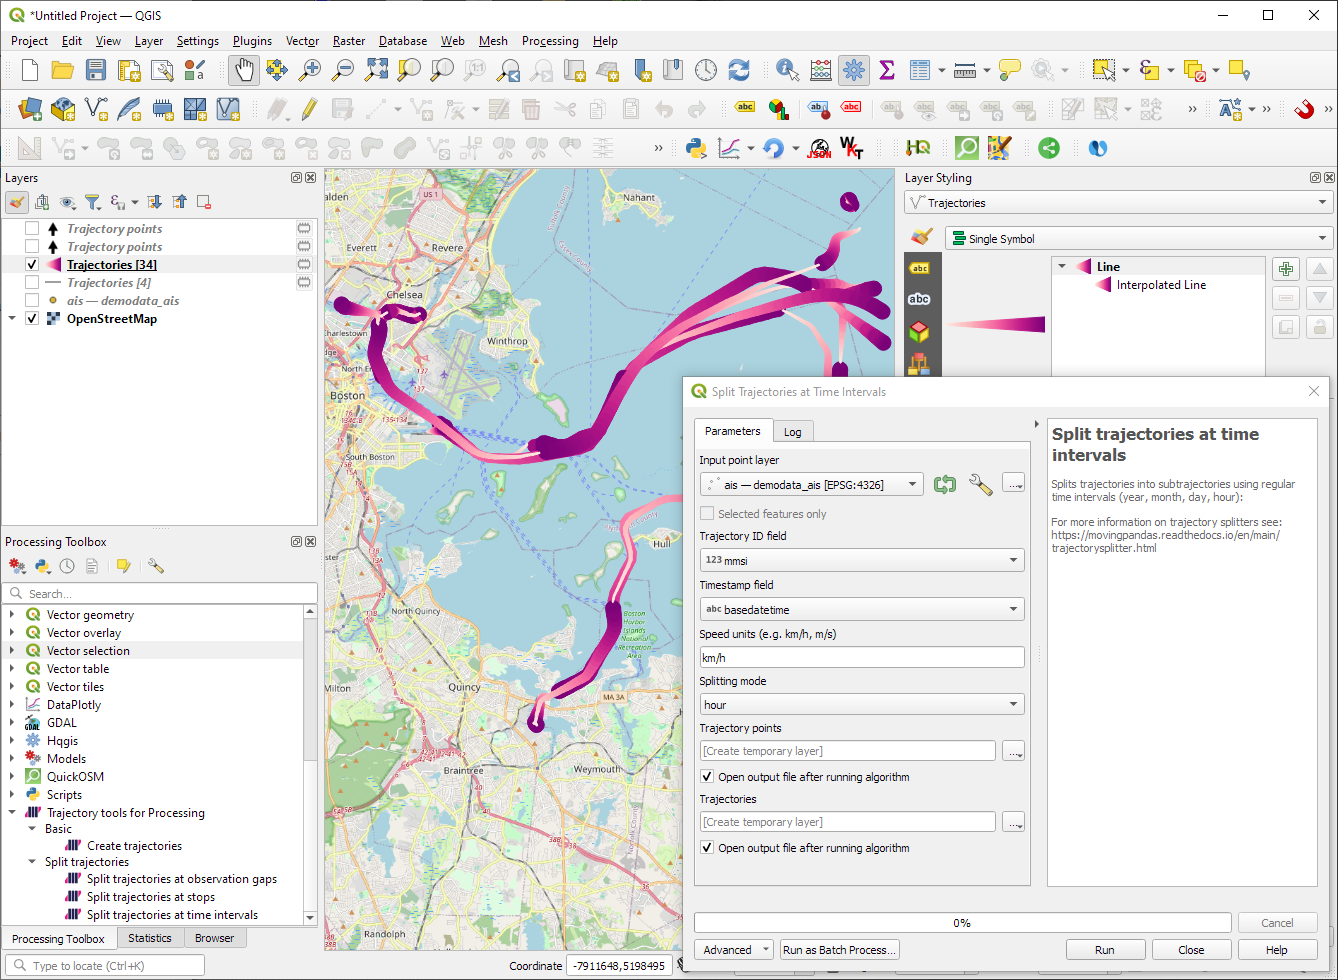
Let me close this quick status update with a screencast showcasing stop detection in AIS data, featuring the recently added trajectory styling using interpolated lines:
Trajectools development started back in 2018 but has been on hold since 2020 when I realized that it would be necessary to first develop a solid trajectory analysis library. With the MovingPandas library in place, I’ve now started to reboot Trajectools.
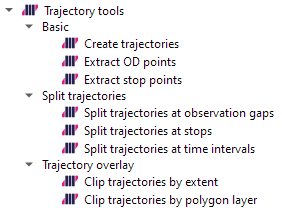
Trajectools v2 builds on MovingPandas and exposes its trajectory analysis algorithms in the QGIS Processing Toolbox. So far, I have integrated the basic steps of
Building trajectories including speed and direction information from timestamped points and
Splitting trajectories at observation gaps, stops, or regular time intervals.
The algorithms create two output layers:
Trajectory points with speed and direction information that are styled using arrow markers
Trajectories as LineStringMs which makes it straightforward to count the number of trajectories and to visualize where one trajectory ends and another starts.
So far, the default style for the trajectory points is hard-coded to apply the Turbo color ramp on the speed column with values from 0 to 50 (since I’m simply loading a ready-made QML). By default, the speed is calculated as km/h but that can be customized:
I don’t have a solution yet to automatically create a style for the trajectory lines layer. Ideally, the style should be a categorized renderer that assigns random colors based on the trajectory id column. But in this case, it’s not enough to just load a QML.
In the meantime, I might instead include an Interpolated Line style. What do you think?
Of course, the goal is to make Trajectools interoperable with as many existing QGIS Processing Toolbox algorithms as possible to enable efficient Mobility Data Science workflows.
The easiest way to set up QGIS with MovingPandas Python environment is to install both from conda. You can find the instructions together with the latest Trajectools development version at: https://github.com/movingpandas/qgis-processing-trajectory


 Available since Mergin Maps QGIS plugin 2023.2 and Mergin Maps mobile 2.2