Related Plugins and Tags

QGIS Planet

Importing a DBF containing X-Y Values into QGIS

Suppose you have a DBF (.dbf) file containing X and Y values that you want to import and save as a spatial layer.

QGIS doesn’t support direct import of a DBF file as a map layer, however, we can use some command line magic to convert it to a CSV file and then use the Delimited Text plugin to get the job done.

Your DBF file should have an id for each record and fields containing X and Y values. If it has additional fields that should be OK as well.

First convert the DBF to a comma delimited file using ogr2ogr:
ogr2ogr -f CSV my_csv my_data.dbf

If you don’t have ogr2ogr see http://www.gdal.org/index.html.

This will create my_data.csv in the my_csv directory. You are now ready to bring it into QGIS.

Here are the steps to import the CSV:

  1. Start QGIS
  2. If not already enabled, use the plugin manager to enable the Delimited Text plugin
  3. Click on the Delimited Text icon in the Plugin toolbar or choose it from the Plugins menu
  4. Browse to the location of your CSV file
  5. Enter a name for the layer
  6. Under Selected delimiters, check Comma
  7. If your X and Y fields aren’t automatically determined, set them using the drop-down boxes
  8. The sample text should show how the file is being parsed—if it looks right click OK, otherwise adjust the settings
  9. The layer is added to QGIS

Delmited Text plugin ready to import CSV

At this point the layer behaves pretty much like any other QGIS layer. To save it as a shapefile, right click on its name in the legend and choose Save as…

Developing QGIS Plugins with git

Writing a QGIS plugin is not overly complicated but represents a bit of work. Using
git in conjunction with your development efforts can make sure your investment in
coding time is preserved.

Development Tools

The QGIS project team has set up a central location for plugin development which includes pretty much everything you need to develop and support your plugins, including:

  • Issue tracking
  • Wiki
  • Documents
  • Repository

The repository feature allows you to create a central place to store your plugin code using git. Others can clone your repository and contribute through patches or pull requests.

Creating a Plugin

The chore of setting up the boilerplate for a plugin is made simple by using the Plugin Builder. Previously this was a web application but it has now been replaced by a QGIS plugin aptly named Plugin Builder. You can install Plugin Builder from within QGIS by selecting Fetch Python Plugins… from the Plugins menu.

Once Plugin Builder is installed you can quickly create a starter plugin that implements a simple dialog box with OK and Cancel buttons. The plugin created by Plugin Builder is fully functional—it will load in QGIS but not do anything useful until you customize it.

Setting up the Workflow

You have a couple of options for setting up your development directory and workflow:

  1. Copy your plugin template to the QGIS plugin directory, initialize the git repository, and develop from there.
  2. Work within your plugin template directory that was created by Plugin Builder (not within the QGIS plugin directory)

Option one is very convenient as long as you don’t test the uninstall feature of your plugin. This will delete your entire plugin directory and git repository—not what we really want.

Option two is safer, however to test your plugin you have to continually copy from your development area to your QGIS plugin directory. Alternatively you could make commits and pull from your development area to the copy (assuming it is a git repo) in the QGIS plugin directory. If you are on a unix based system you could also create a Makefile to deploy the plugin for you.

The best solution is to use option two and use the QGIS_PLUGINPATH environment variable to point to your development directory. When present, QGIS_PLUGINPATH tells QGIS to search additional directories for plugins. Going this route allows you to develop in the directory created by Plugin Builder and test your plugin without any copying or pulling. The upside to this is since your plugin wasn’t installed through the Plugin Installer it can’t be uninstalled accidentally. When you are ready to test the uninstall and unloading of your plugin you can copy it to the main QGIS plugin directory.

Note: If you are using Windows there was a problem specifying QGIS_PLUGINPATH with colons in the path. This issue is fixed in revision 15073 and will make it into the next release.

No matter how you implement your workflow I suggest creating a repository on the QGIS hub (http://hub.qgis.org) or github.com.

Summary

Here is a summary of the steps to get started. We’ll assume your new plugin is named zoomer:

  1. Install Plugin Builder
  2. Create a directory that will contain all your plugins, for example my_plugins
  3. Create your plugin template using Plugin Builder. Be sure to select my_plugins when Plugin Builder asks where to create your plugin.
  4. Change to your plugin directory (e.g. my_plugins/zoomer) created by Plugin Buidler and create a git repository using:
    git init
  5. Set the QGIS_PLUGINPATH evironment variable to point to the directory containing your plugin directory (my_plugins). Be sure to use the full path to my_plugins
  6. Start QGIS and use the Plugin Manager (Manage Plugins… from the Plugins menu) to enable your plugin. If it doesn’t show up in the list of plugins check to make sure you have set QGIS_PLUGINPATH correctly.
  7. Develop away, testing as you go. Make sure to commit changes regularly and push them to your repository on hub.qgis.org.

If you are new to git, take a look at the Pro Git book at http://progit.org/.

For help on developing QGIS plugins with Python, see the PyQGIS Cookbook.

QGIS and GRASS in Local Government Bushfire Hazard Mapping – A Case Study

QGIS and GRASS in Local Government Bushfire Hazard MappingIntroduction

The Southern Downs Regional Council (SDRC) is a small-to-medium sized local government in south east Queensland, Australia. The council region, mainly the southern part, suffers from major bushfires.  Bushfire is a real and present concern for the residents and landowners in the Southern Downs Region, and has resulted in the loss of life and property.

This project will allow the council and the people of the region to be more aware of the risk and to allow for better decision making in the future.

The Project
As bushfire is not only a problem for SDRC but also for the whole of Queensland, the state government requires that each local government identifies the bushfire hazard in their area via the State Planning Policy 1/03 Mitigating the Adverse Impacts of Flood, Bushfire and Landslide [1].  This kind of job would normally be done using consultants but was instead done by the council itself using a combination of QGIS and GRASS.

The GIS side of the project project was broken down into 6 main steps

  1. Slope assessment and mapping
  2. Aspect assessment and mapping
  3. Vegetation assessment and mapping
  4. Combining scores to identify the severity of bushfire hazard
  5. Field verification and qualitative assessment
  6. Final Maps

The use of QGIS and GRASS
QGIS, using the GRASS plugin, was selected as it provided the tools needed to complete the job and the interaction between QGIS and GRASS made it easy to process the raster maps and present them in a meaningful way to users.  SDRC uses MapInfo for its main GIS system, however MapInfo’s addons were not as powerful as GRASS GIS for raster processing.

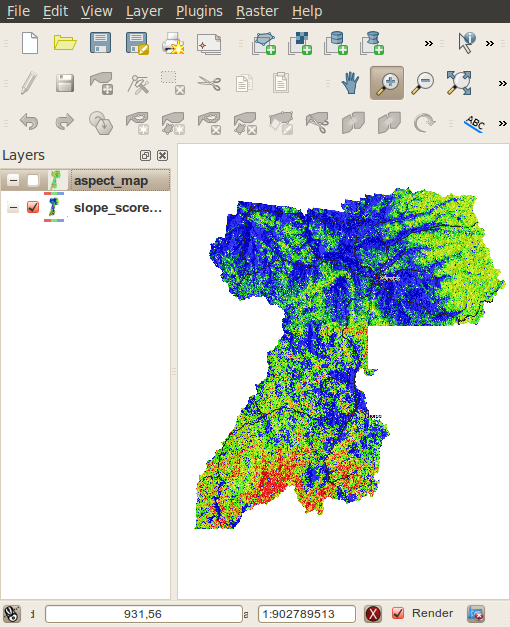
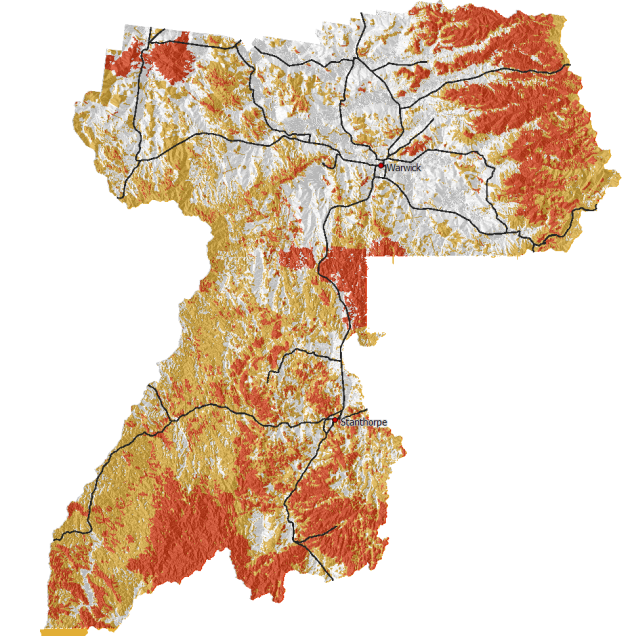
The QGIS GRASS plugin was used to import 5 meter contours of the whole region into GRASS which were then converted into a contour raster map using r.surf.contour.  A slope and aspect map were then generated using r.slope.aspect from the raster contour map.  Categories groups were assigned to different slope and aspect ranges and given a risk sore.  Vegetation areas were also given different risk scores.  All the resulting raster maps were then combined using mapcalc and given a final risk hazard score.  The risk scores are then divided into three main categories: high; medium; and low.  

The final part of the process was field verification via the rural fire service. After the review process, QGIS was used to print the final maps for presentation.

As all GRASS commands can be run from the command line, all the commands that were needed to generate the bushfire hazard maps were recorded, for documentation purposes and for if the maps needed to be regenerated some time in the future.

Conclusion.
Overall QGIS, together with the GRASS plugin, provided a great experience and a great final outcome for the council doing their own bushfire hazard mapping.  The GRASS plugin provides a very easy to use interface to GRASS through QGIS.  As QGIS is able to open the GRASS raster format natively, integration is very seamless and maps can be made with ease.

The project won an encouragement award at the Queensland Planning Institute of Australia state planning awards in 2010 [2]

References
[1] http://www.emergency.qld.gov.au/publications/spp/
[2]http://digital.crowtherblayne.com.au/default.aspx?xml=crowther_pia.xml


Filed under: Open Source, qgis Tagged: bushfire, case study, GRASS GIS, Open Source, qgis, Quantum GIS

Evolution of QGIS

An interesting visualization of QGIS development over the last eight years:

http://woostuff.wordpress.com/2011/01/03/generating-a-gource-source-commit-history-visualization-for-qgis-quantum-gis/

Generating a Gource source commit history visualization for QGIS (Quantum GIS)

A couple of days I found a pretty cool open source project for visualizing the history of version controlled code.  The project is called Gource and can be found here: http://code.google.com/p/gource/ On the videos wiki page there are a few videos of other projects that have used gource to generate cool videos of their commit history so I thought I should make one for QGIS.

After downloading and building the latest source for Gource and fetching the current trunk of QGIS following these instructions: http://spatialgalaxy.net/2010/12/27/contributing-to-qgis-using-git/ I ran the following in my terminal on my Ubuntu machine, with my current directory being the download git repo from the above instructions:

  gource --title "Quantum GIS" --logo images\icons\qgis-icon.png \
  --hide filenames --date-format "%d, %B %Y" --seconds-per-day 0.15 \
  --highlight-all-users --auto-skip-seconds 0.5 --file-idle-time 0 --max-files 999999999 \
  --multi-sampling --stop-at-end --elasticity 0.1 -b 000000 \
  --disable-progress --user-friction .2 --output-ppm-stream - | \
  ffmpeg -an -threads 4 -y -b 3000K -vb 8000000 -r 60 -f image2pipe \
  -vcodec ppm -i - -vcodec libx264 -vpre libx264-medium qgis.mp4

Don’t worry I know it looks crazy but it’s really not that bad.  I’ll break it down.

  • –title “Quantum GIS” Well, yeah, adds a title to the project.
  • –logo images/icons/qgis-icon.png Adds a icon watermark
  • –hide filenames This hides the filenames of the files being committed . I hide these because it makes it pretty hard to see.
  • –date-format “%d, %B %Y” Formats the date at the top of the video.
  • –seconds-per-day 0.15 How many seconds represent a day. The lower this is the fast a day goes by, meaning me commits in less time.
  • –highlight-all-users Highlights all the users all the time.
  • –auto-skip-seconds 0.5 If there are no commits for this time it will skip to the next commit.
  • –file-idle-time 0 How long before the file disappears from the video, 0 means never good for seeing the full file tree.
  • –stop-at-end Stops the video at the end of all the commits.
  • -b 000000 The background colour, in this case black.
  • –output-ppm-stream – Tells gource to output the result ppm stream to STDOUT, which is then piped ( | ) into the ffmpeg

That is a quick overview of some of the gource arguments, running grouce -H in your terminal will print out the full list.  I’m not going to go into the ffmpeg arguments because frankly I don’t understand them very well and video isn’t really my thing.  I’m sure there are ffmpeg experts that would be able to do it better then what I have.

After running the above commands in my terminal window and letting it do its thing, I had a resulting mp4 file which I then uploaded to YouTube.

Below is the video that I uploaded to YouTube, which took about 5 hours due to my very very slow (read 138kb/s) upload speed.  The video is about 8 years of QGIS development in just over 9 minutes.

As it’s a bit hard to see in the video due to the quality, each cluster of files is a directory and the branches show the folder hierarchy.

Direct link to video: http://www.youtube.com/watch?v=-NILKRiMtcU

Happy new year and happy coding :)


Filed under: Open Source, qgis Tagged: git, Gource, mapping, Open Source, qgis, Quantum GIS

Contributing to QGIS Using Git

One of the challenges in any open source project is accepting contributions from people that don’t have, need, or want access to your centralized source code repository. Managing repository accounts for occasional or one-time contributors can be come a bit of an administrative issue. To date, the QGIS project has accepted one-time or occasional contributions through patches submitted via a help ticket.

To make it easier for you to contribute to QGIS, we have created a clone of the Subversion repository on GitHub. This allows you to “fork” the QGIS repository and have your own local copy of the source code. Through GitHub you can easily submit your enhancements and bug fixes for inclusion in the Subversion repository.

You will need to install git on your computer and create a GitHub account. Once you have done that, here is the process for creating your working copy and contributing to QGIS:

  1. Login to GitHub
  2. Fork the project at https://github.com/qgis/qgis by clicking “Fork”. This may take a while
  3. Create a working copy, replacing g-sherman with your GitHub name:
    git clone [email protected]:g-sherman/qgis.git

    This will also take a while, depending on the speed of your network connection. My clone downloaded 162 Mb from GitHub.

  4. Change to the directory containing your local clone and add a reference to the original QGIS repo:
    git remote add upstream git://github.com/qgis/qgis.git

    This gives you are reference named upstream that points to the repo you forked.

  5. Now fetch from upstream:
    git fetch upstream

  6. Now you are ready to work with QGIS. Make your changes, commit them, and then push back to your fork on GitHub:
    git push origin master

  7. You can go to your repo on GitHub and you should see your commit message from the push
  8. Now you want to tell the QGIS developer team there is something they should look at. You do this by issuing a pull request by clicking on the “Pull Request” button on your GitHub QGIS fork page.
  9. Fill in a title and message for the request, review the commit(s) and file(s) involved and when satisfied, click “Send pull request”

  10. Now sit back and wait for someone to review, comment on, and hopefully merge your request into the QGIS repo.

    To keep in sync with the QGIS repo, use
    git fetch upstream
    git merge upstream/master

    Make sure to check out these resources for help and more information on working with repositories on GitHub:

GeoApt Spatial Data Browser

This is a project I have had lingering around for a while. It is a geospatial data browser written in Python using the PyQt and QGIS bindings. It allows you to navigate a tree structure and preview raster and vector datasets. Metadata extracted from the data can be viewed as well. It supports drag and drop for any target that accepts filenames (e.g. QGIS). For screenshots and more, see http://geoapt.com/geoapt-data-browser.

The code is now available on GitHub (see https://github.com/g-sherman/GeoApt) and ready for you to contribute. Take a look and if you want to get your hands dirty fork the project and start coding.

Lots of features are missing—consider this an alpha version…

Git Merge – No Problem

Using Git with Subversion makes adding new features easy. Here are the metrics for my latest QGIS hack:

  • SVN revisions by others while working on my branch: 177
  • Time to complete merge with latest SVN revision: 1 second
  • Conflicts: None

Coincidence? Maybe not.

Google Summer of Code 2010 – Quantum GIS

The application deadline for the Google Summer of Code is nearing (April 9).

If you are interested in working on QGIS as part of GSOC and need ideas, please see Quantum GIS Wiki.

We are waiting for your proposal!

  • <<
  • Page 4 of 4 ( 69 posts )
  • quantum gis

Back to Top

Sustaining Members