Mapping Open Data With Open GIS
This post explores some cartographic features of QGIS while mapping the river network of Tirol, Austria. All data used is freely available.
For the background, I downloaded NASA SRTM elevation data from CGIAR-CSI and created a hillshade using Terrain Analysis tools in QGIS 1.8.
To emphasize both state borders and the fact that Tirol consists of two separate areas, I created a mask using the Difference tool and styled it a transparent white.
The river network is too dense to label all rivers on an A4 map. Expression-based labels make it possible to only label selected features. For this dataset, the expression limits labeling to features with certain values of GEW_WRRL attribute:
CASE WHEN (GEW_WRRL = '10.000 km2 Fluss' OR "GEW_WRRL"= '4.000 km2 Fluss' OR "GEW_WRRL"='1.000 km2 Fluss') AND length("GEW_NAME_A") < 10 THEN "GEW_NAME_A" END
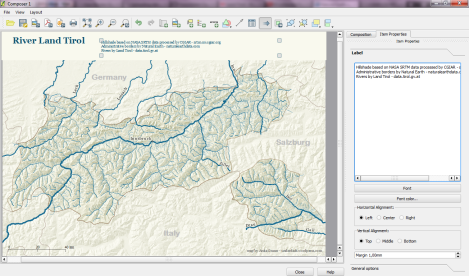
Labels of neighboring areas together with map title, descriptions and scale bar were added in Print Composer.
Working with Print Composer, it is useful to know that you can use Copy&Paste to duplicate map components and right-click to lock them from being moved. Also, every new component by default comes with a black outline and white background which can (and should) be disabled/changed in “General options”.
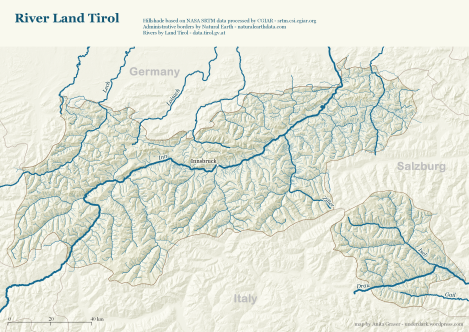
This is the final QGIS Print Composer output – without any further post-processing in Inkscape or Gimp:


