Related Plugins and Tags

QGIS Planet

Spatial on air: talking Python on the MapScaping Podcast

Podcasts have become huge. I’m an avid listener of podcasts myself. I particularly enjoy formats that take the time to talk about unconventional topics in detail.

My first podcast experience was on the QGIS podcast hosted by Tim Sutton in 2014. Unfortunately, it seems like the podcast episodes are not online anymore.

Recently, I had the pleasure to join the MapScaping Podcast by Daniel O’Donohue to talk about Python for Geospatial: 

Other guests Daniel has already interviewed include:

Another geospatial podcast I really enjoy is The Mappyist Hour by Silas and Todd. Unfortunately, it’s a bit silent there now but it’s definitely worth to listen into their episode archive. One of my favorites is Episode 9 where Linda Stevens (Hecht) discusses her career at ESRI, the future of GIS, and the role of Open Source Spatial in that future:

If you listen to and want to recommend other spatial podcasts, please share them in the comments!

Movement data in GIS #29: power your web apps with movement data using mobilitydb-sqlalchemy

This is a guest post by Bommakanti Krishna Chaitanya @chaitan94

Introduction

This post introduces mobilitydb-sqlalchemy, a tool I’m developing to make it easier for developers to use movement data in web applications. Many web developers use Object Relational Mappers such as SQLAlchemy to read/write Python objects from/to a database.

Mobilitydb-sqlalchemy integrates the moving objects database MobilityDB into SQLAlchemy and Flask. This is an important step towards dealing with trajectory data using appropriate spatiotemporal data structures rather than plain spatial points or polylines.

To make it even better, mobilitydb-sqlalchemy also supports MovingPandas. This makes it possible to write MovingPandas trajectory objects directly to MobilityDB.

For this post, I have made a demo application which you can find live at https://mobilitydb-sqlalchemy-demo.adonmo.com/. The code for this demo app is open source and available on GitHub. Feel free to explore both the demo app and code!

In the following sections, I will explain the most important parts of this demo app, to show how to use mobilitydb-sqlalchemy in your own webapp. If you want to reproduce this demo, you can clone the demo repository and do a “docker-compose up –build” as it automatically sets up this docker image for you along with running the backend and frontend. Just follow the instructions in README.md for more details.

Declaring your models

For the demo, we used a very simple table – with just two columns – an id and a tgeompoint column for the trip data. Using mobilitydb-sqlalchemy this is as simple as defining any regular table:

from flask_sqlalchemy import SQLAlchemy
from mobilitydb_sqlalchemy import TGeomPoint

db = SQLAlchemy()

class Trips(db.Model):
   __tablename__ = "trips"
   trip_id = db.Column(db.Integer, primary_key=True)
   trip = db.Column(TGeomPoint)

Note: The library also allows you to use the Trajectory class from MovingPandas as well. More about this is explained later in this tutorial.

Populating data

When adding data to the table, mobilitydb-sqlalchemy expects data in the tgeompoint column to be a time indexed pandas dataframe, with two columns – one for the spatial data  called “geometry” with Shapely Point objects and one for the temporal data “t” as regular python datetime objects.

from datetime import datetime
from shapely.geometry import Point

# Prepare and insert the data
# Typically it won’t be hardcoded like this, but it might be coming from 
# other data sources like a different database or maybe csv files
df = pd.DataFrame(
   [
       {"geometry": Point(0, 0), "t": datetime(2012, 1, 1, 8, 0, 0),},
       {"geometry": Point(2, 0), "t": datetime(2012, 1, 1, 8, 10, 0),},
       {"geometry": Point(2, -1.9), "t": datetime(2012, 1, 1, 8, 15, 0),},
   ]
).set_index("t")

trip = Trips(trip_id=1, trip=df)
db.session.add(trip)
db.session.commit()

Writing queries

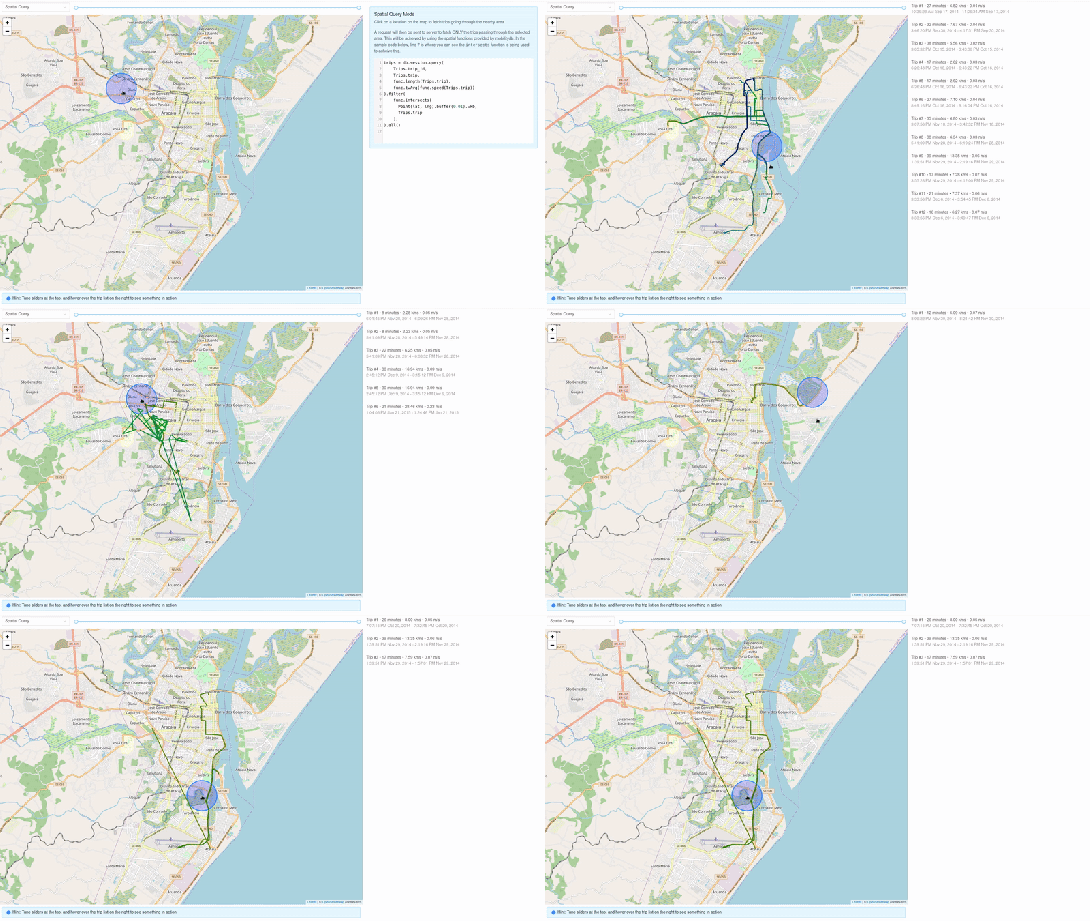
In the demo, you see two modes. Both modes were designed specifically to explain how functions defined within MobilityDB can be leveraged by our webapp.

1. All trips mode – In this mode, we extract all trip data, along with distance travelled within each trip, and the average speed in that trip, both computed by MobilityDB itself using the ‘length’, ‘speed’ and ‘twAvg’ functions. This example also shows that MobilityDB functions can be chained to form more complicated queries.

mobilitydb-sqlalchemy-demo-1

trips = db.session.query(
   Trips.trip_id,
   Trips.trip,
   func.length(Trips.trip),
   func.twAvg(func.speed(Trips.trip))
).all()

2. Spatial query mode – In this mode, we extract only selective trip data, filtered by a user-selected region of interest. We then make a query to MobilityDB to extract only the trips which pass through the specified region. We use MobilityDB’s ‘intersects’ function to achieve this filtering at the database level itself.

mobilitydb-sqlalchemy-demo-2

trips = db.session.query(
   Trips.trip_id,
   Trips.trip,
   func.length(Trips.trip),
   func.twAvg(func.speed(Trips.trip))
).filter(
   func.intersects(Point(lat, lng).buffer(0.01).wkb, Trips.trip),
).all()

Using MovingPandas Trajectory objects

Mobilitydb-sqlalchemy also provides first-class support for MovingPandas Trajectory objects, which can be installed as an optional dependency of this library. Using this Trajectory class instead of plain DataFrames allows us to make use of much richer functionality over trajectory data like analysis speed, interpolation, splitting and simplification of trajectory points, calculating bounding boxes, etc. To make use of this feature, you have set the use_movingpandas flag to True while declaring your model, as shown in the below code snippet.

class TripsWithMovingPandas(db.Model):
   __tablename__ = "trips"
   trip_id = db.Column(db.Integer, primary_key=True)
   trip = db.Column(TGeomPoint(use_movingpandas=True))

Now when you query over this table, you automatically get the data parsed into Trajectory objects without having to do anything else. This also works during insertion of data – you can directly assign your movingpandas Trajectory objects to the trip column. In the below code snippet we show how inserting and querying works with movingpandas mode.

from datetime import datetime
from shapely.geometry import Point

# Prepare and insert the data
# Typically it won’t be hardcoded like this, but it might be coming from 
# other data sources like a different database or maybe csv files
df = pd.DataFrame(
   [
       {"geometry": Point(0, 0), "t": datetime(2012, 1, 1, 8, 0, 0),},
       {"geometry": Point(2, 0), "t": datetime(2012, 1, 1, 8, 10, 0),},
       {"geometry": Point(2, -1.9), "t": datetime(2012, 1, 1, 8, 15, 0),},
   ]
).set_index("t")

geo_df = GeoDataFrame(df)
traj = mpd.Trajectory(geo_df, 1)

trip = Trips(trip_id=1, trip=traj)
db.session.add(trip)
db.session.commit()

# Querying over this table would automatically map the resulting tgeompoint 
# column to movingpandas’ Trajectory class
result = db.session.query(TripsWithMovingPandas).filter(
   TripsWithMovingPandas.trip_id == 1
).first()

print(result.trip.__class__)
# <class 'movingpandas.trajectory.Trajectory'>

Bonus: trajectory data serialization

Along with mobilitydb-sqlalchemy, recently I have also released trajectory data serialization/compression libraries based on Google’s Encoded Polyline Format Algorithm, for python and javascript called trajectory and trajectory.js respectively. These libraries let you send trajectory data in a compressed format, resulting in smaller payloads if sending your data through human-readable serialization formats like JSON. In some of the internal APIs we use at Adonmo, we have seen this reduce our response sizes by more than half (>50%) sometimes upto 90%.

Want to learn more about mobilitydb-sqlalchemy? Check out the quick start & documentation.


This post is part of a series. Read more about movement data in GIS.

Folium vs. hvplot for interactive maps of Point GeoDataFrames

In the previous post, I showed how Folium can be used to create interactive maps of GeoPandas GeoDataFrames. Today’s post continues this theme. Specifically, it compares Folium to another dataviz library called hvplot. hvplot also recently added support for GeoDataFrames, so it’s interesting to see how these different solutions compare.

Minimum viable

The following snippets show the minimum code I found to put a GeoDataFrame of Points onto a map with either Folium or hvplot.

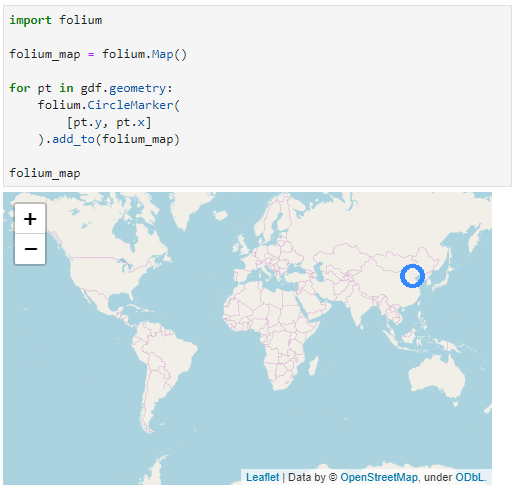
Folium does not automatically zoom to the data extent and I didn’t find a way to add the whole GeoDataFrame of Points without looping through the rows individually:

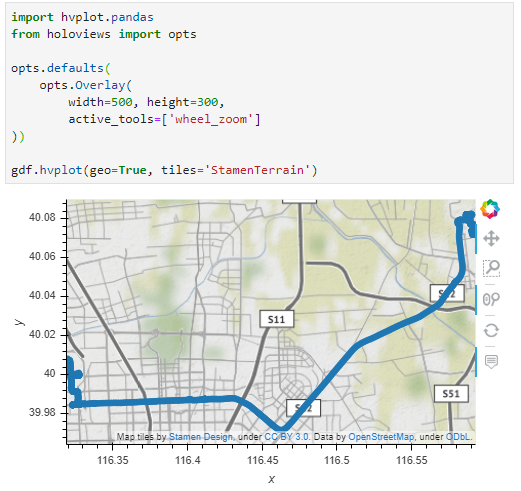
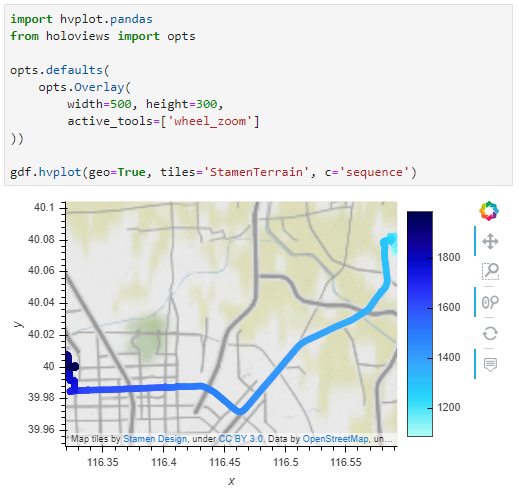
Hvplot on the other hand registers the hvplot function directly with the GeoDataFrame. This makes it as convenient to use as the original GeoPandas plot function. It also zooms to the data extent:

Standard interaction and zoom to area of interest

The following snippets ensure that the map is set to a useful extent and the map tools enable panning and zooming.

With Folium, we have to set the map center and the zoom. The map tools are Leaflet defaults, so panning and zooming work as expected:

Since hvplot does not come with mouse wheel zoom enabled by default, we need to set that:

Color by attribute

Finally, for many maps, we want to show the point location as well as an attribute value.

To create a continuous color ramp for a numeric value, we can use branca.colormap to define the marker fill color:

In hvplot, it is sufficient to specify the attribute of interest:

I’m pretty impressed with hvplot. The integration with GeoPandas is very smooth. Just don’t forget to set the geo=True parameter if you want to plot lat/lon geometries.

Folium seems less straightforward for this use case. Maybe I missed some option similar to the Choropleth function that I showed in the previous post.

Interactive plots for GeoPandas GeoDataFrames of LineStrings

GeoPandas makes it easy to create basic visualizations of GeoDataFrames:

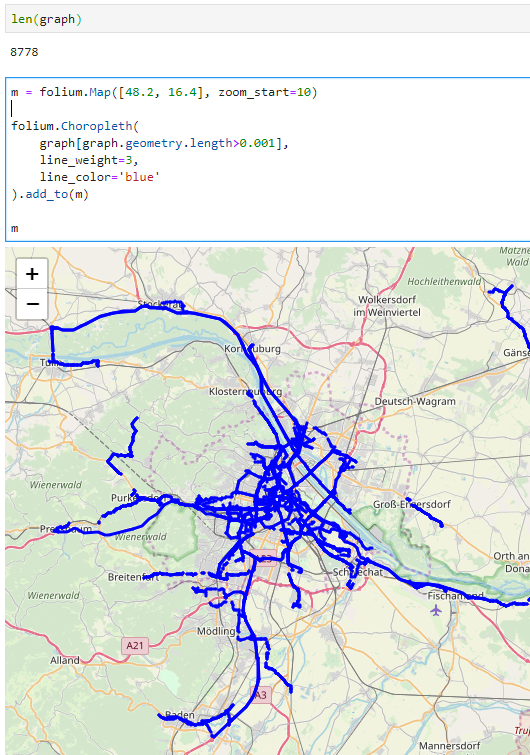
However, if we want interactive plots, we need additional libraries. Folium (which is built on Leaflet) is a great option. However, all examples for plotting GeoDataFrames that I found focused on point or polygon data. So here is what I found to work for GeoDataFrames of LineStrings:

First, some imports:

import pandas as pd
import geopandas
import folium

Loading the data:

graph = geopandas.read_file('data/population_test-routes-geom.csv')
graph.crs = {'init' :'epsg:4326'}

Creating the map using folium.Choropleth:

m = folium.Map([48.2, 16.4], zoom_start=10)

folium.Choropleth(
    graph[graph.geometry.length>0.001],
    line_weight=3,
    line_color='blue'
).add_to(m)

m

I also tried using folium.PolyLine which seemed like the more obvious choice but does not seem to accept GeoDataFrames as input. Instead, it expects a list of coordinate pairs and of course it expects them to be in the opposite order that Shapely.LineString.coords provides … Oh the joys of geodata!

In any case, I had to limit the number of features that get plotted because Folium refuses to plot all 8778 features at once. I decided to filter by line length because drawing really short lines is pointless for my overview visualization anyway.

Stand-alone PyQGIS scripts with OSGeo4W

PyQGIS scripts are great to automate spatial processing workflows. It’s easy to run these scripts inside QGIS but it can be even more convenient to run PyQGIS scripts without even having to launch QGIS. To create a so-called “stand-alone” PyQGIS script, there are a few things that need to be taken care of. The following steps show how to set up PyCharm for stand-alone PyQGIS development on Windows10 with OSGeo4W.

An essential first step is to ensure that all environment variables are set correctly. The most reliable approach is to go to C:\OSGeo4W64\bin (or wherever OSGeo4W is installed on your machine), make a copy of qgis-dev-g7.bat (or any other QGIS version that you have installed) and rename it to pycharm.bat:

Instead of launching QGIS, we want that pycharm.bat launches PyCharm. Therefore, we edit the final line in the .bat file to start pycharm64.exe:

In PyCharm itself, the main task to finish our setup is configuring the project interpreter:

First, we add a new “system interpreter” for Python 3.7 using the corresponding OSGeo4W Python installation.

To finish the interpreter config, we need to add two additional paths pointing to QGIS\python and QGIS\python\plugins:

That’s it! Now we can start developing our stand-alone PyQGIS script.

The following example shows the necessary steps, particularly:

  1. Initializing QGIS
  2. Initializing Processing
  3. Running a Processing algorithm
import sys

from qgis.core import QgsApplication, QgsProcessingFeedback
from qgis.analysis import QgsNativeAlgorithms

QgsApplication.setPrefixPath(r'C:\OSGeo4W64\apps\qgis-dev', True)
qgs = QgsApplication([], False)
qgs.initQgis()

# Add the path to processing so we can import it next
sys.path.append(r'C:\OSGeo4W64\apps\qgis-dev\python\plugins')
# Imports usually should be at the top of a script but this unconventional 
# order is necessary here because QGIS has to be initialized first
import processing
from processing.core.Processing import Processing

Processing.initialize()
QgsApplication.processingRegistry().addProvider(QgsNativeAlgorithms())
feedback = QgsProcessingFeedback()

rivers = r'D:\Documents\Geodata\NaturalEarthData\Natural_Earth_quick_start\10m_physical\ne_10m_rivers_lake_centerlines.shp'
output = r'D:\Documents\Geodata\temp\danube3.shp'
expression = "name LIKE '%Danube%'"

danube = processing.run(
    'native:extractbyexpression',
    {'INPUT': rivers, 'EXPRESSION': expression, 'OUTPUT': output},
    feedback=feedback
    )['OUTPUT']

print(danube)

Dealing with delayed measurements in (Geo)Pandas

Yesterday, I learned about a cool use case in data-driven agriculture that requires dealing with delayed measurements. As Bert mentions, for example, potatoes end up in the machines and are counted a few seconds after they’re actually taken out of the ground:

Therefore, in order to accurately map yield, we need to take this temporal offset into account.

We need to make sure that time and location stay untouched, but need to shift the potato count value. To support this use case, I’ve implemented apply_offset_seconds() for trajectories in movingpandas:

    def apply_offset_seconds(self, column, offset):
        self.df[column] = self.df[column].shift(offset, freq='1s')

The following test illustrates its use: you can see how the value column is shifted by 120 second. Geometry and time remain unchanged but the value column is shifted accordingly. In this test, we look at the row with index 2 which we access using iloc[2]:

    def test_offset_seconds(self):
        df = pd.DataFrame([
            {'geometry': Point(0, 0), 't': datetime(2018, 1, 1, 12, 0, 0), 'value': 1},
            {'geometry': Point(-6, 10), 't': datetime(2018, 1, 1, 12, 1, 0), 'value': 2},
            {'geometry': Point(6, 6), 't': datetime(2018, 1, 1, 12, 2, 0), 'value': 3},
            {'geometry': Point(6, 12), 't': datetime(2018, 1, 1, 12, 3, 0), 'value':4},
            {'geometry': Point(6, 18), 't': datetime(2018, 1, 1, 12, 4, 0), 'value':5}
        ]).set_index('t')
        geo_df = GeoDataFrame(df, crs={'init': '31256'})
        traj = Trajectory(1, geo_df)
        traj.apply_offset_seconds('value', -120)
        self.assertEqual(traj.df.iloc[2].value, 5)
        self.assertEqual(traj.df.iloc[2].geometry, Point(6, 6))

From CSV to GeoDataFrame in two lines

Pandas is great for data munging and with the help of GeoPandas, these capabilities expand into the spatial realm.

With just two lines, it’s quick and easy to transform a plain headerless CSV file into a GeoDataFrame. (If your CSV is nice and already contains a header, you can skip the header=None and names=FILE_HEADER parameters.)

usecols=USE_COLS is also optional and allows us to specify that we only want to use a subset of the columns available in the CSV.

After the obligatory imports and setting of variables, all we need to do is read the CSV into a regular DataFrame and then construct a GeoDataFrame.

import pandas as pd
from geopandas import GeoDataFrame
from shapely.geometry import Point

FILE_NAME = "/temp/your.csv"
FILE_HEADER = ['a', 'b', 'c', 'd', 'e', 'x', 'y']
USE_COLS = ['a', 'x', 'y']

df = pd.read_csv(
    FILE_NAME, delimiter=";", header=None,
    names=FILE_HEADER, usecols=USE_COLS)
gdf = GeoDataFrame(
    df.drop(['x', 'y'], axis=1),
    crs={'init': 'epsg:4326'},
    geometry=[Point(xy) for xy in zip(df.x, df.y)])

It’s also possible to create the point objects using a lambda function as shown by weiji14 on GIS.SE.

PyQGIS101 part 10 published!

PyQGIS 101: Introduction to QGIS Python programming for non-programmers has now reached the part 10 milestone!

Beyond the obligatory Hello world! example, the contents so far include:

If you’ve been thinking about learning Python programming, but never got around to actually start doing it, give PyQGIS101 a try.

I’d like to thank everyone who has already provided feedback to the exercises. Every comment is important to help me understand the pain points of learning Python for QGIS.

I recently read an article – unfortunately I forgot to bookmark it and cannot locate it anymore – that described the problems with learning to program very well: in the beginning, it’s rather slow going, you don’t know the right terminology and therefore don’t know what to google for when you run into issues. But there comes this point, when you finally get it, when the terminology becomes clearer, when you start thinking “that might work” and it actually does! I hope that PyQGIS101 will be a help along the way.

Geocoding with Geopy

Need to geocode some addresses? Here’s a five-lines-of-code solution based on “An A-Z of useful Python tricks” by Peter Gleeson:

from geopy import GoogleV3
place = "Krems an der Donau"
location = GoogleV3().geocode(place)
print(location.address)
print("POINT({},{})".format(location.latitude,location.longitude))

For more info, check out geopy:

geopy is a Python 2 and 3 client for several popular geocoding web services.
geopy includes geocoder classes for the OpenStreetMap Nominatim, ESRI ArcGIS, Google Geocoding API (V3), Baidu Maps, Bing Maps API, Yandex, IGN France, GeoNames, Pelias, geocode.earth, OpenMapQuest, PickPoint, What3Words, OpenCage, SmartyStreets, GeocodeFarm, and Here geocoder services.

Plotting GPS Trajectories with error ellipses using Time Manager

This is a guest post by Time Manager collaborator and Python expert, Ariadni-Karolina Alexiou.

Today we’re going to look at how to visualize the error bounds of a GPS trace in time. The goal is to do an in-depth visual exploration using QGIS and Time Manager in order to learn more about the data we have.

The Data

We have a file that contains GPS locations of an object in time, which has been created by a GPS tracker. The tracker also keeps track of the error covariance matrix for each point in time, that is, what confidence it has in the measurements it gives. Here is what the file looks like:

data.png

Error Covariance Matrix

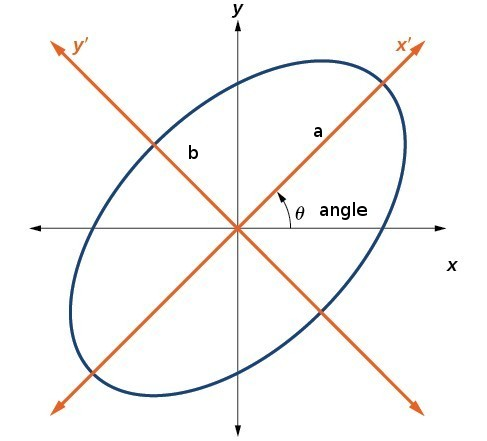
What are those sd* fields? According to the manual: The estimated standard deviations of the solution assuming a priori error model and error parameters by the positioning options. What it basically means is that the real GPS location will be located no further than three standard deviations across north and east from the measured location, most of (99.7%) the time. A way to represent this visually is to create an ellipse that maps this area of where the real location can be.ellipse_ab

An ellipse can be uniquely defined from the lengths of the segments a and b and its rotation angle. For more details on how to get those ellipse parameters from the covariance matrix, please see the footnote.

Ground truth data

We also happen to have a file with the actual locations (also in longitudes and latitudes) of the object for the same time frame as the GPS (also in seconds), provided through another tracking method which is more accurate in this case.

actual_data

This is because, the object was me running on a rooftop in Zürich wearing several tracking devices (not just GPS), and I knew exactly which floor tiles I was hitting.

The goal is to explore, visually, the relationship between the GPS data and the actual locations in time. I hope to get an idea of the accuracy, and what can influence it.

First look

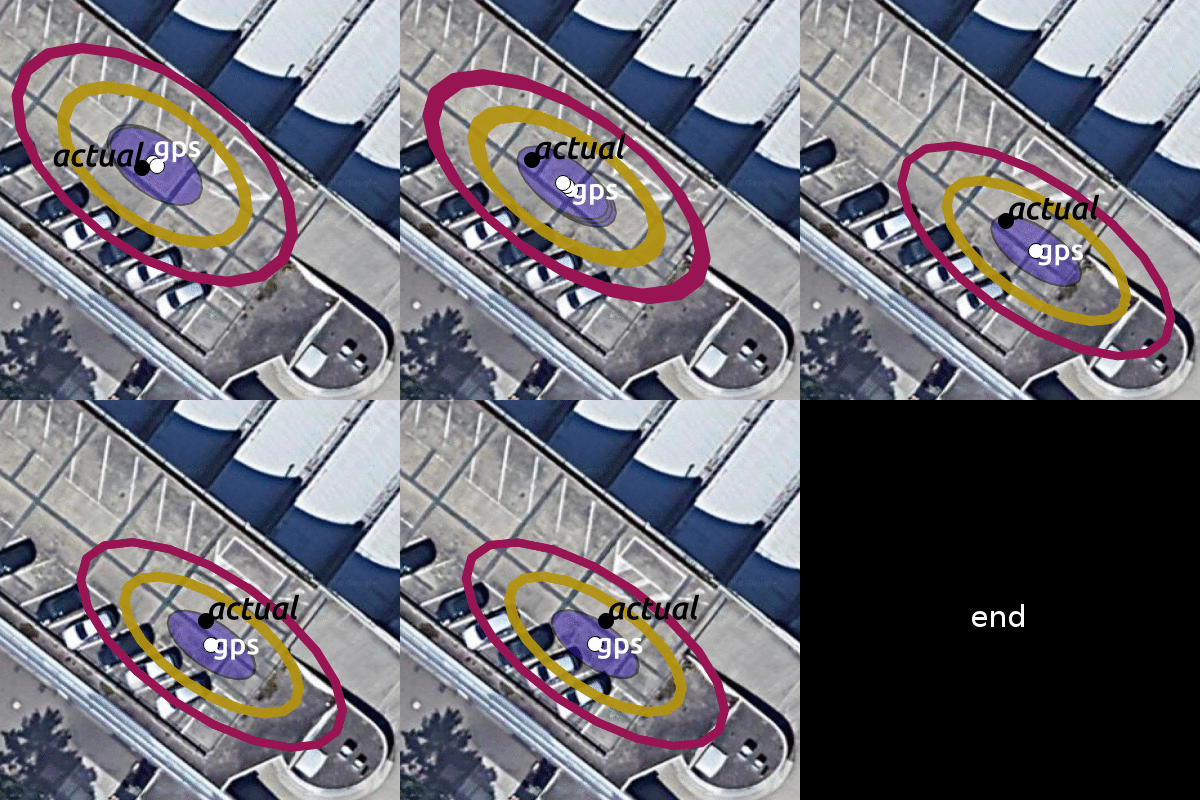
Loading the GPS data into QGIS and Time Manager, we can indeed see the GPS locations vis-a-vis the actual locations in time.

actual_vs_gps

Let’s see if the actual locations that were measured independently fall inside the ellipse coverage area. To do this, we need to use the covariance data to render ellipses.

Creating the ellipses

I considered using the ellipses marker from QGIS.

ellipse_marker.png

It is possible to switch from Millimeter to Map Unit and edit a data defined override for symbol width, height and rotation. Symbol width would be the a parameter of the ellipse, symbol height the b parameter and rotation simply the angle. The thing is, we haven’t computed any of these values yet, we just have the error covariance values in our dataset.

Because of the re-projections and matrix calculations inherent into extracting the a, b and angle of the error ellipse at each point in time, I decided to do this calculation offline using Python and relevant libraries, and then simply add a WKT text field with a polygon representation of the ellipse to the file I had. That way, the augmented data could be re-used outside QGIS, for example, to visualize using Leaflet or similar. I could have done a hybrid solution, where I calculated a, b and the angle offline, and then used the dynamic rendering capabilities of QGIS, as well.

I also decided to dump the csv into an sqlite database with an index on the time column, to make time range queries (which Time Manager does) run faster.

Putting it all together

The code for transforming the initial GPS data csv file into an sqlite database can be found in my github along with a small sample of the file containing the GPS data.

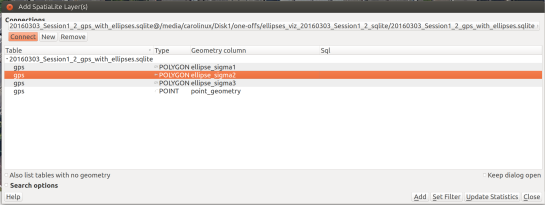
I created three ellipses per timestamp, to represent the three standard deviations. Opening QGIS (I used version: 2.12, Las Palmas) and going to Layer>Add Layer>Add SpatialLite Layer, we see the following dialog:

add_spatialite2.png

After adding the layer (say, for the second standard deviation ellipse), we can add it to Time Manager like so:

add_to_tm

We do the process three times to add the three types of ellipses, taking care to style each ellipse differently. I used transparent fill for the second and third standard deviation ellipses.

I also added the data of my  actual positions.

Here is an exported video of the trace (at a place in time where I go forward, backwards and forward again and then stay still).

gps

Conclusions

Looking at the relationship between the actual data and the GPS data, we can see the following:

  • Although the actual position differs from the measured one, the actual position always lies within one or two standard deviations of the measured position (so, inside the purple and golden ellipses).
  • The direction of movement has greater uncertainty (the ellipse is elongated across the line I am running on).
  • When I am standing still, the GPS position is still moving, and unfortunately does not converge to my actual stationary position, but drifts. More research is needed regarding what happens with the GPS data when the tracker is actually still.
  • The GPS position doesn’t jump erratically, which can be good, however, it seems to have trouble ‘catching up’ with the actual position. This means if we’re looking to measure velocity in particular, the GPS tracker might underestimate that.

These findings are empirical, since they are extracted from a single visualization, but we have already learned some new things. We have some new ideas for what questions to ask on a large scale in the data, what additional experiments to run in the future and what limitations we may need to be aware of.

Thanks for reading!

Footnote: Error Covariance Matrix calculations

The error covariance matrix is (according to the definitions of the sd* columns in the manual):

sde * sde sign(sdne) * sdne * sdne
sign(sdne) * sdne * sdne sdn * sdn

It is not a diagonal matrix, which means that the errors across the ‘north’ dimension and the ‘east’ dimension, are not exactly independent.

An important detail is that, while the position is given in longitudes and latitudes, the sdn, sde and sdne fields are in meters. To address this in the code, we convert the longitude and latitudes using UTM projection, so that they are also in meters (northings and eastings).

For more details on the mathematics used to plot the ellipses check out this article by Robert Eisele and the implementation of the ellipse calculations on my github.

Movement data in GIS #12: why you should be using PostGIS trajectories

In short: both writing trajectory queries as well as executing them is considerably faster using PostGIS trajectories (as LinestringM) rather than the commonly used point-based approach.

Here are a couple of examples to give you an impression of the differences.

Spoiler alert! Trajectory queries are up to 500 times faster than comparable point-based queries.

A quick look at indexing

In both cases, we have indexed the tracker id, geometry, and time columns to speed up query processing.

The trajectory table has 3 indexes

  • gist (time_range)
  • gist (track gist_geometry_ops_nd)
  • btree (tracker)

The point-based table has 4 indexes

  • gist (pt)
  • btree (trajectory_id)
  • btree (tracker)
  • btree (t)

Length

First, let’s see how to determine trajectory length for all observed moving objects (identified by a tracker id).

Using the point-based approach, we first need to ensure that the points are in the correct temporal order, create the lines, and finally sum up their length:

WITH ordered AS (
 SELECT trajectory_id, tracker, t, pt
 FROM geolife.trajectory_pt
 ORDER BY t
), tmp AS (
 SELECT trajectory_id, tracker, st_makeline(pt) traj
 FROM ordered 
 GROUP BY trajectory_id, tracker
)
SELECT tracker, round(sum(ST_Length(traj::geography)))
FROM tmp
GROUP BY tracker 
ORDER BY tracker

With trajectories, we can go right to computing lengths:

SELECT tracker, round(sum(ST_Length(track::geography)))
FROM geolife.trajectory_ext
GROUP BY tracker
ORDER BY tracker

On my test system, the trajectory query run time is 22.7 sec instead of 43.0 sec for the point-based approach:

Duration

Compared to trajectory length, duration is less complicated in the point-based approach:

WITH tmp AS (
 SELECT trajectory_id, tracker, min(t) start_time, max(t) end_time
 FROM geolife.trajectory_pt
 GROUP BY trajectory_id, tracker
)
SELECT tracker, sum(end_time - start_time)
FROM tmp
GROUP BY tracker
ORDER BY tracker

Still, the trajectory query is less complex and much faster at 31 ms instead of 6.0 sec:

SELECT tracker, sum(upper(time_range) - lower(time_range))
FROM geolife.trajectory_ext
GROUP BY tracker
ORDER BY tracker

Temporal filter

Extracting trajectories that occurred during a certain time frame is another common use case:

WITH tmp AS (
 SELECT trajectory_id, tracker, min(t) start_time, max(t) end_time
 FROM geolife.trajectory_pt
 GROUP BY trajectory_id, tracker
)
SELECT trajectory_id, tracker, start_time, end_time
FROM tmp
WHERE end_time > '2008-11-26 11:00'
AND start_time < '2008-11-26 15:00'
ORDER BY tracker

This point-based query takes 6.0 sec while the shorter trajectory query finishes in 12 ms:

SELECT id, tracker, time_range
FROM geolife.trajectory_ext
WHERE time_range && '[2008-11-26 11:00+1,2008-11-26 15:00+01]'::tstzrange

or equally fast (12 ms) by making use of the n-dimensional index:

WHERE track &&&	ST_Collect(
 ST_MakePointM(-180, -90, extract(epoch from '2008-11-26 11:00'::timestamptz)),
 ST_MakePointM(180, 90, extract(epoch from '2008-11-26 15:00'::timestamptz))
)

Spatial filter

Finally, of course, let’s have a look at spatial filters, for example, trajectories that start in a certain area:

WITH my AS ( 
 SELECT ST_Buffer(ST_SetSRID(ST_MakePoint(116.31894,39.97472),4326),0.0005) areaA
), tmp AS (
 SELECT trajectory_id, tracker, min(t) t 
 FROM geolife.trajectory_pt
 GROUP BY trajectory_id, tracker
)
SELECT distinct traj.tracker, traj.trajectory_id 
FROM tmp
JOIN geolife.trajectory_pt traj
ON tmp.trajectory_id = traj.trajectory_id AND traj.t = tmp.t
JOIN my
ON ST_Within(traj.pt, my.areaA)

This point-based query takes 6.0 sec while the shorter trajectory query finishes in 488 ms:

WITH my AS ( 
 SELECT ST_Buffer(ST_SetSRID(ST_MakePoint(116.31894, 39.97472),4326),0.0005) areaA
)
SELECT id, tracker, ST_AsText(track)
FROM geolife.trajectory_ext
JOIN my
ON areaA && track
AND ST_Within(ST_StartPoint(track), areaA)

For more generic “does this trajectory intersect another geometry”, the points can also be aggregated to a linestring on the fly but that takes 21.9 sec:

I’ll be presenting more work on PostGIS trajectories at GI_Forum in Salzburg in July. In the talk, I’ll also have a look at the custom PG-Trajectory datatype. Here’s the full open-access paper:

Graser, A. (2018) Evaluating Spatio-temporal Data Models for Trajectories in PostGIS Databases. GI_Forum ‒ Journal of Geographic Information Science, 1-2018, 16-33. DOI: 10.1553/giscience2018_01_s16.

You can find my fork of the PG-Trajectory project – including all necessary fixes – on Bitbucket.


This post is part of a series. Read more about movement data in GIS.

Movement data in GIS #11: FOSS4G2017 talk recordings

Many of the topics I’ve covered in recent “Movement data in GIS” posts, have also been discussed at this year’s FOSS4G. Here’s a list of videos for you to learn more about the OGC Moving Features standard, modelling AIS data with FOSS, and more:

1. Introduction to the OGC Moving Features standard presented by Kyoung-Sook Kim from the Artificial Intelligence Research Center, Japan:

Another Perspective View of Cesium for OGC Moving Features from FOSS4G Boston 2017 on Vimeo.

2. Modeling AIS data using GDAL & PostGIS presented by Morten Aronsen from the Norwegian Defence Research Establishment:

Density mapping of ship traffic using FOSS4G in C# .NET from FOSS4G Boston 2017 on Vimeo.

3. 3D visualization of movement data from videos presented by Anna Petrasova from the Center for Geospatial Analysis, North Carolina State University:

Visualization and analysis of active transportation patterns derived from public webcams from FOSS4G Boston 2017 on Vimeo.

There are also a ton of Docker presentations on the FOSS4G2017 Vimeo channel, if you liked “Docker basics with Geodocker GeoServer”.


Read more:

Movement data in GIS #9: trajectory data models

There are multiple ways to model trajectory data. This post takes a closer look at the OGC® Moving Features Encoding Extension: Simple Comma Separated Values (CSV). This standard has been published in 2015 but I haven’t been able to find any reviews of the standard (in a GIS context or anywhere else).

The following analysis is based on the official OGC trajcectory example at http://docs.opengeospatial.org/is/14-084r2/14-084r2.html#42. The header consists of two lines: the first line provides some meta information while the second defines the CSV columns. The data model is segment based. That is, each line describes a trajectory segment with at least two coordinate pairs (or triplets for 3D trajectories). For each segment, there is a start and an end time which can be specified as absolute or relative (offset) values:

@stboundedby,urn:x-ogc:def:crs:EPSG:6.6:4326,2D,50.23 9.23,50.31 9.27,2012-01-17T12:33:41Z,2012-01-17T12:37:00Z,sec
@columns,mfidref,trajectory,state,xsd:token,”type code”,xsd:integer
a, 10,150,11.0 2.0 12.0 3.0,walking,1
b, 10,190,10.0 2.0 11.0 3.0,walking,2
a,150,190,12.0 3.0 10.0 3.0,walking,2
c, 10,190,12.0 1.0 10.0 2.0 11.0 3.0,vehicle,1

Let’s look at the first data row in detail:

  • a … trajectory id
  • 10 … start time offset from 2012-01-17T12:33:41Z in seconds
  • 150 … end time offset from 2012-01-17T12:33:41Z in seconds
  • 11.0 2.0 12.0 3.0 … trajectory coordinates: x1, y1, x2, y2
  • walking …  state
  • 1… type code

My main issues with this approach are

  1. They missed the chance to use WKT notation to make the CSV easily readable by existing GIS tools.
  2. As far as I can see, the data model requires a regular sampling interval because there is no way to store time stamps for intermediate positions along trajectory segments. (Irregular intervals can be stored using segments for each pair of consecutive locations.)

In the common GIS simple feature data model (which is point-based), the same data would look something like this:

traj_id,x,y,t,state,type_code
a,11.0,2.0,2012-01-17T12:33:51Z,walking,1
a,12.0,3.0,2012-01-17T12:36:11Z,walking,1
a,10.0,3.0,2012-01-17T12:36:51Z,walking,2
b,10.0,2.0,2012-01-17T12:33:51Z,walking,2
b,11.0,3.0,2012-01-17T12:36:51Z,walking,2
c,12.0,1.0,2012-01-17T12:33:51Z,vehicle,1
c,10.0,2.0,2012-01-17T12:35:21Z,vehicle,1
c,11.0,3.0,2012-01-17T12:36:51Z,vehicle,1

The main issue here is that there has to be some application logic that knows how to translate from points to trajectory. For example, trajectory a changes from walking1 to walking2 at 2012-01-17T12:36:11Z but we have to decide whether to store the previous or the following state code for this individual point.

An alternative to the common simple feature model is the PostGIS trajectory data model (which is LineStringM-based). For this data model, we need to convert time stamps to numeric values, e.g. 2012-01-17T12:33:41Z is 1326803621 in Unix time. In this data model, the data looks like this:

traj_id,trajectory,state,type_code
a,LINESTRINGM(11.0 2.0 1326803631, 12.0 3.0 1326803771),walking,1
a,LINESTRINGM(12.0 3.0 1326803771, 10.0 3.0 1326803811),walking,2
b,LINESTRINGM(10.0 2.0 1326803631, 11.0 3.0 1326803811),walking,2
c,LINESTRINGM(12.0 1.0 1326803631, 10.0 2.0 1326803771, 11.0 3.0 1326803811),vehicle,1

This is very similar to the OGC data model, with the notable difference that every position is time-stamped (instead of just having segment start and end times). If one has movement data which is recorded at regular intervals, the OGC data model can be a bit more compact, but if the trajectories are sampled at irregular intervals, each point pair will have to be modeled as a separate segment.

Since the PostGIS data model is flexible, explicit, and comes with existing GIS tool support, it’s my clear favorite.


Read more:

Drive-time Isochrones from a single Shapefile using QGIS, PostGIS, and Pgrouting

This is a guest post by Chris Kohler .

Introduction:

This guide provides step-by-step instructions to produce drive-time isochrones using a single vector shapefile. The method described here involves building a routing network using a single vector shapefile of your roads data within a Virtual Box. Furthermore, the network is built by creating start and end nodes (source and target nodes) on each road segment. We will use Postgresql, with PostGIS and Pgrouting extensions, as our database. Please consider this type of routing to be fair, regarding accuracy, as the routing algorithms are based off the nodes locations and not specific addresses. I am currently working on an improved workflow to have site address points serve as nodes to optimize results. One of the many benefits of this workflow is no financial cost to produce (outside collecting your roads data). I will provide instructions for creating, and using your virtual machine within this guide.

Steps:–Getting Virtual Box(begin)–

Intro 1. Download/Install Oracle VM(https://www.virtualbox.org/wiki/Downloads)

Intro 2. Start the download/install OSGeo-Live 11(https://live.osgeo.org/en/overview/overview.html).

Pictures used in this workflow will show 10.5, though version 11 can be applied similarly. Make sure you download the version: osgeo-live-11-amd64.iso. If you have trouble finding it, here is the direct link to the download (https://sourceforge.net/projects/osgeo-live/files/10.5/osgeo-live-10.5-amd64.iso/download)
Intro 3. Ready for virtual machine creation: We will utilize the downloaded OSGeo-Live 11 suite with a virtual machine we create to begin our workflow. The steps to create your virtual machine are listed below. Also, here are steps from an earlier workshop with additional details with setting up your virtual machine with osgeo live(http://workshop.pgrouting.org/2.2.10/en/chapters/installation.html).

1.  Create Virutal Machine: In this step we begin creating the virtual machine housing our database.

Open Oracle VM VirtualBox Manager and select “New” located at the top left of the window.

VBstep1

Then fill out name, operating system, memory, etc. to create your first VM.

vbstep1.2

2. Add IDE Controller:  The purpose of this step is to create a placeholder for the osgeo 11 suite to be implemented. In the virtual box main window, right-click your newly-created vm and open the settings.

vbstep2

In the settings window, on the left side select the storage tab.

Find “adds new storage controller button located at the bottom of the tab. Be careful of other buttons labeled “adds new storage attachment”! Select “adds new storage controller button and a drop-down menu will appear. From the top of the drop-down select “Add IDE Controller”.

vbstep2.2

vbstep2.3

You will see a new item appear in the center of the window under the “Storage Tree”.

3.  Add Optical Drive: The osgeo 11 suite will be implemented into the virtual machine via an optical drive. Highlight the new controller IDE you created and select “add optical drive”.

vbstep3

A new window will pop-up and select “Choose Disk”.

vbstep3.2

Locate your downloaded file “osgeo-live 11 amd64.iso” and click open. A new object should appear in the middle window under your new controller displaying “osgeo-live-11.0-amd64.iso”.

vbstep3.3

Finally your virtual machine is ready for use.
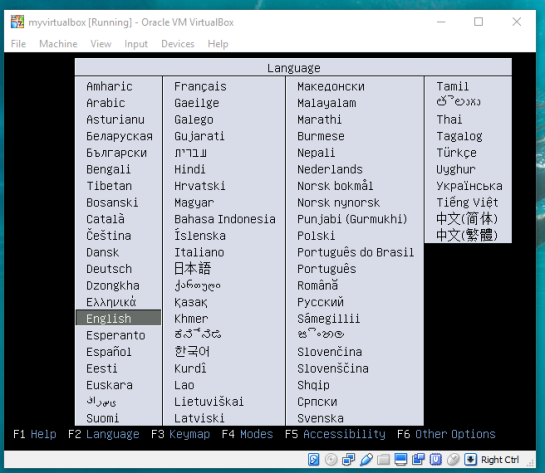
Start your new Virtual Box, then wait and follow the onscreen prompts to begin using your virtual machine.
vbstep3.4

–Getting Virtual Box(end)—

4. Creating the routing database, and both extensions (postgis, pgrouting): The database we create and both extensions we add will provide the functions capable of producing isochrones.

To begin, start by opening the command line tool (hold control+left-alt+T) then log in to postgresql by typing “psql -U user;” into the command line and then press Enter. For the purpose of clear instruction I will refer to database name in this guide as “routing”, feel free to choose your own database name. Please input the command, seen in the figure below, to create the database:

CREATE DATABASE routing;

You can use “\c routing” to connect to the database after creation.

step4

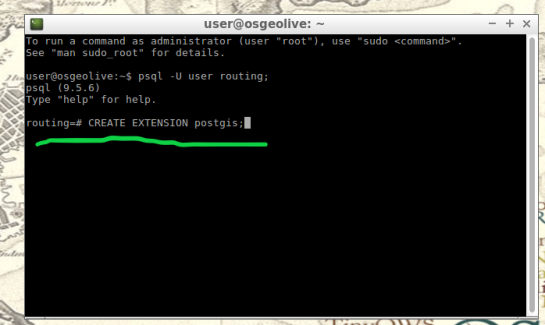
The next step after creating and connecting to your new database is to create both extensions. I find it easier to take two-birds-with-one-stone typing “psql -U user routing;” this will simultaneously log you into postgresql and your routing database.

When your logged into your database, apply the commands below to add both extensions

CREATE EXTENSION postgis;
CREATE EXTENSION pgrouting;
step4.2

step4.3

5. Load shapefile to database: In this next step, the shapefile of your roads data must be placed into your virtual machine and further into your database.

My method is using email to send myself the roads shapefile then download and copy it from within my virtual machines web browser. From the desktop of your Virtual Machine, open the folder named “Databases” and select the application “shape2pgsql”.

step5

Follow the UI of shp2pgsql to connect to your routing database you created in Step 4.

step5.2

Next, select “Add File” and find your roads shapefile (in this guide we will call our shapefile “roads_table”) you want to use for your isochrones and click Open.

step5.3

Finally, click “Import” to place your shapefile into your routing database.

6. Add source & target columns: The purpose of this step is to create columns which will serve as placeholders for our nodes data we create later.

There are multiple ways to add these columns into the roads_table. The most important part of this step is which table you choose to edit, the names of the columns you create, and the format of the columns. Take time to ensure the source & target columns are integer format. Below are the commands used in your command line for these functions.

ALTER TABLE roads_table ADD COLUMN "source" integer;
ALTER TABLE roads_table ADD COLUMN "target" integer;

step6

step6.2

7. Create topology: Next, we will use a function to attach a node to each end of every road segment in the roads_table. The function in this step will create these nodes. These newly-created nodes will be stored in the source and target columns we created earlier in step 6.

As well as creating nodes, this function will also create a new table which will contain all these nodes. The suffix “_vertices_pgr” is added to the name of your shapefile to create this new table. For example, using our guide’s shapefile name , “roads_table”, the nodes table will be named accordingly: roads_table_vertices_pgr. However, we will not use the new table created from this function (roads_table_vertices_pgr). Below is the function, and a second simplified version, to be used in the command line for populating our source and target columns, in other words creating our network topology. Note the input format, the “geom” column in my case was called “the_geom” within my shapefile:

pgr_createTopology('roads_table', 0.001, 'geom', 'id',
 'source', 'target', rows_where := 'true', clean := f)

step7

Here is a direct link for more information on this function: http://docs.pgrouting.org/2.3/en/src/topology/doc/pgr_createTopology.html#pgr-create-topology

Below is an example(simplified) function for my roads shapefile:

SELECT pgr_createTopology('roads_table', 0.001, 'the_geom', 'id')

8. Create a second nodes table: A second nodes table will be created for later use. This second node table will contain the node data generated from pgr_createtopology function and be named “node”. Below is the command function for this process. Fill in your appropriate source and target fields following the manner seen in the command below, as well as your shapefile name.

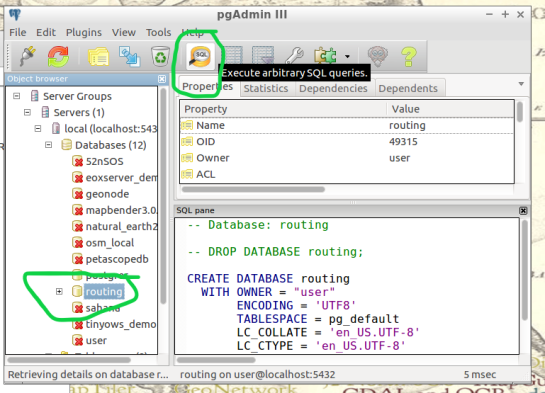
To begin, find the folder on the Virtual Machines desktop named “Databases” and open the program “pgAdmin lll” located within.

step8

Connect to your routing database in pgAdmin window. Then highlight your routing database, and find “SQL” tool at the top of the pgAdmin window. The tool resembles a small magnifying glass.
step8.2

We input the below function into the SQL window of pgAdmin. Feel free to refer to this link for further information: (https://anitagraser.com/2011/02/07/a-beginners-guide-to-pgrouting/)

CREATE TABLE node AS
   SELECT row_number() OVER (ORDER BY foo.p)::integer AS id,
          foo.p AS the_geom
   FROM (     
      SELECT DISTINCT roads_table.source AS p FROM roads_table
      UNION
      SELECT DISTINCT roads_table.target AS p FROM roads_table
   ) foo
   GROUP BY foo.p;

step8.3

  1.  Create a routable network: After creating the second node table from step 8,  we will combine this node table(node) with our shapefile(roads_table) into one, new, table(network) that will be used as the routing network. This table will be called “network” and will be capable of processing routing queries.  Please input this command and execute in SQL pgAdmin tool as we did in step 8. Here is a reference for more information:(https://anitagraser.com/2011/02/07/a-beginners-guide-to-pgrouting/)   

step8.2


CREATE TABLE network AS
   SELECT a.*, b.id as start_id, c.id as end_id
   FROM roads_table AS a
      JOIN node AS b ON a.source = b.the_geom
      JOIN node AS c ON a.target = c.the_geom;
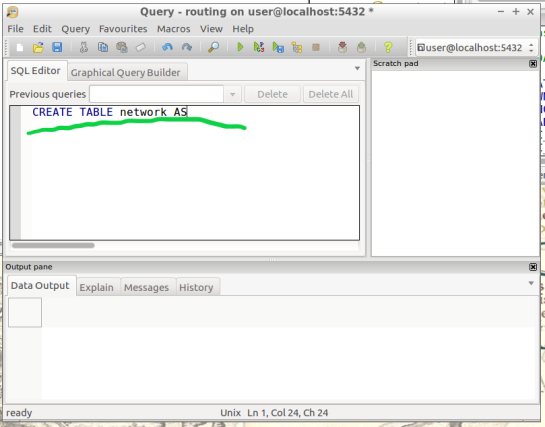
step9.2

10. Create a “noded” view of the network:  This new view will later be used to calculate the visual isochrones in later steps. Input this command and execute in SQL pgAdmin tool.

CREATE OR REPLACE VIEW network_nodes AS 
SELECT foo.id,
 st_centroid(st_collect(foo.pt)) AS geom 
FROM ( 
  SELECT network.source AS id,
         st_geometryn (st_multi(network.geom),1) AS pt 
  FROM network
  UNION 
  SELECT network.target AS id, 
         st_boundary(st_multi(network.geom)) AS pt 
  FROM network) foo 
GROUP BY foo.id;

step10

11.​ Add column for speed:​ This step may, or may not, apply if your original shapefile contained a field of values for road speeds.

In reality a network of roads will typically contain multiple speed limits. The shapefile you choose may have a speed field, otherwise the discrimination for the following steps will not allow varying speeds to be applied to your routing network respectfully.

If values of speed exists in your shapefile we will implement these values into a new field, “traveltime“, that will show rate of travel for every road segment in our network based off their geometry. Firstly, we will need to create a column to store individual traveling speeds. The name of our column will be “traveltime” using the format: ​double precision.​ Input this command and execute in the command line tool as seen below.

ALTER TABLE network ADD COLUMN traveltime double precision;
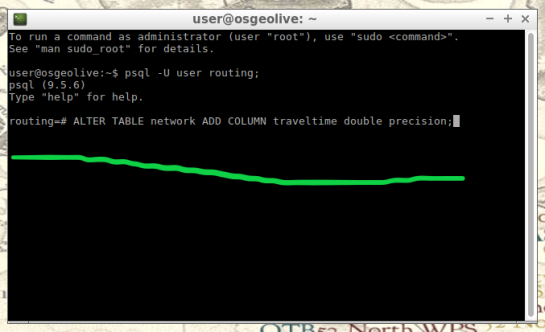
step11

Next, we will populate the new column “traveltime” by calculating traveling speeds using an equation. This equation will take each road segments geometry(shape_leng) and divide by the rate of travel(either mph or kph). The sample command I’m using below utilizes mph as the rate while our geometry(shape_leng) units for my roads_table is in feet​. If you are using either mph or kph, input this command and execute in SQL pgAdmin tool. Below further details explain the variable “X”.

UPDATE network SET traveltime = shape_leng / X*60
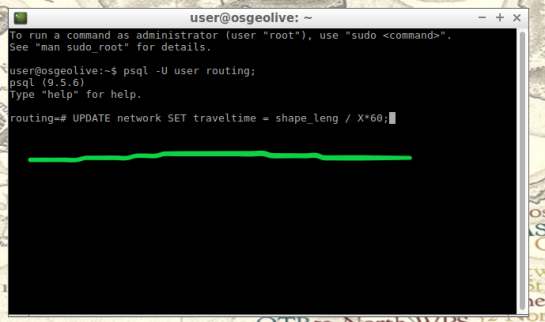
step11.2

How to find X​, ​here is an example​: Using example 30 mph as rate. To find X, we convert 30 miles to feet, we know 5280 ft = 1 mile, so we multiply 30 by 5280 and this gives us 158400 ft. Our rate has been converted from 30 miles per hour to 158400 feet per hour. For a rate of 30 mph, our equation for the field “traveltime”  equates to “shape_leng / 158400*60″. To discriminate this calculations output, we will insert additional details such as “where speed = 30;”. What this additional detail does is apply our calculated output to features with a “30” value in our “speed” field. Note: your “speed” field may be named differently.

UPDATE network SET traveltime = shape_leng / 158400*60 where speed = 30;

Repeat this step for each speed value in your shapefile examples:

UPDATE network SET traveltime = shape_leng / X*60 where speed = 45;
UPDATE network SET traveltime = shape_leng / X*60 where speed = 55;

The back end is done. Great Job!

Our next step will be visualizing our data in QGIS. Open and connect QGIS to your routing database by right-clicking “PostGIS” in the Browser Panel within QGIS main window. Confirm the checkbox “Also list tables with no geometry” is checked to allow you to see the interior of your database more clearly. Fill out the name or your routing database and click “OK”.

If done correctly, from QGIS you will have access to tables and views created in your routing database. Feel free to visualize your network by drag-and-drop the network table into your QGIS Layers Panel. From here you can use the identify tool to select each road segment, and see the source and target nodes contained within that road segment. The node you choose will be used in the next step to create the views of drive-time.

12.Create views​: In this step, we create views from a function designed to determine the travel time cost. Transforming these views with tools will visualize the travel time costs as isochrones.

The command below will be how you start querying your database to create drive-time isochrones. Begin in QGIS by draging your network table into the contents. The visual will show your network as vector(lines). Simply select the road segment closest to your point of interest you would like to build your isochrone around. Then identify the road segment using the identify tool and locate the source and target fields.

step12

step12.2

Place the source or target field value in the below command where you see ​VALUE​, in all caps​.

This will serve you now as an isochrone catchment function for this workflow. Please feel free to use this command repeatedly for creating new isochrones by substituting the source value. Please input this command and execute in SQL pgAdmin tool.

*AT THE BOTTOM OF THIS WORKFLOW I PROVIDED AN EXAMPLE USING SOURCE VALUE “2022”

CREATE OR REPLACE VIEW "​view_name" AS 
SELECT di.seq, 
       di.id1, 
       di.id2, 
       di.cost, 
       pt.id, 
       pt.geom 
FROM pgr_drivingdistance('SELECT
     gid::integer AS id, 
     Source::integer AS source, 
     Target::integer AS target,                                    
     Traveltime::double precision AS cost 
       FROM network'::text, ​VALUE::bigint, 
    100000::double precision, false, false)
    di(seq, id1, id2, cost)
JOIN network_nodes pt ON di.id1 = pt.id;
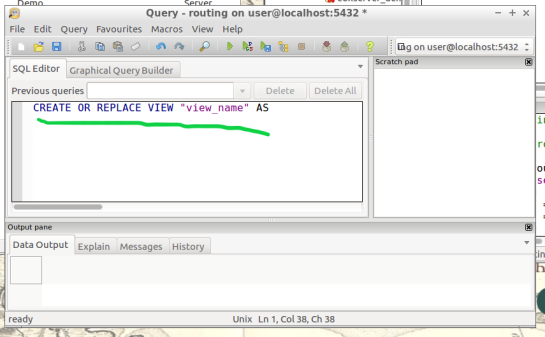
step12.3

13.Visualize Isochrone: Applying tools to the view will allow us to adjust the visual aspect to a more suitable isochrone overlay.

​After creating your view, a new item in your routing database is created, using the “view_name” you chose. Drag-and-drop this item into your QGIS LayersPanel. You will see lots of small dots which represent the nodes.

In the figure below, I named my view “take1“.

step13

Each node you see contains a drive-time value, “cost”, which represents the time used to travel from the node you input in step 12’s function.
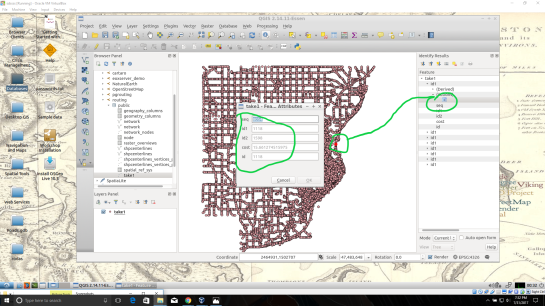
step13.2

Start by installing the QGIS plug-in Interpolation” by opening the Plugin Manager in QGIS interface.
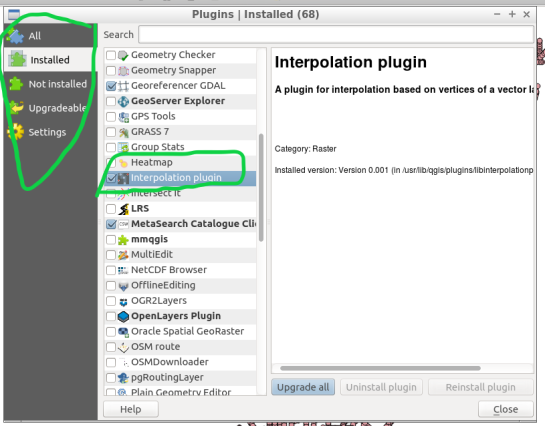
step13.3

Next, at the top of QGIS window select “Raster” and a drop-down will appear, select “Interpolation”.
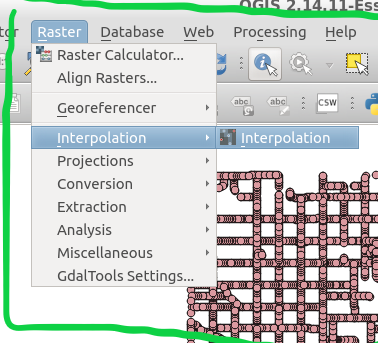
step13.4


A new window pops up and asks you for input.

step13.5

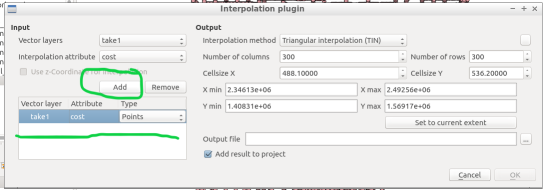
Select your “​view”​ as the​ vector layer​, select ​”cost​” as your ​interpolation attribute​, and then click “Add”.

step13.6

A new vector layer will show up in the bottom of the window, take care the type is Points. For output, on the other half of the window, keep the interpolation method as “TIN”, edit the ​output file​ location and name. Check the box “​Add result to project​”.

Note: decreasing the cellsize of X and Y will increase the resolution but at the cost of performance.

Click “OK” on the bottom right of the window.

step13.7

A black and white raster will appear in QGIS, also in the Layers Panel a new item was created.
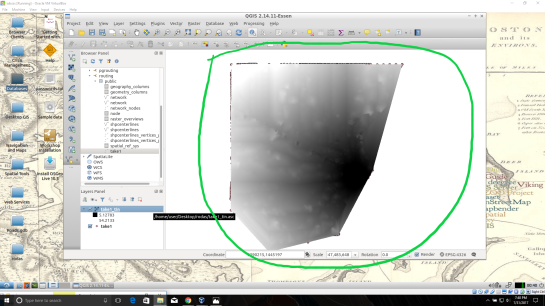
step13.8

Take some time to visualize the raster by coloring and adjusting values in symbology until you are comfortable with the look.

step13.9

step13.10

14. ​Create contours of our isochrone:​ Contours can be calculated from the isochrone as well.

Find near the top of QGIS window, open the “Raster” menu drop-down and select Extraction → Contour.

step14

Fill out the appropriate interval between contour lines but leave the check box “Attribute name” unchecked. Click “OK”.

step14.2

step14.3

15.​ Zip and Share:​ Find where you saved your TIN and contours, compress them in a zip folder by highlighting them both and right-click to select “compress”. Email the compressed folder to yourself to export out of your virtual machine.

Example Isochrone catchment for this workflow:

CREATE OR REPLACE VIEW "2022" AS 
SELECT di.seq, Di.id1, Di.id2, Di.cost,                           
       Pt.id, Pt.geom 
FROM pgr_drivingdistance('SELECT gid::integer AS id,                                       
     Source::integer AS source, Target::integer AS target, 
     Traveltime::double precision AS cost FROM network'::text, 
     2022::bigint, 100000::double precision, false, false) 
   di(seq, id1, id2, cost) 
JOIN netowrk_nodes pt 
ON di.id1 = pt.id;

References: Virtual Box ORACLE VM, OSGeo-Live 11  amd64 iso, Workshop FOSS4G Bonn(​http://workshop.pgrouting.org/2.2.10/en/index.html​),

Getting started with GeoMesa using Geodocker

In a previous post, I showed how to use docker to run a single application (GeoServer) in a container and connect to it from your local QGIS install. Today’s post is about running a whole bunch of containers that interact with each other. More specifically, I’m using the images provided by Geodocker. The Geodocker repository provides a setup containing Accumulo, GeoMesa, and GeoServer. If you are not familiar with GeoMesa yet:

GeoMesa is an open-source, distributed, spatio-temporal database built on a number of distributed cloud data storage systems … GeoMesa aims to provide as much of the spatial querying and data manipulation to Accumulo as PostGIS does to Postgres.

The following sections show how to load data into GeoMesa, perform basic queries via command line, and finally publish data to GeoServer. The content is based largely on two GeoMesa tutorials: Geodocker: Bootstrapping GeoMesa Accumulo and Spark on AWS and Map-Reduce Ingest of GDELT, as well as Diethard Steiner’s post on Accumulo basics. The key difference is that this tutorial is written to be run locally (rather than on AWS or similar infrastructure) and that it spells out all user names and passwords preconfigured in Geodocker.

This guide was tested on Ubuntu and assumes that Docker is already installed. If you haven’t yet, you can install Docker as described in Install using the repository.

To get Geodocker set up, we need to get the code from Github and run the docker-compose command:

$ git clone https://github.com/geodocker/geodocker-geomesa.git
$ cd geodocker-geomesa/geodocker-accumulo-geomesa/
$ docker-compose up

This will take a while.

When docker-compose is finished, use a second console to check the status of all containers:

$ docker ps
CONTAINER ID        IMAGE                                     COMMAND                  CREATED             STATUS              PORTS                                        NAMES
4a238494e15f        quay.io/geomesa/accumulo-geomesa:latest   "/sbin/entrypoint...."   19 hours ago        Up 23 seconds                                                    geodockeraccumulogeomesa_accumulo-tserver_1
e2e0df3cae98        quay.io/geomesa/accumulo-geomesa:latest   "/sbin/entrypoint...."   19 hours ago        Up 22 seconds       0.0.0.0:50095-&gt;50095/tcp                     geodockeraccumulogeomesa_accumulo-monitor_1
e7056f552ef0        quay.io/geomesa/accumulo-geomesa:latest   "/sbin/entrypoint...."   19 hours ago        Up 24 seconds                                                    geodockeraccumulogeomesa_accumulo-master_1
dbc0ffa6c39c        quay.io/geomesa/hdfs:latest               "/sbin/entrypoint...."   19 hours ago        Up 23 seconds                                                    geodockeraccumulogeomesa_hdfs-data_1
20e90a847c5b        quay.io/geomesa/zookeeper:latest          "/sbin/entrypoint...."   19 hours ago        Up 24 seconds       2888/tcp, 0.0.0.0:2181-&gt;2181/tcp, 3888/tcp   geodockeraccumulogeomesa_zookeeper_1
997b0e5d6699        quay.io/geomesa/geoserver:latest          "/opt/tomcat/bin/c..."   19 hours ago        Up 22 seconds       0.0.0.0:9090-&gt;9090/tcp                       geodockeraccumulogeomesa_geoserver_1
c17e149cda50        quay.io/geomesa/hdfs:latest               "/sbin/entrypoint...."   19 hours ago        Up 23 seconds       0.0.0.0:50070-&gt;50070/tcp                     geodockeraccumulogeomesa_hdfs-name_1

At the time of writing this post, the Geomesa version installed in this way is 1.3.2:

$ docker exec geodockeraccumulogeomesa_accumulo-master_1 geomesa version
GeoMesa tools version: 1.3.2
Commit ID: 2b66489e3d1dbe9464a9860925cca745198c637c
Branch: 2b66489e3d1dbe9464a9860925cca745198c637c
Build date: 2017-07-21T19:56:41+0000

Loading data

First we need to get some data. The available tutorials often refer to data published by the GDELT project. Let’s download data for three days, unzip it and copy it to the geodockeraccumulogeomesa_accumulo-master_1 container for further processing:

$ wget http://data.gdeltproject.org/events/20170710.export.CSV.zip
$ wget http://data.gdeltproject.org/events/20170711.export.CSV.zip
$ wget http://data.gdeltproject.org/events/20170712.export.CSV.zip
$ unzip 20170710.export.CSV.zip
$ unzip 20170711.export.CSV.zip
$ unzip 20170712.export.CSV.zip
$ docker cp ~/Downloads/geomesa/gdelt/20170710.export.CSV geodockeraccumulogeomesa_accumulo-master_1:/tmp/20170710.export.CSV
$ docker cp ~/Downloads/geomesa/gdelt/20170711.export.CSV geodockeraccumulogeomesa_accumulo-master_1:/tmp/20170711.export.CSV
$ docker cp ~/Downloads/geomesa/gdelt/20170712.export.CSV geodockeraccumulogeomesa_accumulo-master_1:/tmp/20170712.export.CSV

Loading or importing data is called “ingesting” in Geomesa parlance. Since the format of GDELT data is already predefined (the CSV mapping is defined in geomesa-tools/conf/sfts/gdelt/reference.conf), we can ingest the data:

$ docker exec geodockeraccumulogeomesa_accumulo-master_1 geomesa ingest -c geomesa.gdelt -C gdelt -f gdelt -s gdelt -u root -p GisPwd /tmp/20170710.export.CSV
$ docker exec geodockeraccumulogeomesa_accumulo-master_1 geomesa ingest -c geomesa.gdelt -C gdelt -f gdelt -s gdelt -u root -p GisPwd /tmp/20170711.export.CSV
$ docker exec geodockeraccumulogeomesa_accumulo-master_1 geomesa ingest -c geomesa.gdelt -C gdelt -f gdelt -s gdelt -u root -p GisPwd /tmp/20170712.export.CSV

Once the data is ingested, we can have a look at the the created table by asking GeoMesa to describe the created schema:

$ docker exec geodockeraccumulogeomesa_accumulo-master_1 geomesa describe-schema -c geomesa.gdelt -f gdelt -u root -p GisPwd
INFO  Describing attributes of feature 'gdelt'
globalEventId       | String
eventCode           | String
eventBaseCode       | String
eventRootCode       | String
isRootEvent         | Integer
actor1Name          | String
actor1Code          | String
actor1CountryCode   | String
actor1GroupCode     | String
actor1EthnicCode    | String
actor1Religion1Code | String
actor1Religion2Code | String
actor2Name          | String
actor2Code          | String
actor2CountryCode   | String
actor2GroupCode     | String
actor2EthnicCode    | String
actor2Religion1Code | String
actor2Religion2Code | String
quadClass           | Integer
goldsteinScale      | Double
numMentions         | Integer
numSources          | Integer
numArticles         | Integer
avgTone             | Double
dtg                 | Date    (Spatio-temporally indexed)
geom                | Point   (Spatially indexed)

User data:
  geomesa.index.dtg     | dtg
  geomesa.indices       | z3:4:3,z2:3:3,records:2:3
  geomesa.table.sharing | false

In the background, our data is stored in Accumulo tables. For a closer look, open an interactive terminal in the Accumulo master image:

$ docker exec -i -t geodockeraccumulogeomesa_accumulo-master_1 /bin/bash

and open the Accumulo shell:

# accumulo shell -u root -p GisPwd

When we store data in GeoMesa, there is not only one table but several. Each table has a specific purpose: storing metadata, records, or indexes. All tables get prefixed with the catalog table name:

root@accumulo> tables
accumulo.metadata
accumulo.replication
accumulo.root
geomesa.gdelt
geomesa.gdelt_gdelt_records_v2
geomesa.gdelt_gdelt_z2_v3
geomesa.gdelt_gdelt_z3_v4
geomesa.gdelt_queries
geomesa.gdelt_stats

By default, GeoMesa creates three indices:
Z2: for queries with a spatial component but no temporal component.
Z3: for queries with both a spatial and temporal component.
Record: for queries by feature ID.

But let’s get back to GeoMesa …

Querying data

Now we are ready to query the data. Let’s perform a simple attribute query first. Make sure that you are in the interactive terminal in the Accumulo master image:

$ docker exec -i -t geodockeraccumulogeomesa_accumulo-master_1 /bin/bash

This query filters for a certain event id:

# geomesa export -c geomesa.gdelt -f gdelt -u root -p GisPwd -q "globalEventId='671867776'"
Using GEOMESA_ACCUMULO_HOME = /opt/geomesa
id,globalEventId:String,eventCode:String,eventBaseCode:String,eventRootCode:String,isRootEvent:Integer,actor1Name:String,actor1Code:String,actor1CountryCode:String,actor1GroupCode:String,actor1EthnicCode:String,actor1Religion1Code:String,actor1Religion2Code:String,actor2Name:String,actor2Code:String,actor2CountryCode:String,actor2GroupCode:String,actor2EthnicCode:String,actor2Religion1Code:String,actor2Religion2Code:String,quadClass:Integer,goldsteinScale:Double,numMentions:Integer,numSources:Integer,numArticles:Integer,avgTone:Double,dtg:Date,*geom:Point:srid=4326
d9e6ab555785827f4e5f03d6810bbf05,671867776,120,120,12,1,UNITED STATES,USA,USA,,,,,,,,,,,,3,-4.0,20,2,20,8.77192982456137,2007-07-13T00:00:00.000Z,POINT (-97 38)
INFO  Feature export complete to standard out in 2290ms for 1 features

If the attribute query runs successfully, we can advance to some geo goodness … that’s why we are interested in GeoMesa after all … and perform a spatial query:

# geomesa export -c geomesa.gdelt -f gdelt -u root -p GisPwd -q "CONTAINS(POLYGON ((0 0, 0 90, 90 90, 90 0, 0 0)),geom)" -m 3
Using GEOMESA_ACCUMULO_HOME = /opt/geomesa
id,globalEventId:String,eventCode:String,eventBaseCode:String,eventRootCode:String,isRootEvent:Integer,actor1Name:String,actor1Code:String,actor1CountryCode:String,actor1GroupCode:String,actor1EthnicCode:String,actor1Religion1Code:String,actor1Religion2Code:String,actor2Name:String,actor2Code:String,actor2CountryCode:String,actor2GroupCode:String,actor2EthnicCode:String,actor2Religion1Code:String,actor2Religion2Code:String,quadClass:Integer,goldsteinScale:Double,numMentions:Integer,numSources:Integer,numArticles:Integer,avgTone:Double,dtg:Date,*geom:Point:srid=4326
139346754923c07e4f6a3ee01a3f7d83,671713129,030,030,03,1,NIGERIA,NGA,NGA,,,,,LIBYA,LBY,LBY,,,,,1,4.0,16,2,16,-1.4060533085217,2017-07-10T00:00:00.000Z,POINT (5.43827 5.35886)
9e8e885e63116253956e40132c62c139,671928676,042,042,04,1,NIGERIA,NGA,NGA,,,,,OPEC,IGOBUSOPC,,OPC,,,,1,1.9,5,1,5,-0.90909090909091,2017-07-10T00:00:00.000Z,POINT (5.43827 5.35886)
d6c6162d83c72bc369f68bcb4b992e2d,671817380,043,043,04,0,OPEC,IGOBUSOPC,,OPC,,,,RUSSIA,RUS,RUS,,,,,1,2.8,2,1,2,-1.59453302961275,2017-07-09T00:00:00.000Z,POINT (5.43827 5.35886)
INFO  Feature export complete to standard out in 2127ms for 3 features

Functions that can be used in export command queries/filters are (E)CQL functions from geotools for the most part. More sophisticated queries require SparkSQL.

Publishing GeoMesa tables with GeoServer

To view data in GeoServer, go to http://localhost:9090/geoserver/web. Login with admin:geoserver.

First, we create a new workspace called “geomesa”.

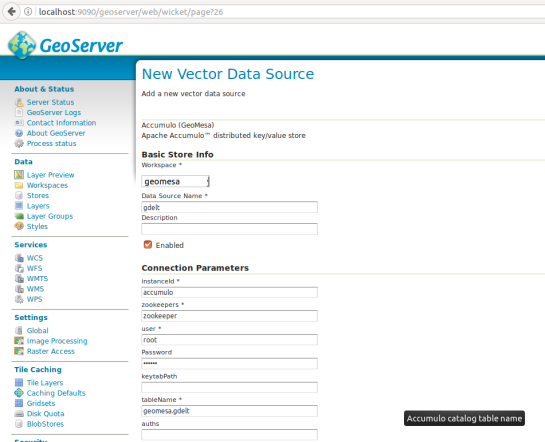
Then, we can create a new store of type Accumulo (GeoMesa) called “gdelt”. Use the following parameters:

instanceId = accumulo
zookeepers = zookeeper
user = root
password = GisPwd
tableName = geomesa.gdelt

Geodocker

Then we can configure a Layer that publishes the content of our new data store. It is good to check the coordinate reference system settings and insert the bounding box information:

Geodocker2

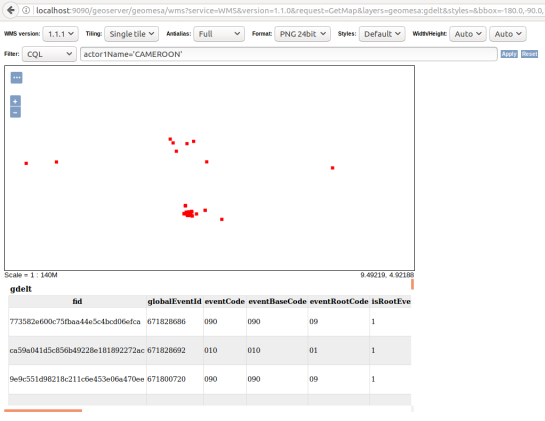
To preview the WMS, go to GeoServer’s preview:

http://localhost:9090/geoserver/geomesa/wms?service=WMS&version=1.1.0&request=GetMap&layers=geomesa:gdelt&styles=&bbox=-180.0,-90.0,180.0,90.0&width=768&height=384&srs=EPSG:4326&format=application/openlayers&TIME=2017-07-10T00:00:00.000Z/2017-07-10T01:00:00.000Z#

Which will look something like this:

Geodocker3

GeoMesa data filtered using CQL in GeoServer preview

For more display options, check the official GeoMesa tutorial.

If you check the preview URL more closely, you will notice that it specifies a time window:

&TIME=2017-07-10T00:00:00.000Z/2017-07-10T01:00:00.000Z

This is exactly where QGIS TimeManager could come in: Using TimeManager for WMS-T layers. Interoperatbility for the win!


Docker basics with Geodocker GeoServer

Today’s post is mostly notes-to-self about using Docker. These steps were tested on a fresh Ubuntu 17.04 install.

Install Docker as described in https://docs.docker.com/engine/installation/linux/docker-ce/ubuntu/ “Install using the repository” section.

Then add the current user to the docker user group (otherwise, all docker commands have to be prefixed with sudo)

$ sudo gpasswd -a $USER docker
$ newgrp docker

Test run the hello world image

$ docker run hello-world

For some more Docker basics, see https://github.com/docker/labs/blob/master/beginner/chapters/alpine.md.

Pull Geodocker images, for example from https://quay.io/organization/geodocker

$ docker pull quay.io/geodocker/base
$ docker pull quay.io/geodocker/geoserver

Get a list of pulled images

$ docker images
REPOSITORY TAG IMAGE ID CREATED SIZE
quay.io/geodocker/geoserver latest c60753e05956 8 months ago 904MB
quay.io/geodocker/base latest 293209905a47 8 months ago 646MB

Test run quay.io/geodocker/base

$ docker run -it --rm quay.io/geodocker/base:latest java -version
java version "1.8.0_45"
Java(TM) SE Runtime Environment (build 1.8.0_45-b14)
Java HotSpot(TM) 64-Bit Server VM (build 25.45-b02, mixed mode)

Run quay.io/geodocker/geoserver

$ docker run --name geoserver -e AUTHOR="Anita" \
 -d -P quay.io/geodocker/geoserver

The important options are:

-d … Run container in background and print container ID

-P … Publish all exposed ports to random ports

Check if the image is running

$ docker ps
CONTAINER ID IMAGE COMMAND CREATED STATUS PORTS NAMES
684598b57868 quay.io/geodocker/geoserver "/opt/tomcat/bin/c..." 
2 hours ago Up 2 hours 0.0.0.0:32772->9090/tcp geoserver

You can also check which ports to access using

$ docker port geoserver
9090/tcp -> 0.0.0.0:32772

Geoserver should now run on http://localhost:32772/geoserver/ (user=admin, password=geoserver)

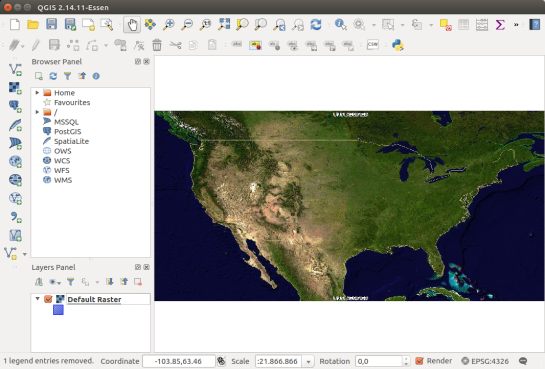
For more tests, let’s connect to Geoserver from QGIS

All default example layers are listed

and can be loaded into QGIS


Movement data in GIS #6: updates from AGILE2017

AGILE 2017 is the annual international conference on Geographic Information Science of the Association of Geographic Information Laboratories in Europe (AGILE) which was established in 1998 to promote academic teaching and research on GIS.

This years conference in Wageningen was my time at AGILE.  I had the honor to present our recent work on pedestrian navigation with landmarks [Graser, 2017].

If you are interested in trying it, there is an online demo. The conference also provided numerous pointers toward ideas for future improvements, including [Götze and Boye, 2016] and [Du et al., 2017]

On the issue of movement data in GIS, there weren’t too many talks on this topic at AGILE but on the conceptual side, I really enjoyed David Jonietz’ talk on how to describe trajectory processing steps:

Source: [Jonietz and Bucher, 2017]

In the pre-conference workshop I attended, there was also an interesting presentation on analyzing trajectory data with PostGIS by Phd candidate Meihan Jin.

I’m also looking forward to reading [Wiratma et al., 2017] “On Measures for Groups of Trajectories” because I think that the presentation only scratched the surface.

References

[Du et al, 2017] Du, S., Wang, X., Feng, C. C., & Zhang, X. (2017). Classifying natural-language spatial relation terms with random forest algorithm. International Journal of Geographical Information Science, 31(3), 542-568.
[Götze and Boye, 2016] Götze, J., & Boye, J. (2016). Learning landmark salience models from users’ route instructions. Journal of Location Based Services, 10(1), 47-63.
[Graser, 2017] Graser, A. (2017). Towards landmark-based instructions for pedestrian navigation systems using OpenStreetMap, AGILE2017, Wageningen, Netherlands.
[Jonietz and Bucher, 2017] Jonietz, D., Bucher, D. (2017). Towards an Analytical Framework for Enriching Movement Trajectories with Spatio-Temporal Context Data, AGILE2017, Wageningen, Netherlands.
[Wiratma et al., 2017] Wiratma L., van Kreveld M., Löffler M. (2017) On Measures for Groups of Trajectories. In: Bregt A., Sarjakoski T., van Lammeren R., Rip F. (eds) Societal Geo-innovation. GIScience 2017. Lecture Notes in Geoinformation and Cartography. Springer, Cham


Movement data in GIS #5: current research topics

In the 1st part of this series, I mentioned the Workshop on Analysis of Movement Data at the GIScience 2016 conference. Since the workshop took place in September 2016, 11 abstracts have been published (the website seems to be down currently, see the cached version) covering topics from general concepts for movement data analysis, to transport, health, and ecology specific articles. Here’s a quick overview of what researchers are currently working on:

  • General topics
    • Interpolating trajectories with gaps in the GPS signal while taking into account the context of the gap [Hwang et al., 2016]
    • Adding time and weather context to understand their impact on origin-destination flows [Sila-Nowicka and Fotheringham, 2016]
    • Finding optimal locations for multiple moving objects to meet and still arrive at their destination in time [Gao and Zeng, 2016]
    • Modeling checkpoint-based movement data as sequence of transitions [Tao, 2016]
  • Transport domain
    • Estimating junction locations and traffic regulations using extended floating car data [Kuntzsch et al., 2016]
  • Health domain
    • Clarifying physical activity domain semantics using ontology design patterns [Sinha and Howe, 2016]
    • Recognizing activities based on Pebble Watch sensors and context for eight gestures, including brushing one’s teeth and combing one’s hair [Cherian et al., 2016]
    • Comparing GPS-based indicators of spatial activity with reported data [Fillekes et al., 2016]
  • Ecology domain
    • Linking bird movement with environmental context [Bohrer et al., 2016]
    • Quantifying interaction probabilities for moving and stationary objects using probabilistic space-time prisms [Loraamm et al., 2016]
    • Generating probability density surfaces using time-geographic density estimation [Downs and Hyzer, 2016]

If you are interested in movement data in the context of ecological research, don’t miss the workshop on spatio-temporal analysis, modelling and data visualisation for movement ecology at the Lorentz Center in Leiden in the Netherlands. There’s currently a call for applications for young researchers who want to attend this workshop.

Since I’m mostly working with human and vehicle movement data in outdoor settings, it is interesting to see the bigger picture of movement data analysis in GIScience. It is worth noting that the published texts are only abstracts, therefore there is not much detail about algorithms and whether the code will be available as open source.

For more reading: full papers of the previous workshop in 2014 have been published in the Int. Journal of Geographical Information Science, vol 30(5). More special issues on “Computational Movement Analysis” and “Representation and Analytical Models for Location-based Social Media Data and Tracking Data” have been announced.

References

[Bohrer et al., 2016] Bohrer, G., Davidson, S. C., Mcclain, K. M., Friedemann, G., Weinzierl, R., and Wikelski, M. (2016). Contextual Movement Data of Bird Flight – Direct Observations and Annotation from Remote Sensing.
[Cherian et al., 2016] Cherian, J., Goldberg, D., and Hammond, T. (2016). Sensing Day-to-Day Activities through Wearable Sensors and AI.
[Downs and Hyzer, 2016] Downs, J. A. and Hyzer, G. (2016). Spatial Uncertainty in Animal Tracking Data: Are We Throwing Away Useful Information?
[Fillekes et al., 2016] Fillekes, M., Bereuter, P. S., and Weibel, R. (2016). Comparing GPS-based Indicators of Spatial Activity to the Life-Space Questionnaire (LSQ) in Research on Health and Aging.
[Gao and Zeng, 2016] Gao, S. and Zeng, Y. (2016). Where to Meet: A Context-Based Geoprocessing Framework to Find Optimal Spatiotemporal Interaction Corridor for Multiple Moving Objects.
[Hwang et al., 2016] Hwang, S., Yalla, S., and Crews, R. (2016). Conditional resampling for segmenting GPS trajectory towards exposure assessment.
[Kuntzsch et al., 2016] Kuntzsch, C., Zourlidou, S., and Feuerhake, U. (2016). Learning the Traffic Regulation Context of Intersections from Speed Profile Data.
[Loraamm et al., 2016] Loraamm, R. W., Downs, J. A., and Lamb, D. (2016). A Time-Geographic Approach to Wildlife-Road Interactions.
[Sila-Nowicka and Fotheringham, 2016] Sila-Nowicka, K. and Fotheringham, A. (2016). A route map to calibrate spatial interaction models from GPS movement data.
[Sinha and Howe, 2016] Sinha, G. and Howe, C. (2016). An Ontology Design Pattern for Semantic Modelling of Children’s Physical Activities in School Playgrounds.
[Tao, 2016] Tao, Y. (2016). Data Modeling for Checkpoint-based Movement Data.


Small multiples for OD flow maps using virtual layers

In my previous posts, I discussed classic flow maps that use arrows of different width to encode flows between regions. This post presents an alternative take on visualizing flows, without any arrows. This style is inspired by Go with the Flow by Robert Radburn and Visualisation of origins, destinations and flows with OD maps by J. Wood et al.

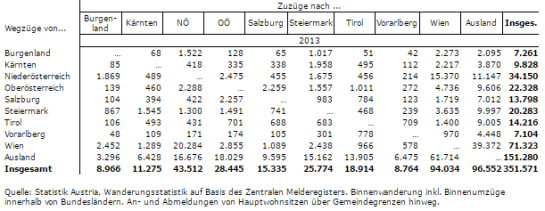
The starting point of this visualization is a classic OD matrix.

migration_raw_data

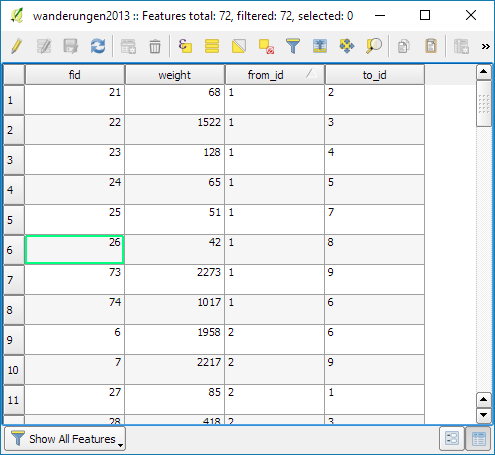
For my previous flow maps, I already converted this data into a more GIS-friendly format: a Geopackage with lines and information about the origin, destination and strength of the flow:

migration_attribute_table

In addition, I grabbed state polygons from Natural Earth Data.

At this point, we have 72 flow features and 9 state polygon features. An ordinary join in the layer properties won’t do the trick. We’d still be stuck with only 9 polygons.

Virtual layers to the rescue!

The QGIS virtual layers feature (Layer menu | Add Layer | Add/Edit Virtual Layer) provides database capabilities without us having to actually set up a database … *win!*

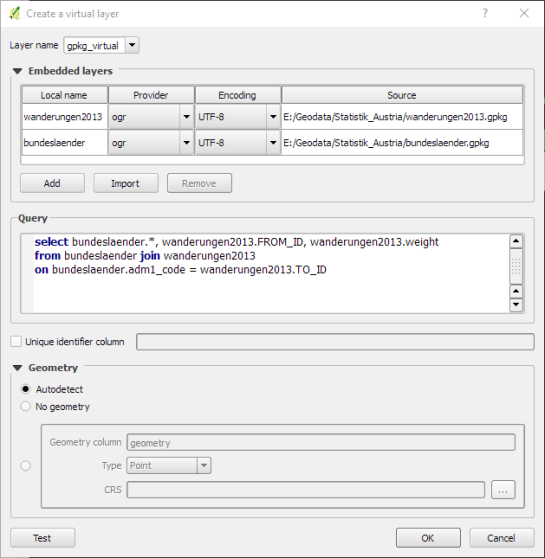
Using a classic SQL query, we can join state polygons and migration flows into a new virtual layer:

virtual_layer

The resulting virtual layer contains 72 polygon features. There are 8 copies of each state.

Now that the data is ready, we can start designing the visualization in the Print Composer.

This is probably the most manual step in this whole process: We need 9 map items, one for each mini map in the small multiples visualization. Create one and configure it to your liking, then copy and paste to create 8 more copies.

I’ve decided to arrange the map items in a way that resembles the actual geographic location of the state that is represented by the respective map, from the state of Vorarlberg (a proud QGIS sponsor by the way) in the south-west to Lower Austria in the north-east.

To configure which map item will represent the flows from which origin state, we set the map item ID to the corresponding state ID. As you can see, the map items are numbered from 1 to 9:

small_multiples_print_composer_init

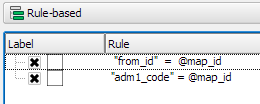
Once all map items are set up, we can use the map item IDs to filter the features in each map. This can be implemented using a rule based renderer:

small_multiples_style_rules

The first rule will ensure that the each map only shows flows originating from a specific state and the second rule will select the state itself.

We configure the symbol of the first rule to visualize the flow strength. The color represents the number number of people moving to the respective district. I’ve decided to use a smooth gradient instead of predefined classes for the polygon fill colors. The following expression maps the feature’s weight value to a shade on the Viridis color ramp:

ramp_color( 'Viridis',
  scale_linear("weight",0,2000,0,1)
)

You can use any color ramp you like. If you want to use the Viridis color ramp, save the following code into an .xml file and import it using the Style Manager. (This color ramp has been provided by Richard Styron on rocksandwater.net.)

<!DOCTYPE qgis_style>
<qgis_style version="0">
  <symbols/>
    <colorramp type="gradient" name="Viridis">
      <prop k="color1" v="68,1,84,255"/>
      <prop k="color2" v="253,231,36,255"/>
      <prop k="stops" v="0.04;71,15,98,255:0.08;72,29,111,255:0.12;71,42,121,255:0.16;69,54,129,255:0.20;65,66,134,255:0.23;60,77,138,255:0.27;55,88,140,255:0.31;50,98,141,255:0.35;46,108,142,255:0.39;42,118,142,255:0.43;38,127,142,255:0.47;35,137,141,255:0.51;31,146,140,255:0.55;30,155,137,255:0.59;32,165,133,255:0.62;40,174,127,255:0.66;53,183,120,255:0.70;69,191,111,255:0.74;89,199,100,255:0.78;112,206,86,255:0.82;136,213,71,255:0.86;162,218,55,255:0.90;189,222,38,255:0.94;215,226,25,255:0.98;241,229,28,255"/>
    </colorramp>
  </colorramps>
</qgis_style>

If we go back to the Print Composer and update the map item previews, we see it all come together:

small_multiples_print_composer

Finally, we set title, legend, explanatory texts, and background color:

migration

I think it is amazing that we are able to design a visualization like this without having to create any intermediate files or having to write custom code. Whenever a value is edited in the original migration dataset, the change is immediately reflected in the small multiples.


QGIS Atlas Tutorial – Material Design

This is a guest post by Mickael HOARAU @Oneil974

For people who are working on QGIS Atlas feature, I worked on an Atlas version of the last tutorial I have made. The difficulty level is a little bit more consequente then last tutorial but there are features that you could appreciate. So I’m happy to share with you and I hope this would be helpful.

Click to view slideshow.

You can download tutorial here:

Material Design – QGIS Atlas Tutorial

And sources here:

https://drive.google.com/file/d/0B37RnaYSMWAZUUJ2NUxhZC1TNmM/view?usp=sharing


PS : I’m looking for job offers, feel free to contact me on twitter @Oneil974


Back to Top

Sustaining Members