Related Plugins and Tags

QGIS Planet

QGIS video tutorials: election maps, hydrology, and more

Mapping spatial decision patterns, such as election results, is always a hot topic. That’s why we decided to include a recipe for election maps in our QGIS Map Design books. What’s new is that this recipe is now available as a free video tutorial recorded by Oliver Burdekin:

This video is just one of many recently published video tutorials that have been created by QGIS community members.

For example, Hans van der Kwast and Kurt Menke have recorded a 7-part series on QGIS for Hydrological Applications:

and Klas Karlsson’s Youtube channel is also always worth a follow:

For the Pythonically inclined among you, there is also a new version of Python in QGIS on the Automating GIS-processes channel:


Movement data in GIS #24: MovingPandas hands-on tutorials

Last week, I had the pleasure to give a movement data analysis workshop at the OpenGeoHub summer school at the University of Münster in Germany. The workshop materials consist of three Jupyter notebooks that have been designed to also support self-study outside of a workshop setting. So you can try them out as well!

All materials are available on Github:

  • Tutorial 0 provides an introduction to the MovingPandas Trajectory class.
  • Tutorials 1 and 2 provide examples with real-world datasets covering one day of ship movement near Gothenburg and multiple years of gull migration, respectively.

Here’s a quick preview of the bird migration data analysis tutorial (click for full size):

Tutorial 2: Bird migration data analysis

You can run all three Jupyter notebooks online using MyBinder (no installations required).

Alternatively or if you want to dig deeper: installation instructions are available on movingpandas.org

The OpenGeoHub summer school this year had a strong focus on spatial analysis with R and GRASS (sometimes mixing those two together). It was great to meet @mdsumner (author of R trip) and @edzerpebesma (author of R trajectories) for what might have well been the ultimate movement data libraries geek fest. In the ultimate R / Python cross-over,  0_getting_started.Rmd

Both talks and workshops have been recorded. Here’s the introduction:

and this is the full workshop recording:


This post is part of a series. Read more about movement data in GIS.

Profile Tool tutorial

Profile Tool is a plugin for QGIS which makes it possible to generate (elevation) profiles for line features. The plugin is available through the default QGIS plugin repository. While testing the plugin, I found some aspects of using the tool might require additional instructions.

After installing and enabling the plugin, you will find the “Terrain profile” button in the plugin toolbar:

qgisprofiletool

The basic use case is as follows:

  1. Load the elevation raster and select this raster layer in the layer list.
  2. Press the “Terrain profile” button. This opens the plugin panel which consists of a graph area on the left and a raster layer list on the right. The raster layer you had selected will be added to the raster layer list.
  3. If you have “Selection: Temporary polyline” enabled, you can now draw a line in the map area. Double-click left to end drawing the line. (If you are paying close attention, you might have noticed the instructions in the status bar.)
  4. After you have finished drawing the line, the graph area will update and display the profile.

qgisprofiletool2

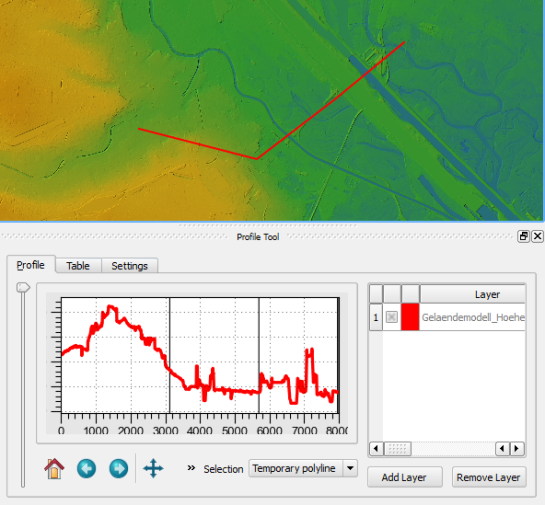
If you want to add another raster layer to the plugin, you need to first select the raster layer in the QGIS layer list and then press the “Add Layer” button in the Profile Tool panel.

To generate the profile for an existing line feature, you need to change the selection mode from “Temporary polyline” to “Selected polyline”. Then you need to select the vector layer which contains the line feature you want to use in the QGIS layer list. Finally, you can click on the line feature in the map area to select it. (Note that this selection is independent of any selections you might have going on using the default QGIS feature selection tools.)

If you change from the Profile Tool to any other tool such as “Pan Map” or “Identify”, you have to click the “Terrain profile” button again to re-enable drawing/selection a line for the Profile Tool.

Due to a bug, it is currently not possible to export the profile graph. An alternative is to open the “Table” tab of the Profile Tool panel which provides access to the profile data and copy the data into your preferred graphing application such as Calc or Excel.

If you want to see the Profile Tool in action, I recommend watching the introduction video by Lene Fischer (University of Copenhagen).


Group Stats Tutorial

Group Stats is a plugin for QGIS which makes it easy to calculate statistics for feature groups in a vector layer. Note that the plugin is still marked “experimental” so you have to allow experimental plugins in order to install it. I tried this plugin for the first time today and decided to write this post because it didn’t seem immediately obvious how to use it.

The plugin button is added to the vector toolbar and of course you can access it via vector menu.

groupstatsicon

The example I want to show is: How to calculate the total area of of each Corine Land Cover (CLC) class per state.

corineAT

After adding state information to the CLC datasets by intersecting CLC and state geometries from Natural Earth we can get started with Group Stats.

groupstats

The big area on the left will display the results. The input fields are on the right. The general idea is to drag and drop fields and/or functions into the “columns”, “rows” and “values” sections. (Double-clicking field names does not do anything.) To remove fields again, you have to drop them back into the field list.

To calculate the total area of of each Corine Land Cover (CLC) class per state, I chose land cover classes as columns, state names as rows and sum of areas as values:

groupstatsclc

It’s also possible to add multiple functions in the columns/rows input sections to calculate different statistics at once:

groupstats_functions

Group Stats can be used in many cases that otherwise require a Spreadsheet software. The results can be exported to CSV easily. Usability could certainly be improved by allowing common interactions such as removing fields by pressing the delete key or adding fields by double-clicking.


QGIS Video Tutorials

QGIS wiki now has it’s own section listing QGIS video tutorials.
If you know of any tutorials not listed yet, leave a comment and I’ll add them.

Together with the newly started “How to I do that in QGIS” tutorial collection, this will hopefully become the number one reference for both new users doing their first GIS-related work and advanced uses interested in the latest QGIS features.


Back to Top

Sustaining Members