


Routing in polygon layers? Yes we can!
A few weeks ago, the city of Vienna released a great dataset: the so-called “Flächen-Mehrzweckkarte” (FMZK) is a polygon vector layer with an amazing level of detail which contains roads, buildings, sidewalk, parking lots and much more detail:
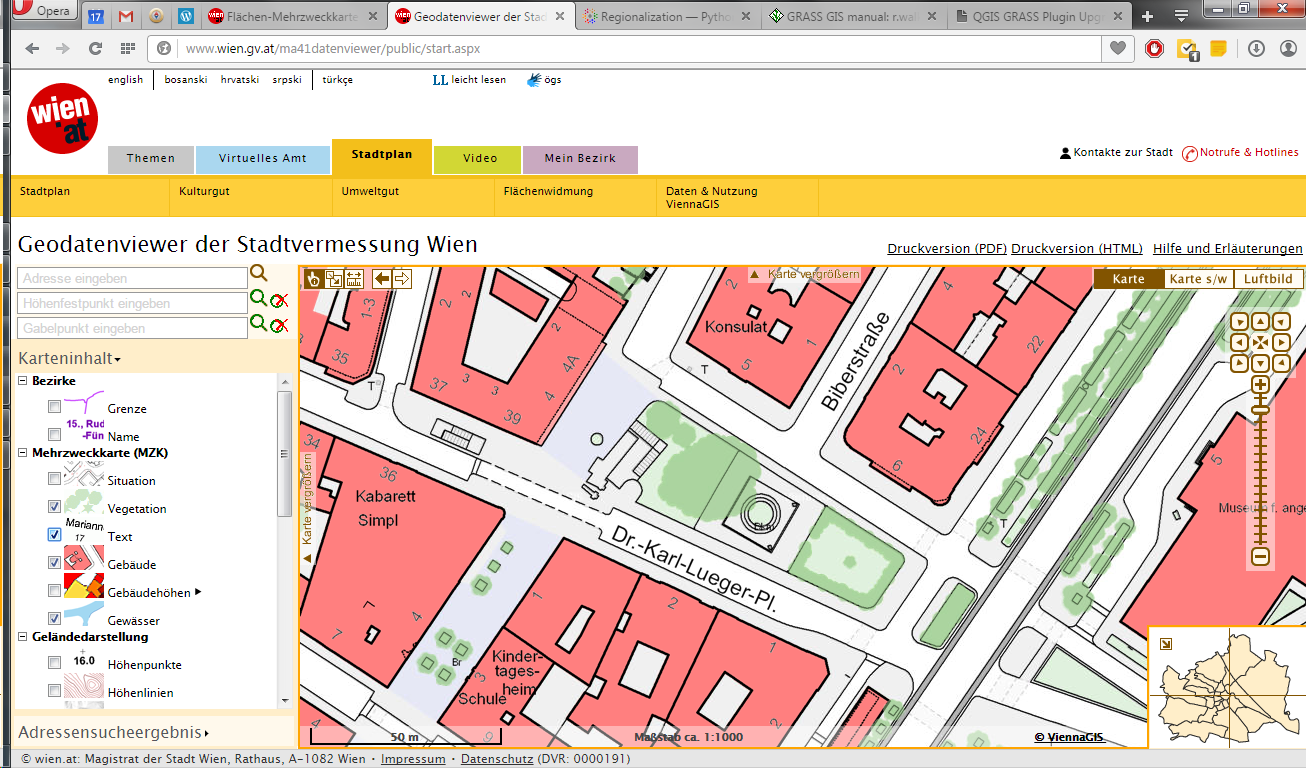
preview of the Flächen-Mehrzweckkarte
Now, of course we can use this dataset to create gorgeous maps but wouldn’t it be great to use it for analysis? One thing that has been bugging me for a while is routing for pedestrians and how it’s still pretty bad in many situations. For example, if I’d be looking for a route from the northern to the southern side of the square in the previous screenshot, the suggestions would look something like this:

Pedestrian routing in Google Maps
… Great! Google wants me to walk around it …

Pedestrian routing on openstreetmap.org
… Openstreetmap too – but on the other side :P
Wouldn’t it be nice if we could just cross the square? There’s no reason not to. The routing graphs of OSM and Google just don’t contain a connection. Polygon datasets like the FMZK could be a solution to the issue of routing pedestrians over squares. Here’s my first attempt using GRASS r.walk:

Routing with GRASS r.walk (Green areas are walk-friendly, yellow/orange areas are harder to cross, and red buildings are basically impassable.)
… The route crosses the square – like any sane pedestrian would.
The key steps are:
- Assigning pedestrian costs to different polygon classes
- Rasterizing the polygons
- Computing a cost raster for moving using r.walk
- Computing the route using r.drain
I’ve been using GRASS 7 for this example. GRASS 7 is not yet compatible with QGIS but it would certainly be great to have access to this functionality from within QGIS. You can help make this happen by supporting the crowdfunding initiative for the GRASS plugin update.


