Related Plugins and Tags

QGIS Planet

Computing network centers

How do you objectively define and compute which parts of a network are in the center? One approach is to use the concept of centrality.

Centrality refers to indicators which identify the most important vertices within a graph. Applications include identifying the most influential person(s) in a social network, key infrastructure nodes in the Internet or urban networks, and super spreaders of disease. (Source: http://en.wikipedia.org/wiki/Centrality)

Researching this topic, it turns out that some centrality measures have already been implemented in GRASS GIS. thumbs up!

v.net.centrality computes degree, betweeness, closeness and eigenvector centrality.

As a test, I’ve loaded the OSM street network of Vienna and run

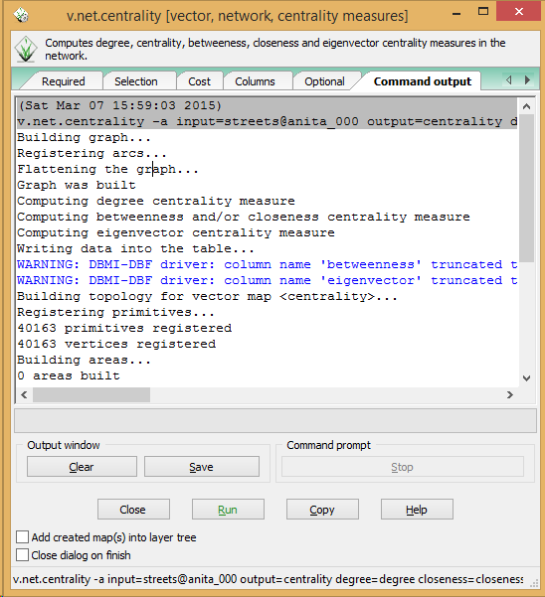
v.net.centrality -a input=streets@anita_000 output=centrality degree=degree closeness=closeness betweenness=betweenness eigenvector=eigenvector

grass_centrality

The computations take a while.

In my opinion, the most interesting centrality measures for this street network are closeness and betweenness:

Closeness “measures to which extent a node i is near to all the other nodes along the shortest paths”. Closeness values are lowest in the center of the network and higher in the outskirts.

Betweenness “is based on the idea that a node is central if it lies between many other nodes, in the sense that it is traversed by many of the shortest paths connecting couples of nodes.” Betweenness values are highest on bridges and other important arterials while they are lowest for dead-end streets.

(Definitions as described in more detail in Crucitti, Paolo, Vito Latora, and Sergio Porta. “Centrality measures in spatial networks of urban streets.” Physical Review E 73.3 (2006): 036125.)

Centrality: low values in pink, high values in green

Centrality: low values in pink, high values in green

Works great! Unfortunately, v.net.centrality is not yet part of the QGIS Processing GRASS toolbox. It would certainly be a great addition.


OSM Toner style town labels explained

The point table of the Spatialite database created from OSM north-eastern Austria contains more than 500,000 points. This post shows how the style works which – when applied to the point layer – wil make sure that only towns and (when zoomed in) villages will be marked and labeled.

Screenshot 2014-07-12 12.30.21

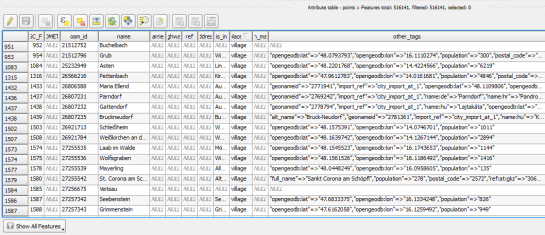
In the attribute table, we can see that there are two tags which provide context for populated places: the place and the population tag. The place tag has it’s own column created by ogr2ogr when converting from OSM to Spatialite. The population tag on the other hand is listed in the other_tags column.

Screenshot 2014-07-12 13.00.15

for example

"opengeodb:lat"=>"47.5000237","opengeodb:lon"=>"16.0334769","population"=>"623"

Overview maps would be much too crowded if we simply labeled all cities and towns. Therefore, it is necessary to filter towns based on their population and only label the bigger ones. I used limits of 5,000 and 10,000 inhabitants depending on the scale.

Screenshot 2014-07-12 12.56.33

At the core of these rules is an expression which extracts the population value from the other_tags attribute: The strpos() function is used to locate the text "population"=>" within the string attribute value. The population value is then extracted using the left() function to get the characters between "population"=>" and the next occurrence of ". This value can ten be cast to integer using toint() and then compared to the population limit:

5000 < toint( 
   left (
      substr(
         "other_tags",
         strpos("other_tags" ,'"population"=>"')+16,
         8
      ),
      strpos(
         substr(
            "other_tags",
            strpos("other_tags" ,'"population"=>"')+16,
            8
         ),
        '"'
      )
   )
) 

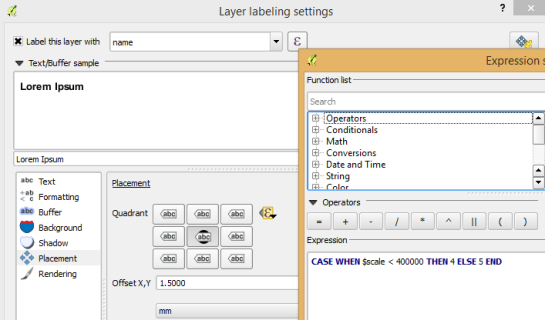
There is also one additional detail concerning label placement in this style: When zoomed in closer than 1:400,000 the labels are placed on top of the points but when zoomed out further, the labels are put right of the point symbol. This is controlled using a scale-based expression in the label placement:

Screenshot 2014-07-12 13.32.47

As usual, you can find the style on Github: https://github.com/anitagraser/QGIS-resources/blob/master/qgis2/osm_spatialite/osm_spatialite_tonerlite_point.qml


1st European State of the Map Conference in Vienna

The 1st European State of the Map Conference (SotM-Europe) will be held July 15-17 in Vienna, Austria. So far, there have been 4 International State of the Map conferences. This will be the first European edition of this event.

Topics include:

  • Mapping (mapping, data, tagging, the state of the map in your country, etc…)
  • TechTalks (development, rendering and infrastructure)
  • Powered by OpenStreetMap (projects/business ideas based on OpenStreetMap)
  • Convergence (open geo data world vs. the world of proprietary and authoritive data and software)
  • Research (for researchers working with OpenStreetMap data)
  • Others (other interesting information)

The call for papers is still open until Monday, February 28 2011.

The international conference will be held in Denver, Colorado from September 9-11 2011.


Back to Top

Sustaining Members