Related Plugins and Tags

QGIS Planet

Intro to QGIS3 3D view with Viennese building data

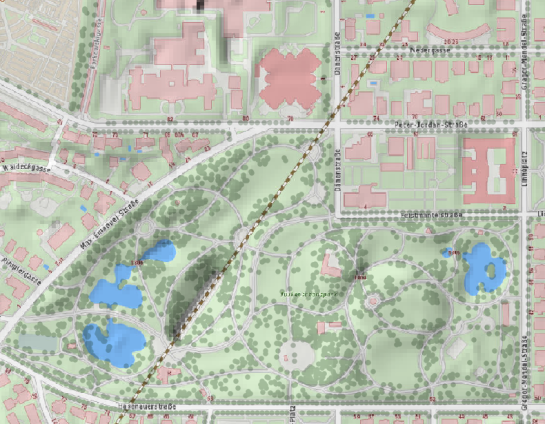
In this post, I want to show how to visualize building block data published by the city of Vienna in 3D using QGIS. This data is interesting due to its level of detail. For example, here you can see the Albertina landmark in the center of Vienna:

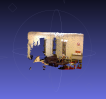
an this is the corresponding 3D visualization, including flying roof:

To enable 3D view in QGIS 2.99 (soon to be released as QGIS 3), go to View | New 3D Map View.

Viennese building data (https://www.data.gv.at/katalog/dataset/76c2e577-268f-4a93-bccd-7d5b43b14efd) is provided as Shapefiles. (Saber Razmjooei recently published a similar post using data from New York City in ESRI Multipatch format.) You can download a copy of the Shapefile and a DEM for the same area from my dropbox.  The Shapefile contains the following relevant attributes for 3D visualization

  • O_KOTE: absolute building height measured to the roof gutter(?) (“absolute Gebäudehöhe der Dachtraufe”)
  • U_KOTE: absolute height of the lower edge of the building block if floating above ground (“absolute Überbauungshöhe unten”)
  • HOEHE_DGM: absolute height of the terrain (“absolute Geländehöhe”)
  • T_KOTE: lowest point of the terrain for the given building block (“tiefster Punkt des Geländes auf den Kanten der Gebäudeteilfläche”)

To style the 3D view in QGIS 3, I set height to “U_KOTE” and extrusion to

O_KOTE-coalesce(U_KOTE,0)

both with a default value of 0 which is used if the field or expression is NULL:

The altitude clamping setting defines how height values are interpreted. Absolute clamping is perfect for the Viennese data since all height values are provided as absolute measures from 0. Other options are “relative” and “terrain” which add given elevation values to the underlying terrain elevation. According to the source of qgs3dutils:

  AltClampAbsolute,   //!< Z_final = z_geometry
  AltClampRelative,   //!< Z_final = z_terrain + z_geometry
  AltClampTerrain,    //!< Z_final = z_terrain

The gray colored polygon style shown in the map view on the top creates the illusion of shadows in the 3D view:


Beyond that, this example also features elevation model data which can be configured in the 3D View panel. I found it helpful to increase the terrain tile resolution (for example to 256 px) in order to get more detailed terrain renderings:

Overall, the results look pretty good. There are just a few small glitches in the rendering, as well as in the data. For example, the kiosik in front of Albertina which you can also see in the StreetView image, is lacking height information and therefore we can only see it’s “shadow” in the 3D rendering.

So far, I found 3D rendering performance very good. It works great on my PC with Nvidia graphics card. On my notebook with Intel Iris graphics, I’m unfortunately still experiencing crashes which I hope will be resolved in the future.

Experiments in the 3rd dimension

The upcoming 2.14 release of QGIS features a new renderer. For the first time in QGIS history, it will be possible to render 2.5D objects directly in the map window. This feature is the result of a successful crowd funding campaign organized by Matthias Kuhn last year.

In this post, I’ll showcase this new renderer and compare the achievable results to output from the Qgis2threejs plugin.

For this post, I’m using building parts data from the city of Vienna, which is publicly available through their data viewer:

This dataset is a pretty detailed building model, where each building is made up of multiple features that represent parts of the building with different height. Of course, if we just load the dataset in default style, we cannot really appreciate the data:

Loaded building parts layer

Loaded building parts layer

All this changes if we use the new 2.5D renderer. With just a few basic settings, we can create 2.5D representations of the building parts:

QGIS 2.5D renderer settings

QGIS 2.5D renderer settings

Compare the results to aerial images in Google Maps …

QGIS 2.5D renderer and view in Google Maps

QGIS 2.5D renderer and view in Google Maps

… not bad at all!

Except for a few glitches concerning the small towers at the corners of the building, and some situations where it seems like the wrong building part is drawn in the front, the 2.5D look is quite impressive.

Now, how does this compare to Qgis2threejs, one of the popular plugins which uses web technologies to render 3D content?

One obvious disadvantage of Qgis2threejs is that we cannot define a dedicated roof color. Thus the whole block is drawn in the same color.

On the other hand, Qgis2threejs does not suffer from the rendering order issues that we observe in the QGIS 2.5D renderer and the small towers in the building corners are correctly displayed as well:

QGIS 2.5D renderer and QGIS2threejs output

QGIS 2.5D renderer and Qgis2threejs output

Overall, the 2.5D renderer is a really fun and exciting new feature. Besides the obvious building usecase, I’m sure we will see a lot of thematic maps making use of this as well.

Give it a try!

In the next post, I’m planning a more in-depth look into how the 2.5D renderer works. Here’s a small teaser of what’s possible if you are not afraid to get your hands dirty:


3D viz with QGIS & three.js

If you are looking for a tool to easily create 3D visualizations of your geodata, look no further! Qgis2threejs is a plugin by Minoru Akagi which exports terrain data combined with the map canvas image and optional vector data to an html file which can be viewed in 3D in any web browser which supports WebGL. To do that, this plugin uses the Three.js library.

This is the result of my first experiments with Qgis2threejs. In the following sections, I will show the steps to reproduce it.

Türkenschanzpark, Vienna

click for the interactive version (requires WebGL-capable browser)

1. The data

The building blocks of this visualization are:

  • elevation data and the hillshade derived from this data
  • a base map (WMTS from basemap.at in my case)
  • OSM building data provided by Geofabrik and
  • tree data from the city of Vienna

Load all datasets into QGIS.

2. Preparing the map

Qgis2threejs will overlay the map (as rendered in the QGIS map area) on top of the elevation model. You can combine any number of layers to create your map. I just loaded a basemap.at WMTS and a hillshade layer. To add a nice tree shadow effect, I also added the tree layer (dark grey, 50% transparency, multiply blending).

tuerkenschanzpark_map

3. Preparing the vector features

The vector features in the visualization are buildings and trees. The buildings are based on an OSM building layer. The trees are create from two point layers: one point layer to create the tree trunks (cylinder shape) and a duplicate of this point layer to create the tree crowns (sphere shape).

Load the data and choose the desired fill colors.

4. Using Qgis2threejs

Now we can start Qgis2threejs. The first tab is used to configure the terrain. Just pick the correct elevation data layer. I didn’t modify any of the other default settings.

qgis2threejs_dem

The second tab provides the settings for the vector data. As mentioned in the previous section, the trees are created from two point layers and the buildings are based on a polygon layer. The tree crowns are spheres with a radius size 3 and a z value of 5 above the surface. The tree trunks are cylinders. Finally, the buildings have a height of 10.

qgis2threejs_vector

That’s it! Just press “run” and wait. When the export is finished, your default browser (or a different one, if you specify another one in the plugin settings) will open automatically and display the results.
The visualization is interactive. You can tilt the visualization using the left mouse button, pan using the right mouse button, and zoom using the mouse wheel. I found that Firefox used around 1.6 GB of RAM to render this example.

5. Share your visualization

In the browser window, you will see where Qgis2threejs stored the html and associated Javascript files. To share your visualization, you just need to copy these files onto a webserver.

I would love to see what you come up with. Please share a link in the comments.


Real World Mapping with the Kinect (via Decorator Pattern (Martin Szarski’s Blog))

Always wanted your very own 3d scanner? Try Kinect:

Real World Mapping with the Kinect Many people have experimented with using the Kinect for more than just user interaction. One thing that I have been very interested in is extracting point clouds from the device. People at the ROS (ros.org) project have gone to some trouble to determine empirical calibration parameters for the depth camera (disparity to real-world depth) here, and Nicolas Burrus has posted parameters for the RGB camera (relationship between the depth image and th … Read More

via Decorator Pattern (Martin Szarski’s Blog)


Back to Top

Sustaining Members