Related Plugins and Tags

QGIS Planet

PyQGIS for non-programmers

If you’re are following me on Twitter, you’ve certainly already read that I’m working on PyQGIS 101 a tutorial to help GIS users to get started with Python programming for QGIS.

I’ve often been asked to recommend Python tutorials for beginners and I’ve been surprised how difficult it can be to find an engaging tutorial for Python 3 that does not assume that the reader already knows all kinds of programming concepts.

It’s been a while since I started programming, but I do teach QGIS and Python programming for QGIS to university students and therefore have some ideas of which concepts are challenging. Nonetheless, it’s well possible that I overlook something that is not self explanatory. If you’re using PyQGIS 101 and find that some points could use further explanations, please leave a comment on the corresponding page.

PyQGIS 101 is a work in progress. I’d appreciate any feedback, particularly from beginners!

Scalable spatial vector data processing

Working with movement data analysis, I’ve banged my head against performance issues every once in a while. For example, PostgreSQL – and therefore PostGIS – run queries in a single thread of execution. This is now changing, with more and more functionality being parallelized. PostgreSQL version 9.6 (released on 2016-09-29) included important steps towards parallelization, including parallel execution of sequential scans, joins and aggregates. Still, there is no parallel processing in PostGIS so far (but it is under development as described by Paul Ramsey in his posts “Parallel PostGIS II” and “PostGIS Scaling” from late 2017).

At the FOSS4G2016 in Bonn, I had the pleasure to chat with Shoaib Burq who ran the “An intro to Apache PySpark for Big Data GeoAnalysis” workshop. Back home, I downloaded the workshop material and gave it a try but since I wanted a scalable system for storing, analyzing, and visualizing spatial data, it didn’t really seem to fit the bill.

Around one year ago, my search grew more serious since we needed a solution that would support our research group’s new projects where we expected to work with billions of location records (timestamped points and associated attributes). I was happy to find that the fine folks at LocationTech have some very promising open source projects focusing on big spatial data, most notably GeoMesa and GeoWave. Both tools take care of storing and querying big spatio-temporal datasets and integrate into GeoServer for publication and visualization. (A good – if already slightly outdated – comparison of the two has been published by Azavea.)

My understanding at the time was that GeoMesa had a stronger vector data focus while GeoWave was more focused on raster data. This lead me to try out GeoMesa. I published my first steps in “Getting started with GeoMesa using Geodocker” but things only really started to take off once I joined the developer chats and was pointed towards CCRI’s cloud-local “a collection of bash scripts to set up a single-node cloud on your desktop, laptop, or NUC”. This enabled me to skip most of the setup pains and go straight to testing GeoMesa’s functionality.

The learning curve is rather significant: numerous big data stack components (including HDFS, Accumulo, and GeoMesa), a most likely new language (Scala), as well as the Spark computing system require some getting used to. One thing that softened the blow is the fact that writing queries in SparkSQL + GeoMesa is pretty close to writing PostGIS queries. It’s also rather impressive to browse hundreds of millions of points by connecting QGIS TimeManager to a GeoServer WMS-T with GeoMesa backend.

Spatial big data stack with GeoMesa

One of the first big datasets I’ve tested are taxi floating car data (FCD). At one million records per day, the three years in the following example amount to a total of around one billion timestamped points. A query for travel times between arbitrary start and destination locations took a couple of seconds:

Travel time statistics with GeoMesa (left) compared to Google Maps predictions (right)

Besides travel time predictions, I’m also looking into the potential for predicting future movement. After all, it seems not unreasonable to assume that an object would move in a similar fashion as other similar objects did in the past.

Early results of a proof of concept for GeoMesa based movement prediction

Big spatial data – both vector and raster – are an exciting challenge bringing new tools and approaches to our ever expanding spatial toolset. Development of components in open source big data stacks is rapid – not unlike the development speed of QGIS. This can make it challenging to keep up but it also holds promises for continuous improvements and quick turn-around times.

If you are using GeoMesa to work with spatio-temporal data, I’d love to hear about your experiences.

Movement data in GIS #13: Timestamp labels for trajectories

In Movement data in GIS #2: visualization I mentioned that it should be possible to label trajectory segments without having to break the original trajectory feature. While it’s not a straightforward process, it is indeed possible to create timestamp labels at desired intervals:

The main point here is that we cannot use regular labels because there would be only one label for the whole trajectory feature. Instead, we are using a marker line with a font marker:

By default, font markers only display one character from a given font but by using expressions we can make it display longer text, including datetime strings:

If you want to have a label at every node of the trajectory, the expression looks like this:

format_date( 
   to_datetime('1970-01-01T00:00:00Z')+to_interval(
      m(start_point(geometry_n(
         segments_to_lines( $geometry ),
         @geometry_part_num)
      ))||' seconds'
   ),
   'HH:mm:ss'
)

You probably remember those parts of the expression that extract the m value from previous posts. Note that – compared to 2016 – it is now necessary to add the segments_to_lines() function.

The m value (which stores time as seconds since Unix epoch) is then converted to datetime and finally formatted to only show time. Of course you can edit the datetime format string to also include the date.

If we only want a label every 30 seconds, we can add a case statement around that:

CASE WHEN 
m(start_point(geometry_n(
   segments_to_lines( $geometry ),
   @geometry_part_num)
)) % 30 = 0
THEN
format_date( 
   to_datetime('1970-01-01T00:00:00Z')+to_interval(
      m(start_point(geometry_n(
         segments_to_lines( $geometry ),
         @geometry_part_num)
      ))||' seconds'
   ),
   'HH:mm:ss'
)
END

This works well if the trajectory sampling interval is fairly regular. This is not always the case and that means that the above case statement wouldn’t find many nodes with a timestamp that ends in :30 or :00. In such a case, we could resort to labeling nodes based on their order in the linestring:

CASE WHEN 
 @geometry_part_num  % 30 = 0
THEN
...

Thanks a lot to @JuergenEFischer for providing a solution for converting seconds since Unix epoch to datetime without a custom function!

Note that expressions using @geometry_part_num currently suffer from the following issue: Combination of segments_to_lines($geometry) and @geometry_part_num gives wrong segment numbers


This post is part of a series. Read more about movement data in GIS.

Movement data in GIS #12: why you should be using PostGIS trajectories

In short: both writing trajectory queries as well as executing them is considerably faster using PostGIS trajectories (as LinestringM) rather than the commonly used point-based approach.

Here are a couple of examples to give you an impression of the differences.

Spoiler alert! Trajectory queries are up to 500 times faster than comparable point-based queries.

A quick look at indexing

In both cases, we have indexed the tracker id, geometry, and time columns to speed up query processing.

The trajectory table has 3 indexes

  • gist (time_range)
  • gist (track gist_geometry_ops_nd)
  • btree (tracker)

The point-based table has 4 indexes

  • gist (pt)
  • btree (trajectory_id)
  • btree (tracker)
  • btree (t)

Length

First, let’s see how to determine trajectory length for all observed moving objects (identified by a tracker id).

Using the point-based approach, we first need to ensure that the points are in the correct temporal order, create the lines, and finally sum up their length:

WITH ordered AS (
 SELECT trajectory_id, tracker, t, pt
 FROM geolife.trajectory_pt
 ORDER BY t
), tmp AS (
 SELECT trajectory_id, tracker, st_makeline(pt) traj
 FROM ordered 
 GROUP BY trajectory_id, tracker
)
SELECT tracker, round(sum(ST_Length(traj::geography)))
FROM tmp
GROUP BY tracker 
ORDER BY tracker

With trajectories, we can go right to computing lengths:

SELECT tracker, round(sum(ST_Length(track::geography)))
FROM geolife.trajectory_ext
GROUP BY tracker
ORDER BY tracker

On my test system, the trajectory query run time is 22.7 sec instead of 43.0 sec for the point-based approach:

Duration

Compared to trajectory length, duration is less complicated in the point-based approach:

WITH tmp AS (
 SELECT trajectory_id, tracker, min(t) start_time, max(t) end_time
 FROM geolife.trajectory_pt
 GROUP BY trajectory_id, tracker
)
SELECT tracker, sum(end_time - start_time)
FROM tmp
GROUP BY tracker
ORDER BY tracker

Still, the trajectory query is less complex and much faster at 31 ms instead of 6.0 sec:

SELECT tracker, sum(upper(time_range) - lower(time_range))
FROM geolife.trajectory_ext
GROUP BY tracker
ORDER BY tracker

Temporal filter

Extracting trajectories that occurred during a certain time frame is another common use case:

WITH tmp AS (
 SELECT trajectory_id, tracker, min(t) start_time, max(t) end_time
 FROM geolife.trajectory_pt
 GROUP BY trajectory_id, tracker
)
SELECT trajectory_id, tracker, start_time, end_time
FROM tmp
WHERE end_time > '2008-11-26 11:00'
AND start_time < '2008-11-26 15:00'
ORDER BY tracker

This point-based query takes 6.0 sec while the shorter trajectory query finishes in 12 ms:

SELECT id, tracker, time_range
FROM geolife.trajectory_ext
WHERE time_range && '[2008-11-26 11:00+1,2008-11-26 15:00+01]'::tstzrange

or equally fast (12 ms) by making use of the n-dimensional index:

WHERE track &&&	ST_Collect(
 ST_MakePointM(-180, -90, extract(epoch from '2008-11-26 11:00'::timestamptz)),
 ST_MakePointM(180, 90, extract(epoch from '2008-11-26 15:00'::timestamptz))
)

Spatial filter

Finally, of course, let’s have a look at spatial filters, for example, trajectories that start in a certain area:

WITH my AS ( 
 SELECT ST_Buffer(ST_SetSRID(ST_MakePoint(116.31894,39.97472),4326),0.0005) areaA
), tmp AS (
 SELECT trajectory_id, tracker, min(t) t 
 FROM geolife.trajectory_pt
 GROUP BY trajectory_id, tracker
)
SELECT distinct traj.tracker, traj.trajectory_id 
FROM tmp
JOIN geolife.trajectory_pt traj
ON tmp.trajectory_id = traj.trajectory_id AND traj.t = tmp.t
JOIN my
ON ST_Within(traj.pt, my.areaA)

This point-based query takes 6.0 sec while the shorter trajectory query finishes in 488 ms:

WITH my AS ( 
 SELECT ST_Buffer(ST_SetSRID(ST_MakePoint(116.31894, 39.97472),4326),0.0005) areaA
)
SELECT id, tracker, ST_AsText(track)
FROM geolife.trajectory_ext
JOIN my
ON areaA && track
AND ST_Within(ST_StartPoint(track), areaA)

For more generic “does this trajectory intersect another geometry”, the points can also be aggregated to a linestring on the fly but that takes 21.9 sec:

I’ll be presenting more work on PostGIS trajectories at GI_Forum in Salzburg in July. In the talk, I’ll also have a look at the custom PG-Trajectory datatype. Here’s the full open-access paper:

Graser, A. (2018) Evaluating Spatio-temporal Data Models for Trajectories in PostGIS Databases. GI_Forum ‒ Journal of Geographic Information Science, 1-2018, 16-33. DOI: 10.1553/giscience2018_01_s16.

You can find my fork of the PG-Trajectory project – including all necessary fixes – on Bitbucket.


This post is part of a series. Read more about movement data in GIS.

Optional parameters in QGIS Processing scripts & models

Remember the good old times when all parameters in Processing were mandatory?

Inputs and outputs are fixed, and optional parameters or outputs are not supported. [Graser & Olaya, 2015]

Since QGIS 2.14, this is no longer the case. Scripts, as well as models, can now have optional parameters. Here is how for QGIS 3:

When defining a Processing script parameter, the parameter’s constructor takes a boolean flag indicating whether the parameter should be optional. It’s false by default:

class qgis.core.QgsProcessingParameterNumber(
   name: str, description: str = '', 
   type: QgsProcessingParameterNumber.Type = QgsProcessingParameterNumber.Integer, 
   defaultValue: Any = None, 
   optional: bool = False,
   minValue: float = -DBL_MAX+1, maxValue: float = DBL_MAX)

(Source: http://python.qgis.org/api/core/Processing/QgsProcessingParameterNumber.html)

One standard tool that uses optional parameters is Add autoincremental field:

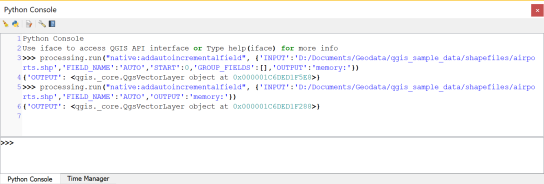
From Python, this algorithm can be called with or without the optional parameters:

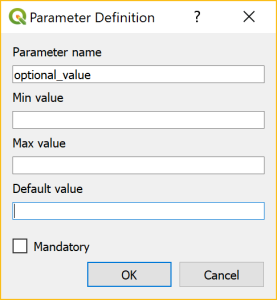
When building a model, an optional input can be assigned to the optional parameter. To create an optional input, make sure to deactivate the mandatory checkbox at the bottom of the input parameter definition:

Then this optional input can be used in an algorithm. For example, here the numerical input optional_value is passed to the Start values at parameter:

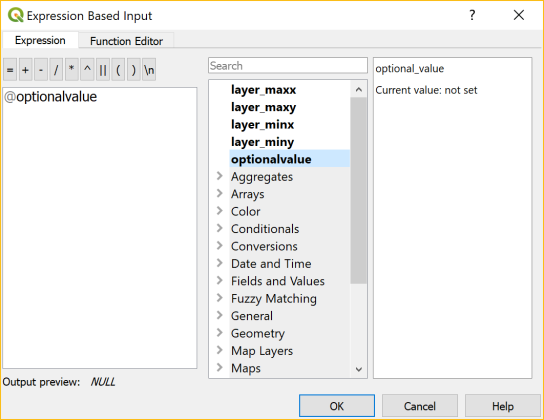
You can get access to all available inputs by clicking the … button next to the Start values at field. In this example, I have access to values of the input layer as well as  the optional value:

Once this is set up, this is how it looks when the model is run:

You can see that the optional value is indeed Not set.

References

Graser, A., & Olaya, V. (2015). Processing: A Python Framework for the Seamless Integration of Geoprocessing Tools in QGIS. ISPRS Int. J. Geo-Inf. 2015, 4, 2219-2245. doi:10.3390/ijgi4042219.

Processing script template for QGIS3

Processing has been overhauled significantly for QGIS 3.0. Besides speed-ups, one of the most obvious changes is the way to write Processing scripts. Instead of the old Processing-specific syntax, Processing scripts for QGIS3 are purely pythonic implementations of QgsProcessingAlgorithm.

Here’s a template that you can use to develop your own algorithms:

from qgis.PyQt.QtCore import QCoreApplication, QVariant
from qgis.core import (QgsField, QgsFeature, QgsFeatureSink, QgsFeatureRequest, QgsProcessing, QgsProcessingAlgorithm, QgsProcessingParameterFeatureSource, QgsProcessingParameterFeatureSink)
                      
class ExAlgo(QgsProcessingAlgorithm):
    INPUT = 'INPUT'
    OUTPUT = 'OUTPUT'

    def __init__(self):
        super().__init__()

    def name(self):
        return "exalgo"
    
    def tr(self, text):
        return QCoreApplication.translate("exalgo", text)
        
    def displayName(self):
        return self.tr("Example script")

    def group(self):
        return self.tr("Examples")

    def groupId(self):
        return "examples"

    def shortHelpString(self):
        return self.tr("Example script without logic")

    def helpUrl(self):
        return "https://qgis.org"
        
    def createInstance(self):
        return type(self)()
  
    def initAlgorithm(self, config=None):
        self.addParameter(QgsProcessingParameterFeatureSource(
            self.INPUT,
            self.tr("Input layer"),
            [QgsProcessing.TypeVectorAnyGeometry]))
        self.addParameter(QgsProcessingParameterFeatureSink(
            self.OUTPUT,
            self.tr("Output layer"),
            QgsProcessing.TypeVectorAnyGeometry))

    def processAlgorithm(self, parameters, context, feedback):
        source = self.parameterAsSource(parameters, self.INPUT, context)
        (sink, dest_id) = self.parameterAsSink(parameters, self.OUTPUT, context,
                                               source.fields(), source.wkbType(), source.sourceCrs())

        features = source.getFeatures(QgsFeatureRequest())
        for feat in features:
            out_feat = QgsFeature()
            out_feat.setGeometry(feat.geometry())
            out_feat.setAttributes(feat.attributes())
            sink.addFeature(out_feat, QgsFeatureSink.FastInsert)

        return {self.OUTPUT: dest_id}

This script just copies the features of the input layer to the output layer without any modifications. Add your logic to the processAlgorithm() function to get started.

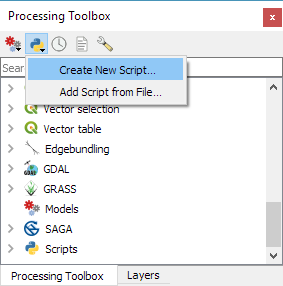
Use Create New Script from the Toolbox toolbar:

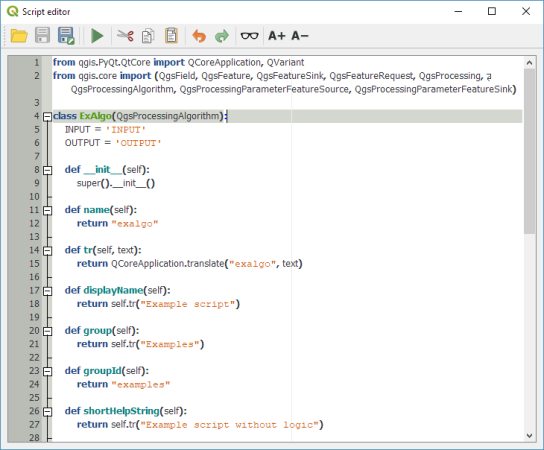
Paste the example script:

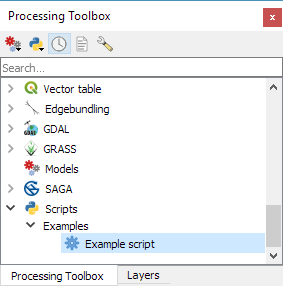
Once saved, the script will show up in the Processing toolbox:

Revisiting point & polygon joins

Joining polygon attributes to points based on their location is a very common GIS task. In QGIS 2, QGIS’ own implementation of “Join attributes by location” was much slower than SAGA’s “Add polygon attributes to points”. Thus, installations without SAGA were out of good options.

Luckily this issue (and many more) has been fixed by the rewrite of many geoprocessing algorithms for QGIS 3! Let’s revisit the comparison:

I’m using publicly available datasets from Naturalearth: The small scale populated places (243 points) and the large scale countries (255 polygons with many nodes). Turns out that QGIS 3’s built-in tool takes a little less than two seconds while the SAGA Processing tool requires a litte less than six seconds:

Like in the previous comparison, times were measured using the Python Console:

In both tools, only the countries’ SOVEREIGNT attribute is joined to the point attribute table:

import processing
t0 = datetime.datetime.now()
print("QGIS Join attributes by location ...")
processing.runAndLoadResults(
   "qgis:joinattributesbylocation", 
   {'INPUT':'E:/Geodata/NaturalEarth/vector_v4/natural_earth_vector/110m_cultural/ne_110m_populated_places.shp',
   'JOIN':'E:/Geodata/NaturalEarth/vector_v4/natural_earth_vector/10m_cultural/ne_10m_admin_0_countries.shp',
   'PREDICATE':[5],'JOIN_FIELDS':['SOVEREIGNT'],
   'METHOD':0,'DISCARD_NONMATCHING':False,'OUTPUT':'memory:'})
t1 = datetime.datetime.now()
print("Runtime: "+str(t1-t0))
print("SAGA Add polygon attributers to points ...")
processing.runAndLoadResults("saga:addpolygonattributestopoints", 
   {'INPUT':'E:/Geodata/NaturalEarth/vector_v4/natural_earth_vector/110m_cultural/ne_110m_populated_places.shp',
   'POLYGONS':'E:/Geodata/NaturalEarth/vector_v4/natural_earth_vector/10m_cultural/ne_10m_admin_0_countries.shp',
   'FIELDS':'SOVEREIGNT','OUTPUT':'C:/Users/anita/AppData/Local/Temp/processing_8b1bbde78de5490285dd530e115cca52/099660d88bf14c54a853cc230e388e55/OUTPUT.shp'})
t2 = datetime.datetime.now()
print("Runtime: "+str(t2-t1))

It is worth noting that it takes longer if more attributes are to be joined to the point layer attribute table. For example, if the JOIN_FIELDS parameter is empty:

'JOIN_FIELDS':[]

instead of

'JOIN_FIELDS':['SOVEREIGNT']

then the the Join attributes by location takes almost 16 seconds. (The country layer contains 71 attributes after all.)

(The SAGA tool currently allows only joining one attribute at a time.)

Resources for QGIS3

The release of 3.0 is really close now. If you want to know what’s new or are just looking for interesting ways to pass the time until the packages land, check out the following QGIS3 resources.

For users

For more recordings from the developer meeting in Madeira check my Youtube playlist.

For developers

If you have further reading recommendations, please post them in the comments below.


TimeManager 2.5 published

TimeManager 2.5 is quite likely going to be the final TimeManager release for the QGIS 2 series. It comes with a couple of bug fixes and enhancements:

  • Fixed #245: updated help.htm
  • Fixed #240: now hiding unmanageable WFS layers
  • Fixed #220: fixed issues with label size
  • Fixed #194: now exposing additional functions: animation_time_frame_size, animation_time_frame_type, animation_start_datetime, animation_end_datetime

Besides updating the help, I also decided to display it more prominently in the settings dialog (similarly to how the help is displayed in the field calculator or in Processing):

So far, I haven’t started porting to QGIS 3 yet. If you are interested in TimeManager and want to help, please get in touch.

On this note, let me leave you with a couple of animation inspirations from the Twitterverse:

Porting Processing scripts to QGIS3

I’ll start with some tech talk first. Feel free to jump to the usage example further down if you are here for the edge bundling plugin.

As you certainly know, QGIS 3 brings a lot of improvements and under-the-hood changes. One of those changes affects all Python scripts. They need to be updated to Python 3 and the new PyQGIS API. (See the official migration guide for details.)

To get ready for the big 3.0 release, I’ve started porting my Processing tools. The edge bundling script is my first candidate for porting to QGIS 3. I also wanted to use this opportunity to “upgrade” from a simple script to a plugin that integrates into Processing.

I used Alexander Bruy’s “prepair for Processing” plugin as a template but you can also find an example template in your Processing folder. (On my system, it is located in C:\OSGeo4W64\apps\qgis-dev\python\plugins\processing\algs\exampleprovider.)

Since I didn’t want to miss the advantages of a good IDE, I set up PyCharm as described by Heikki Vesanto. This will give you code completion for Python 3 and PyQGIS which is very helpful for refactoring and porting. (I also tried Eclipse with PyDev but if you don’t have a favorite IDE yet, I find PyCharm easier to install and configure.)

My PyCharm startup script qgis3_pycharm.bat is a copy of C:\OSGeo4W64\bin\python-qgis-dev.bat with the last line altered to start PyCharm:

@echo off
call "%~dp0\o4w_env.bat"
call qt5_env.bat
call py3_env.bat
@echo off<span data-mce-type="bookmark" style="display: inline-block; width: 0px; overflow: hidden; line-height: 0;" class="mce_SELRES_start"></span>
path %OSGEO4W_ROOT%\apps\qgis-dev\bin;%PATH%
set QGIS_PREFIX_PATH=%OSGEO4W_ROOT:\=/%/apps/qgis-dev
set GDAL_FILENAME_IS_UTF8=YES
rem Set VSI cache to be used as buffer, see #6448
set VSI_CACHE=TRUE
set VSI_CACHE_SIZE=1000000
set QT_PLUGIN_PATH=%OSGEO4W_ROOT%\apps\qgis-dev\qtplugins;%OSGEO4W_ROOT%\apps\qt5\plugins
set PYTHONPATH=%OSGEO4W_ROOT%\apps\qgis-dev\python;%PYTHONPATH%
start /d "C:\Program Files\JetBrains\PyCharm\bin\" pycharm64.exe

In PyCharm File | Settings, I configured the OSGeo4W Python 3.6 interpreter and added qgis-dev and the plugin folder to its path:

With this setup done, we can go back to the code.

I first resolved all occurrences of import * in my script to follow good coding practices. For example:

from qgis.core import *

became

from qgis.core import QgsFeature, QgsPoint, QgsVector, QgsGeometry, QgsField, QGis<span data-mce-type="bookmark" style="display: inline-block; width: 0px; overflow: hidden; line-height: 0;" class="mce_SELRES_start"></span>

in this PR.

I didn’t even run the 2to3 script that is provided to make porting from Python 2 to Python 3 easier. Since the edge bundling code is mostly Numpy, there were almost no changes necessary. The only head scratching moment was when Numpy refused to add a map() return value to an array. So (with the help of Stackoverflow of course) I added a work around to convert the map() return value to an array as well:

flocal_x = map(forcecalcx, subtr_x, subtr_y, distance)
electrostaticforces_x[e_idx, :] += np.array(list(flocal_x))

The biggest change related to Processing is that the VectorWriter has been replaced by a QgsFeatureSink. It’s defined as a parameter of the edgebundling QgsProcessingAlgorithm:

self.addParameter(QgsProcessingParameterFeatureSink(
   self.OUTPUT,
   self.tr("Bundled edges"),
   QgsProcessing.TypeVectorLine)
)

And when the algorithm is run, the sink is filled with the output features:

(sink, dest_id) = self.parameterAsSink(
   parameters, self.OUTPUT, context,
   source.fields(), source.wkbType(), source.sourceCrs()
)

# code that creates features

sink.addFeature(feat, QgsFeatureSink.FastInsert)

The ported plugin is available on Github.

The edge bundling plugin in action

I haven’t uploaded the plugin to the official plugin repository yet, but you can already download if from Github and give it a try:

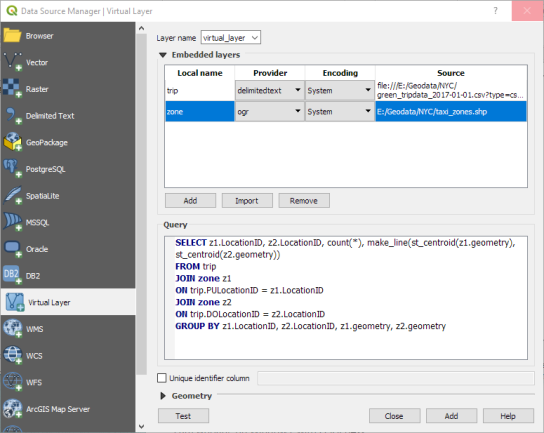
For this example, I’m using taxi pick-up and drop-off data provided by the NYC Taxi & Limousine Commission. I downloaded the January 2017 green taxi data and extracted all trips for the 1st of January. Then I created origin-destination (OD) lines using the QGIS virtual layer feature:

To get an interesting subset of the data, I extracted only those OD flows that cross the East River and have a count of at least 5 taxis:

Now the data is ready for bundling.

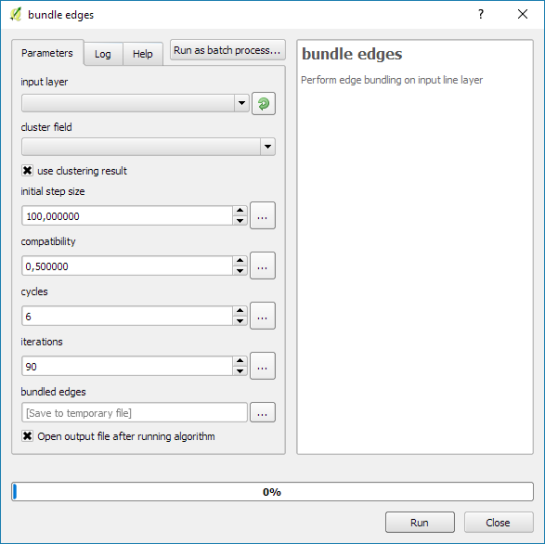
If you have installed the edge bundling plugin, the force-directed edge bundling algorithm should be available in the Processing toolbox. The UI of the edge bundling algorithm looks pretty much the same as it did for the QGIS 2 Processing script:

Since this is a small dataset with only 148 OD flows, the edge bundling processes is pretty quick and we can explore the results:

Beyond this core edge bundling algorithm, the repository also contains two more scripts that still need to be ported. They include dependencies on sklearn, so it will be interesting to see how straightforward it is to convert them.

Creating reports in QGIS

QGIS 3 has a new feature: reports! In short, reports are the good old Altas feature on steroids.

Let’s have a look at an example project:

To start a report, go to Project | New report. The report window is quite similar to what we’ve come to expect from Print Composer (now called Layouts). The most striking difference is the report panel at the left side of the screen.

When a new report is created, the center of the report window is empty. To get started, we need to select the report entry in the panel on the left. By selecting the report entry, we get access to the Include report header and Include report footer checkboxes. For example, pressing the Edit button next to the Include report header option makes it possible to design the front page (or pages) of the report:

Similarly, pressing Edit next to the Include report footer option enables us to design the final pages of our report.

Now for the content! We can populate our report with content by clicking on the plus button to add a report section or a “field group”. A field group is basically an Atlas. For example, here I’ve added a field group that creates one page for each country in the Natural Earth countries layer that I have loaded in my project:

Note that in the right panel you can see that the Controlled by report option is activated for the map item. (This is equivalent to a basic Atlas setup in QGIS 2.x.)

With this setup, we are ready to export our report. Report | Export Report as PDF creates a 257 page document:

As configured, the pages are ordered by country name. This way, for example, Australia ends up on page 17.

Of course, it’s possible to add more details to the individual pages. In this example, I’ve added an overview map in Robinson projection (to illustrate again that it is now possible to mix different CRS on a map).

Happy QGIS mapping!

Freedom of projection in QGIS3

If you have already designed a few maps in QGIS, you are probably aware of a long-standing limitation: Print Composer maps were limited to the project’s coordinate reference system (CRS). It was not possible to have maps with different CRS in a composition.

Note how I’ve been using the past tense? 

Rejoice! QGIS 3 gets rid of this limitation. Print Composer has been replaced by the new Layout dialog which – while very similar at first sight – offers numerous improvements. But today, we’ll focus on projection handling.

For example, this is a simple project using WGS84 as its project CRS:


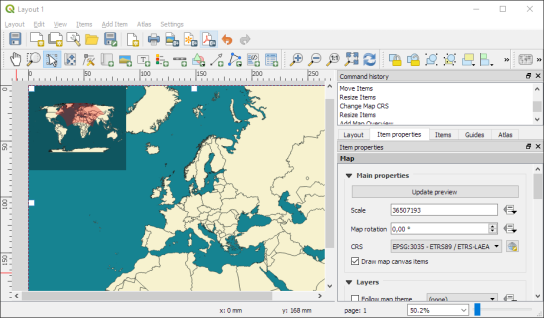
In the Layouts dialog, each map item now has a CRS property. For example, the overview map is set to World_Robinson while the main map is set to ETRS-LAEA:

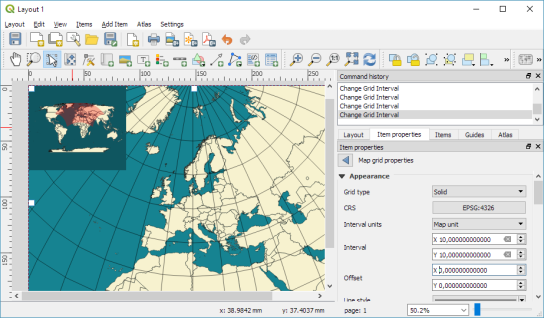
As you can see, the red overview frame in the upper left corner is curved to correctly represent the extent of the main map.

Of course, CRS control is not limited to maps. We also have full freedom to add map grids in yet another CRS:

This opens up a whole new level of map design possibilities.

Bonus fact: Another great improvement related to projections in QGIS3 is that Processing tools are now aware of layers with different CRS and will actively reproject layers. This makes it possible, for example, to intersect two layers with different CRS without any intermediate manual reprojection steps.

Happy QGIS mapping!

Data exploration with Data Plotly for QGIS3

Data Plotly is a new plugin by Matteo Ghetta for QGIS3 which makes it possible to draw D3 graphs of vector layer attribute values. This is a huge step towards making QGIS a one stop shop for data exploration!

Data Plotly adds a new panel where graphs can be configured and viewed. Currently, there are nine different plot types:

The following examples use tree cadastre data from the city of Linz, Austria.

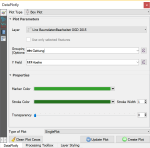
Scatter plots with both two and three variables are supported. After picking the attributes you want to visualize, press “Create plot”.

If you change some settings and press “Create plot” again, by default, the new graph will be plotted on top of the old one. If you don’t want that to happen, press “Clean plot canvas” before creating a new plot.

The plots are interactive and display more information on mouse over, for example, the values of a box plot:

Even aggregate expressions are supported! Here’s the mean height of trees by type (deciduous L or coniferous N):

For more examples, I strongly recommend to have a look at the plugin home page.

Intro to QGIS3 3D view with Viennese building data

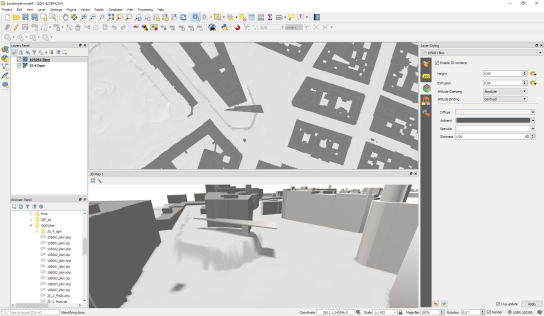
In this post, I want to show how to visualize building block data published by the city of Vienna in 3D using QGIS. This data is interesting due to its level of detail. For example, here you can see the Albertina landmark in the center of Vienna:

an this is the corresponding 3D visualization, including flying roof:

To enable 3D view in QGIS 2.99 (soon to be released as QGIS 3), go to View | New 3D Map View.

Viennese building data (https://www.data.gv.at/katalog/dataset/76c2e577-268f-4a93-bccd-7d5b43b14efd) is provided as Shapefiles. (Saber Razmjooei recently published a similar post using data from New York City in ESRI Multipatch format.) You can download a copy of the Shapefile and a DEM for the same area from my dropbox.  The Shapefile contains the following relevant attributes for 3D visualization

  • O_KOTE: absolute building height measured to the roof gutter(?) (“absolute Gebäudehöhe der Dachtraufe”)
  • U_KOTE: absolute height of the lower edge of the building block if floating above ground (“absolute Überbauungshöhe unten”)
  • HOEHE_DGM: absolute height of the terrain (“absolute Geländehöhe”)
  • T_KOTE: lowest point of the terrain for the given building block (“tiefster Punkt des Geländes auf den Kanten der Gebäudeteilfläche”)

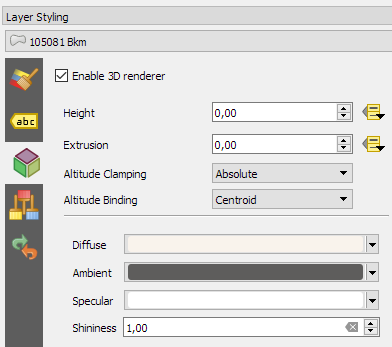
To style the 3D view in QGIS 3, I set height to “U_KOTE” and extrusion to

O_KOTE-coalesce(U_KOTE,0)

both with a default value of 0 which is used if the field or expression is NULL:

The altitude clamping setting defines how height values are interpreted. Absolute clamping is perfect for the Viennese data since all height values are provided as absolute measures from 0. Other options are “relative” and “terrain” which add given elevation values to the underlying terrain elevation. According to the source of qgs3dutils:

  AltClampAbsolute,   //!< Z_final = z_geometry
  AltClampRelative,   //!< Z_final = z_terrain + z_geometry
  AltClampTerrain,    //!< Z_final = z_terrain

The gray colored polygon style shown in the map view on the top creates the illusion of shadows in the 3D view:


Beyond that, this example also features elevation model data which can be configured in the 3D View panel. I found it helpful to increase the terrain tile resolution (for example to 256 px) in order to get more detailed terrain renderings:

Overall, the results look pretty good. There are just a few small glitches in the rendering, as well as in the data. For example, the kiosik in front of Albertina which you can also see in the StreetView image, is lacking height information and therefore we can only see it’s “shadow” in the 3D rendering.

So far, I found 3D rendering performance very good. It works great on my PC with Nvidia graphics card. On my notebook with Intel Iris graphics, I’m unfortunately still experiencing crashes which I hope will be resolved in the future.

Movement data in GIS #11: FOSS4G2017 talk recordings

Many of the topics I’ve covered in recent “Movement data in GIS” posts, have also been discussed at this year’s FOSS4G. Here’s a list of videos for you to learn more about the OGC Moving Features standard, modelling AIS data with FOSS, and more:

1. Introduction to the OGC Moving Features standard presented by Kyoung-Sook Kim from the Artificial Intelligence Research Center, Japan:

Another Perspective View of Cesium for OGC Moving Features from FOSS4G Boston 2017 on Vimeo.

2. Modeling AIS data using GDAL & PostGIS presented by Morten Aronsen from the Norwegian Defence Research Establishment:

Density mapping of ship traffic using FOSS4G in C# .NET from FOSS4G Boston 2017 on Vimeo.

3. 3D visualization of movement data from videos presented by Anna Petrasova from the Center for Geospatial Analysis, North Carolina State University:

Visualization and analysis of active transportation patterns derived from public webcams from FOSS4G Boston 2017 on Vimeo.

There are also a ton of Docker presentations on the FOSS4G2017 Vimeo channel, if you liked “Docker basics with Geodocker GeoServer”.


Read more:

Movement data in GIS #10: open tools for AIS tracks from MarineCadastre.gov

MarineCadastre.gov is a great source for AIS data along the US coast. Their data formats and tools though are less open. Luckily, GDAL – and therefore QGIS – can read ESRI File Geodatabases (.gdb).

MarineCadastre.gov also offer a Track Builder script that creates lines out of the broadcast points. (It can also join additional information from the vessel and voyage layers.) We could reproduce the line creation step using tools such as Processing’s Point to path but this post will show how to create PostGIS trajectories instead.

First, we have to import the points into PostGIS using either DB Manager or Processing’s Import into PostGIS tool:

Then we can create the trajectories. I’ve opted to create a materialized view:

The first part of the query creates a temporary table called ptm (short for PointM). This step adds time stamp information to each point. The second part of the query then aggregates these PointMs into trajectories of type LineStringM.

CREATE MATERIALIZED VIEW ais.trajectory AS
 WITH ptm AS (
   SELECT b.mmsi,
     st_makepointm(
       st_x(b.geom), 
       st_y(b.geom), 
       date_part('epoch', b.basedatetime)
     ) AS pt,
     b.basedatetime t
   FROM ais.broadcast b
   ORDER BY mmsi, basedatetime
 )
 SELECT row_number() OVER () AS id,
   st_makeline(ptm.pt) AS st_makeline,
   ptm.mmsi,
   min(ptm.t) AS min_t,
   max(ptm.t) AS max_t
 FROM ptm
 GROUP BY ptm.mmsi
WITH DATA;

The trajectory start and end times (min_t and max_t) are optional but they can help speed up future queries.

One of the advantages of creating trajectory lines is that they render many times faster than the original points.

Of course, we end up with some artifacts at the border of the dataset extent. (Files are split by UTM zone.) Trajectories connect the last known position before the vessel left the observed area with the position of reentry. This results, for example, in vertical lines which you can see in the bottom left corner of the above screenshot.

With the trajectories ready, we can go ahead and start exploring the dataset. For example, we can visualize trajectory speed and/or create animations:

Purple trajectory segments are slow while green segments are faster

We can also perform trajectory analysis, such as trajectory generalization:

This is a first proof of concept. It would be great to have a script that automatically fetches the datasets for a specified time frame and list of UTM zones and loads them into PostGIS for further processing. In addition, it would be great to also make use of the information in the vessel and voyage tables, thus splitting up trajectories into individual voyages.


Read more:

Movement data in GIS #9: trajectory data models

There are multiple ways to model trajectory data. This post takes a closer look at the OGC® Moving Features Encoding Extension: Simple Comma Separated Values (CSV). This standard has been published in 2015 but I haven’t been able to find any reviews of the standard (in a GIS context or anywhere else).

The following analysis is based on the official OGC trajcectory example at http://docs.opengeospatial.org/is/14-084r2/14-084r2.html#42. The header consists of two lines: the first line provides some meta information while the second defines the CSV columns. The data model is segment based. That is, each line describes a trajectory segment with at least two coordinate pairs (or triplets for 3D trajectories). For each segment, there is a start and an end time which can be specified as absolute or relative (offset) values:

@stboundedby,urn:x-ogc:def:crs:EPSG:6.6:4326,2D,50.23 9.23,50.31 9.27,2012-01-17T12:33:41Z,2012-01-17T12:37:00Z,sec
@columns,mfidref,trajectory,state,xsd:token,”type code”,xsd:integer
a, 10,150,11.0 2.0 12.0 3.0,walking,1
b, 10,190,10.0 2.0 11.0 3.0,walking,2
a,150,190,12.0 3.0 10.0 3.0,walking,2
c, 10,190,12.0 1.0 10.0 2.0 11.0 3.0,vehicle,1

Let’s look at the first data row in detail:

  • a … trajectory id
  • 10 … start time offset from 2012-01-17T12:33:41Z in seconds
  • 150 … end time offset from 2012-01-17T12:33:41Z in seconds
  • 11.0 2.0 12.0 3.0 … trajectory coordinates: x1, y1, x2, y2
  • walking …  state
  • 1… type code

My main issues with this approach are

  1. They missed the chance to use WKT notation to make the CSV easily readable by existing GIS tools.
  2. As far as I can see, the data model requires a regular sampling interval because there is no way to store time stamps for intermediate positions along trajectory segments. (Irregular intervals can be stored using segments for each pair of consecutive locations.)

In the common GIS simple feature data model (which is point-based), the same data would look something like this:

traj_id,x,y,t,state,type_code
a,11.0,2.0,2012-01-17T12:33:51Z,walking,1
a,12.0,3.0,2012-01-17T12:36:11Z,walking,1
a,10.0,3.0,2012-01-17T12:36:51Z,walking,2
b,10.0,2.0,2012-01-17T12:33:51Z,walking,2
b,11.0,3.0,2012-01-17T12:36:51Z,walking,2
c,12.0,1.0,2012-01-17T12:33:51Z,vehicle,1
c,10.0,2.0,2012-01-17T12:35:21Z,vehicle,1
c,11.0,3.0,2012-01-17T12:36:51Z,vehicle,1

The main issue here is that there has to be some application logic that knows how to translate from points to trajectory. For example, trajectory a changes from walking1 to walking2 at 2012-01-17T12:36:11Z but we have to decide whether to store the previous or the following state code for this individual point.

An alternative to the common simple feature model is the PostGIS trajectory data model (which is LineStringM-based). For this data model, we need to convert time stamps to numeric values, e.g. 2012-01-17T12:33:41Z is 1326803621 in Unix time. In this data model, the data looks like this:

traj_id,trajectory,state,type_code
a,LINESTRINGM(11.0 2.0 1326803631, 12.0 3.0 1326803771),walking,1
a,LINESTRINGM(12.0 3.0 1326803771, 10.0 3.0 1326803811),walking,2
b,LINESTRINGM(10.0 2.0 1326803631, 11.0 3.0 1326803811),walking,2
c,LINESTRINGM(12.0 1.0 1326803631, 10.0 2.0 1326803771, 11.0 3.0 1326803811),vehicle,1

This is very similar to the OGC data model, with the notable difference that every position is time-stamped (instead of just having segment start and end times). If one has movement data which is recorded at regular intervals, the OGC data model can be a bit more compact, but if the trajectories are sampled at irregular intervals, each point pair will have to be modeled as a separate segment.

Since the PostGIS data model is flexible, explicit, and comes with existing GIS tool support, it’s my clear favorite.


Read more:

Movement data in GIS extra: trajectory generalization code and sample data

Today’s post is a follow-up of Movement data in GIS #3: visualizing massive trajectory datasets. In that post, I summarized a concept for trajectory generalization. Now, I have published the scripts and sample data in my QGIS-Processing-tools repository on Github.

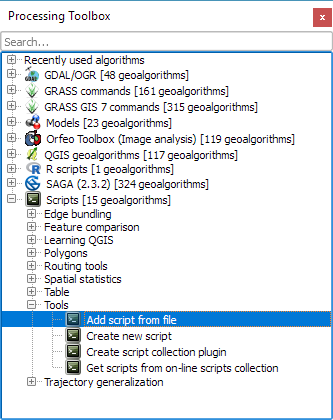
To add the trajectory generalization scripts to your Processing toolbox, you can use the Add scripts from files tool:

It is worth noting, that Add scripts from files fails to correctly import potential help files for the scripts but that’s not an issue this time around, since I haven’t gotten around to actually write help files yet.

The scripts are used in the following order:

  1. Extract characteristic trajectory points
  2. Group points in space
  3. Compute flows between cells from trajectories

The sample project contains input data, as well as output layers of the individual tools. The only required input is a layer of trajectories, where trajectories have to be LINESTRINGM (note the M!) features:

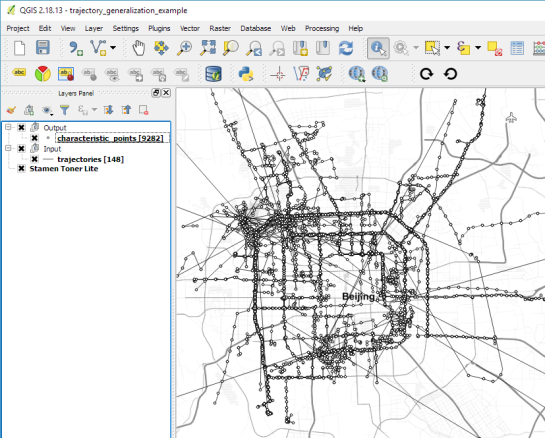
Trajectory sample based on data provided by the GeoLife project

In Extract characteristic trajectory points, distance parameters are specified in meters, stop duration in seconds, and angles in degrees. The characteristic points contain start and end locations, as well as turns and stop locations:

The characteristic points are then clustered. In this tool, the distance has to be specified in layer units, which are degrees in case of the sample data.

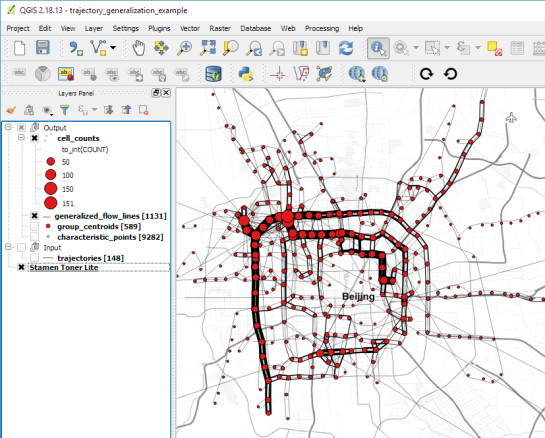
Finally, we can compute flows between cells defined by these clusters:

Flow lines scaled by flow strength and cell centers scaled by counts

If you use these tools on your own data, I’d be happy so see what you come up with!


Read more:

Movement data in GIS #8: edge bundling for flow maps

If you follow this blog, you’ll probably remember that I published a QGIS style for flow maps a while ago. The example showed domestic migration between the nine Austrian states, a rather small dataset. Even so, it required some manual tweaking to make the flow map readable. Even with only 72 edges, the map quickly gets messy:

Raw migration flows between Austrian states, line width scaled by flow strength

One popular approach in the data viz community to deal with this problem is edge bundling. The idea is to reduce visual clutter by generate bundles of similar edges. 

Surprisingly, edge bundling is not available in desktop GIS. Existing implementations in the visual analytics field often run on GPUs because edge bundling is computationally expensive. Nonetheless, we have set out to implement force-directed edge bundling for the QGIS Processing toolbox [0]. The resulting scripts are available at https://github.com/dts-ait/qgis-edge-bundling.

The main procedure consists of two tools: bundle edges and summarize. Bundle edges takes the raw straight lines, and incrementally adds intermediate nodes (called control points) and shifts them according to computed spring and electrostatic forces. If the input are 72 lines, the output again are 72 lines but each line geometry has been bent so that similar lines overlap and form a bundle.

After this edge bundling step, most common implementations compute a line heatmap, that is, for each map pixel, determine the number of lines passing through the pixel. But QGIS does not support line heatmaps and this approach also has issues distinguishing lines that run in opposite directions. We have therefore implemented a summarize tool that computes the local strength of the generated bundles.

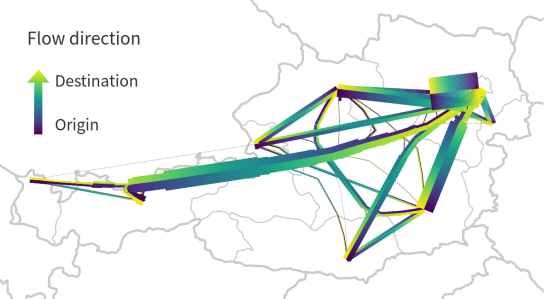
Continuing our previous example, if the input are 72 lines, summarize breaks each line into its individual segments and determines the number of segments from other lines that are part of the same bundle. If a weight field is specified, each line is not just counted once but according to its weight value. The resulting bundle strength can be used to create a line layer style with data-defined line width:

Bundled migration flows

To avoid overlaps of flows in opposing directions, we define a line offset. Finally, summarize also adds a sequence number to the line segments. This sequence number is used to assign a line color on the gradient that indicates flow direction.

I already mentioned that edge bundling is computationally expensive. One reason is that we need to perform pairwise comparison of edges to determine if they are similar and should be bundled. This comparison results in a compatibility matrix and depending on the defined compatibility threshold, different bundles can be generated.

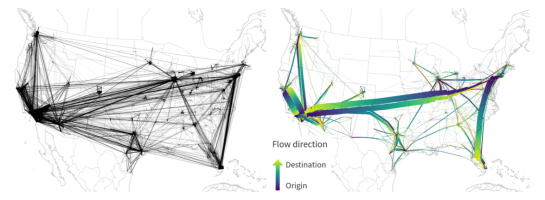
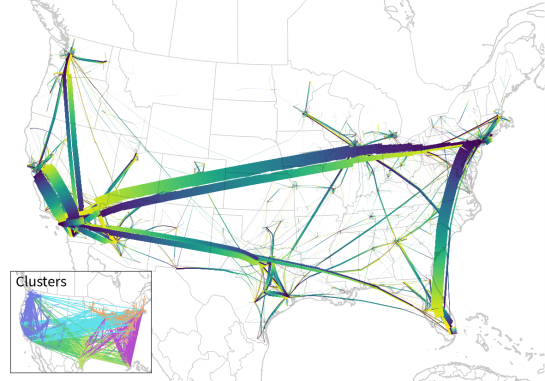
The following U.S. dataset contains around 4000 lines and bundling it takes a considerable amount of time.

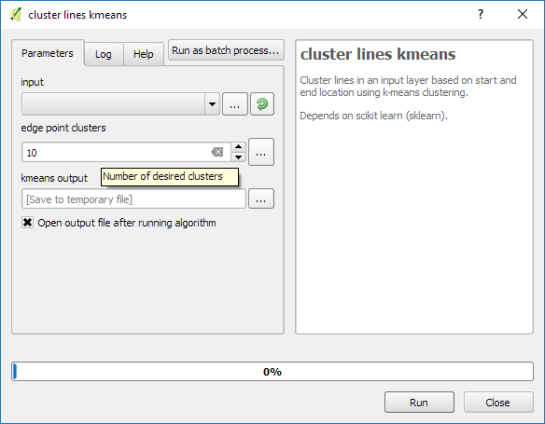
One approach to speed up computations is to first use a quick clustering algorithm and then perform edge bundling on each cluster individually. If done correctly, clustering significantly reduces the size of each compatibility matrix.

In this example, we divided the edges into six clusters before bundling them. If you compare this result to the visualization at the top of this post (which did not use clustering), you’ll see some differences here and there but, overall, the results are quite similar:

Looking at these examples, you’ll probably spot a couple of issues. There are many additional ideas for potential improvements from existing literature which we have not implemented yet. If you are interested in improving these tools, please go ahead! The code and more examples are available on Github.

For more details, leave your email in a comment below and I’ll gladly send you the pre-print of our paper.

[0] Graser, A., Schmidt, J., Roth, F., & Brändle, N. (2017 online) Untangling Origin-Destination Flows in Geographic Information Systems. Information Visualization – Special Issue on Visual Movement Analytics.


Read more:

Drive-time Isochrones from a single Shapefile using QGIS, PostGIS, and Pgrouting

This is a guest post by Chris Kohler .

Introduction:

This guide provides step-by-step instructions to produce drive-time isochrones using a single vector shapefile. The method described here involves building a routing network using a single vector shapefile of your roads data within a Virtual Box. Furthermore, the network is built by creating start and end nodes (source and target nodes) on each road segment. We will use Postgresql, with PostGIS and Pgrouting extensions, as our database. Please consider this type of routing to be fair, regarding accuracy, as the routing algorithms are based off the nodes locations and not specific addresses. I am currently working on an improved workflow to have site address points serve as nodes to optimize results. One of the many benefits of this workflow is no financial cost to produce (outside collecting your roads data). I will provide instructions for creating, and using your virtual machine within this guide.

Steps:–Getting Virtual Box(begin)–

Intro 1. Download/Install Oracle VM(https://www.virtualbox.org/wiki/Downloads)

Intro 2. Start the download/install OSGeo-Live 11(https://live.osgeo.org/en/overview/overview.html).

Pictures used in this workflow will show 10.5, though version 11 can be applied similarly. Make sure you download the version: osgeo-live-11-amd64.iso. If you have trouble finding it, here is the direct link to the download (https://sourceforge.net/projects/osgeo-live/files/10.5/osgeo-live-10.5-amd64.iso/download)
Intro 3. Ready for virtual machine creation: We will utilize the downloaded OSGeo-Live 11 suite with a virtual machine we create to begin our workflow. The steps to create your virtual machine are listed below. Also, here are steps from an earlier workshop with additional details with setting up your virtual machine with osgeo live(http://workshop.pgrouting.org/2.2.10/en/chapters/installation.html).

1.  Create Virutal Machine: In this step we begin creating the virtual machine housing our database.

Open Oracle VM VirtualBox Manager and select “New” located at the top left of the window.

VBstep1

Then fill out name, operating system, memory, etc. to create your first VM.

vbstep1.2

2. Add IDE Controller:  The purpose of this step is to create a placeholder for the osgeo 11 suite to be implemented. In the virtual box main window, right-click your newly-created vm and open the settings.

vbstep2

In the settings window, on the left side select the storage tab.

Find “adds new storage controller button located at the bottom of the tab. Be careful of other buttons labeled “adds new storage attachment”! Select “adds new storage controller button and a drop-down menu will appear. From the top of the drop-down select “Add IDE Controller”.

vbstep2.2

vbstep2.3

You will see a new item appear in the center of the window under the “Storage Tree”.

3.  Add Optical Drive: The osgeo 11 suite will be implemented into the virtual machine via an optical drive. Highlight the new controller IDE you created and select “add optical drive”.

vbstep3

A new window will pop-up and select “Choose Disk”.

vbstep3.2

Locate your downloaded file “osgeo-live 11 amd64.iso” and click open. A new object should appear in the middle window under your new controller displaying “osgeo-live-11.0-amd64.iso”.

vbstep3.3

Finally your virtual machine is ready for use.
Start your new Virtual Box, then wait and follow the onscreen prompts to begin using your virtual machine.
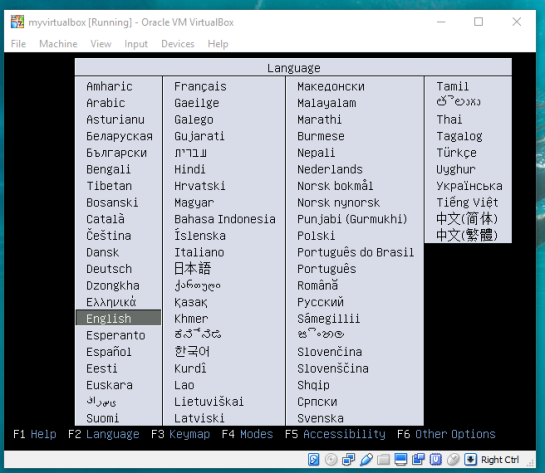
vbstep3.4

–Getting Virtual Box(end)—

4. Creating the routing database, and both extensions (postgis, pgrouting): The database we create and both extensions we add will provide the functions capable of producing isochrones.

To begin, start by opening the command line tool (hold control+left-alt+T) then log in to postgresql by typing “psql -U user;” into the command line and then press Enter. For the purpose of clear instruction I will refer to database name in this guide as “routing”, feel free to choose your own database name. Please input the command, seen in the figure below, to create the database:

CREATE DATABASE routing;

You can use “\c routing” to connect to the database after creation.

step4

The next step after creating and connecting to your new database is to create both extensions. I find it easier to take two-birds-with-one-stone typing “psql -U user routing;” this will simultaneously log you into postgresql and your routing database.

When your logged into your database, apply the commands below to add both extensions

CREATE EXTENSION postgis;
CREATE EXTENSION pgrouting;
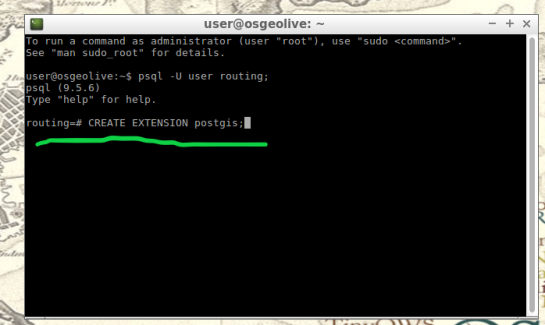
step4.2

step4.3

5. Load shapefile to database: In this next step, the shapefile of your roads data must be placed into your virtual machine and further into your database.

My method is using email to send myself the roads shapefile then download and copy it from within my virtual machines web browser. From the desktop of your Virtual Machine, open the folder named “Databases” and select the application “shape2pgsql”.

step5

Follow the UI of shp2pgsql to connect to your routing database you created in Step 4.

step5.2

Next, select “Add File” and find your roads shapefile (in this guide we will call our shapefile “roads_table”) you want to use for your isochrones and click Open.

step5.3

Finally, click “Import” to place your shapefile into your routing database.

6. Add source & target columns: The purpose of this step is to create columns which will serve as placeholders for our nodes data we create later.

There are multiple ways to add these columns into the roads_table. The most important part of this step is which table you choose to edit, the names of the columns you create, and the format of the columns. Take time to ensure the source & target columns are integer format. Below are the commands used in your command line for these functions.

ALTER TABLE roads_table ADD COLUMN "source" integer;
ALTER TABLE roads_table ADD COLUMN "target" integer;

step6

step6.2

7. Create topology: Next, we will use a function to attach a node to each end of every road segment in the roads_table. The function in this step will create these nodes. These newly-created nodes will be stored in the source and target columns we created earlier in step 6.

As well as creating nodes, this function will also create a new table which will contain all these nodes. The suffix “_vertices_pgr” is added to the name of your shapefile to create this new table. For example, using our guide’s shapefile name , “roads_table”, the nodes table will be named accordingly: roads_table_vertices_pgr. However, we will not use the new table created from this function (roads_table_vertices_pgr). Below is the function, and a second simplified version, to be used in the command line for populating our source and target columns, in other words creating our network topology. Note the input format, the “geom” column in my case was called “the_geom” within my shapefile:

pgr_createTopology('roads_table', 0.001, 'geom', 'id',
 'source', 'target', rows_where := 'true', clean := f)

step7

Here is a direct link for more information on this function: http://docs.pgrouting.org/2.3/en/src/topology/doc/pgr_createTopology.html#pgr-create-topology

Below is an example(simplified) function for my roads shapefile:

SELECT pgr_createTopology('roads_table', 0.001, 'the_geom', 'id')

8. Create a second nodes table: A second nodes table will be created for later use. This second node table will contain the node data generated from pgr_createtopology function and be named “node”. Below is the command function for this process. Fill in your appropriate source and target fields following the manner seen in the command below, as well as your shapefile name.

To begin, find the folder on the Virtual Machines desktop named “Databases” and open the program “pgAdmin lll” located within.

step8

Connect to your routing database in pgAdmin window. Then highlight your routing database, and find “SQL” tool at the top of the pgAdmin window. The tool resembles a small magnifying glass.
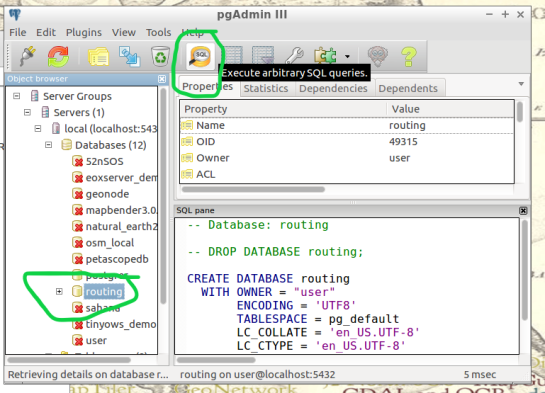
step8.2

We input the below function into the SQL window of pgAdmin. Feel free to refer to this link for further information: (https://anitagraser.com/2011/02/07/a-beginners-guide-to-pgrouting/)

CREATE TABLE node AS
   SELECT row_number() OVER (ORDER BY foo.p)::integer AS id,
          foo.p AS the_geom
   FROM (     
      SELECT DISTINCT roads_table.source AS p FROM roads_table
      UNION
      SELECT DISTINCT roads_table.target AS p FROM roads_table
   ) foo
   GROUP BY foo.p;

step8.3

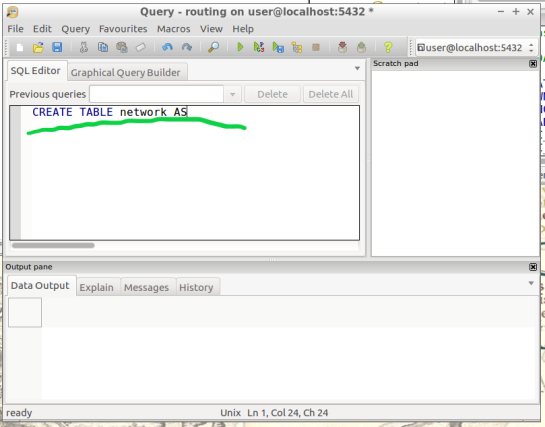
  1.  Create a routable network: After creating the second node table from step 8,  we will combine this node table(node) with our shapefile(roads_table) into one, new, table(network) that will be used as the routing network. This table will be called “network” and will be capable of processing routing queries.  Please input this command and execute in SQL pgAdmin tool as we did in step 8. Here is a reference for more information:(https://anitagraser.com/2011/02/07/a-beginners-guide-to-pgrouting/)   

step8.2


CREATE TABLE network AS
   SELECT a.*, b.id as start_id, c.id as end_id
   FROM roads_table AS a
      JOIN node AS b ON a.source = b.the_geom
      JOIN node AS c ON a.target = c.the_geom;
step9.2

10. Create a “noded” view of the network:  This new view will later be used to calculate the visual isochrones in later steps. Input this command and execute in SQL pgAdmin tool.

CREATE OR REPLACE VIEW network_nodes AS 
SELECT foo.id,
 st_centroid(st_collect(foo.pt)) AS geom 
FROM ( 
  SELECT network.source AS id,
         st_geometryn (st_multi(network.geom),1) AS pt 
  FROM network
  UNION 
  SELECT network.target AS id, 
         st_boundary(st_multi(network.geom)) AS pt 
  FROM network) foo 
GROUP BY foo.id;

step10

11.​ Add column for speed:​ This step may, or may not, apply if your original shapefile contained a field of values for road speeds.

In reality a network of roads will typically contain multiple speed limits. The shapefile you choose may have a speed field, otherwise the discrimination for the following steps will not allow varying speeds to be applied to your routing network respectfully.

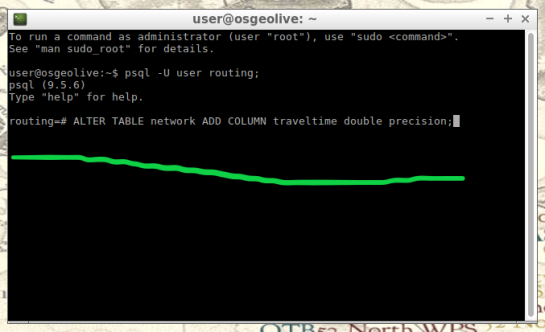
If values of speed exists in your shapefile we will implement these values into a new field, “traveltime“, that will show rate of travel for every road segment in our network based off their geometry. Firstly, we will need to create a column to store individual traveling speeds. The name of our column will be “traveltime” using the format: ​double precision.​ Input this command and execute in the command line tool as seen below.

ALTER TABLE network ADD COLUMN traveltime double precision;
step11

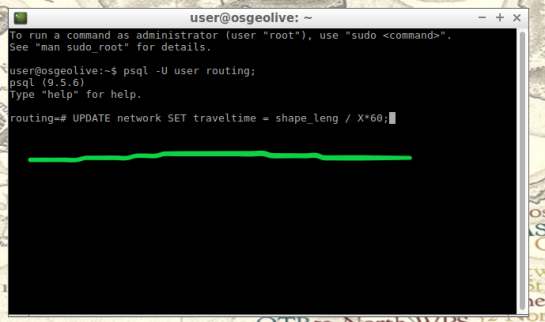
Next, we will populate the new column “traveltime” by calculating traveling speeds using an equation. This equation will take each road segments geometry(shape_leng) and divide by the rate of travel(either mph or kph). The sample command I’m using below utilizes mph as the rate while our geometry(shape_leng) units for my roads_table is in feet​. If you are using either mph or kph, input this command and execute in SQL pgAdmin tool. Below further details explain the variable “X”.

UPDATE network SET traveltime = shape_leng / X*60
step11.2

How to find X​, ​here is an example​: Using example 30 mph as rate. To find X, we convert 30 miles to feet, we know 5280 ft = 1 mile, so we multiply 30 by 5280 and this gives us 158400 ft. Our rate has been converted from 30 miles per hour to 158400 feet per hour. For a rate of 30 mph, our equation for the field “traveltime”  equates to “shape_leng / 158400*60″. To discriminate this calculations output, we will insert additional details such as “where speed = 30;”. What this additional detail does is apply our calculated output to features with a “30” value in our “speed” field. Note: your “speed” field may be named differently.

UPDATE network SET traveltime = shape_leng / 158400*60 where speed = 30;

Repeat this step for each speed value in your shapefile examples:

UPDATE network SET traveltime = shape_leng / X*60 where speed = 45;
UPDATE network SET traveltime = shape_leng / X*60 where speed = 55;

The back end is done. Great Job!

Our next step will be visualizing our data in QGIS. Open and connect QGIS to your routing database by right-clicking “PostGIS” in the Browser Panel within QGIS main window. Confirm the checkbox “Also list tables with no geometry” is checked to allow you to see the interior of your database more clearly. Fill out the name or your routing database and click “OK”.

If done correctly, from QGIS you will have access to tables and views created in your routing database. Feel free to visualize your network by drag-and-drop the network table into your QGIS Layers Panel. From here you can use the identify tool to select each road segment, and see the source and target nodes contained within that road segment. The node you choose will be used in the next step to create the views of drive-time.

12.Create views​: In this step, we create views from a function designed to determine the travel time cost. Transforming these views with tools will visualize the travel time costs as isochrones.

The command below will be how you start querying your database to create drive-time isochrones. Begin in QGIS by draging your network table into the contents. The visual will show your network as vector(lines). Simply select the road segment closest to your point of interest you would like to build your isochrone around. Then identify the road segment using the identify tool and locate the source and target fields.

step12

step12.2

Place the source or target field value in the below command where you see ​VALUE​, in all caps​.

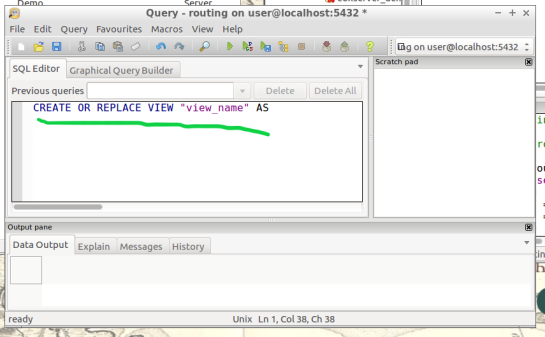
This will serve you now as an isochrone catchment function for this workflow. Please feel free to use this command repeatedly for creating new isochrones by substituting the source value. Please input this command and execute in SQL pgAdmin tool.

*AT THE BOTTOM OF THIS WORKFLOW I PROVIDED AN EXAMPLE USING SOURCE VALUE “2022”

CREATE OR REPLACE VIEW "​view_name" AS 
SELECT di.seq, 
       di.id1, 
       di.id2, 
       di.cost, 
       pt.id, 
       pt.geom 
FROM pgr_drivingdistance('SELECT
     gid::integer AS id, 
     Source::integer AS source, 
     Target::integer AS target,                                    
     Traveltime::double precision AS cost 
       FROM network'::text, ​VALUE::bigint, 
    100000::double precision, false, false)
    di(seq, id1, id2, cost)
JOIN network_nodes pt ON di.id1 = pt.id;
step12.3

13.Visualize Isochrone: Applying tools to the view will allow us to adjust the visual aspect to a more suitable isochrone overlay.

​After creating your view, a new item in your routing database is created, using the “view_name” you chose. Drag-and-drop this item into your QGIS LayersPanel. You will see lots of small dots which represent the nodes.

In the figure below, I named my view “take1“.

step13

Each node you see contains a drive-time value, “cost”, which represents the time used to travel from the node you input in step 12’s function.
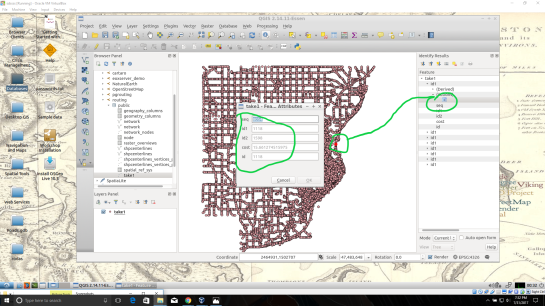
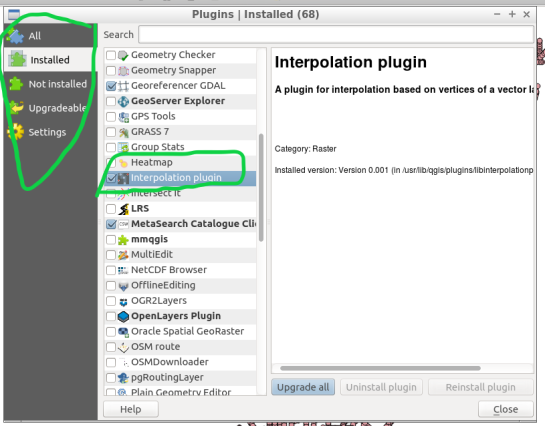
step13.2

Start by installing the QGIS plug-in Interpolation” by opening the Plugin Manager in QGIS interface.
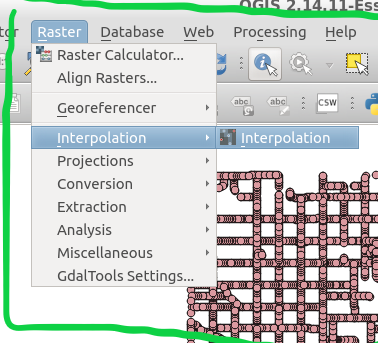
step13.3

Next, at the top of QGIS window select “Raster” and a drop-down will appear, select “Interpolation”.
step13.4


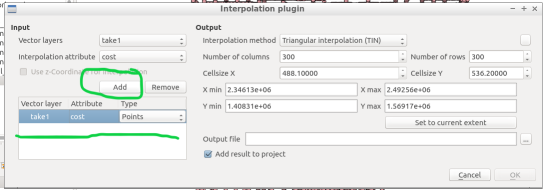
A new window pops up and asks you for input.

step13.5

Select your “​view”​ as the​ vector layer​, select ​”cost​” as your ​interpolation attribute​, and then click “Add”.

step13.6

A new vector layer will show up in the bottom of the window, take care the type is Points. For output, on the other half of the window, keep the interpolation method as “TIN”, edit the ​output file​ location and name. Check the box “​Add result to project​”.

Note: decreasing the cellsize of X and Y will increase the resolution but at the cost of performance.

Click “OK” on the bottom right of the window.

step13.7

A black and white raster will appear in QGIS, also in the Layers Panel a new item was created.
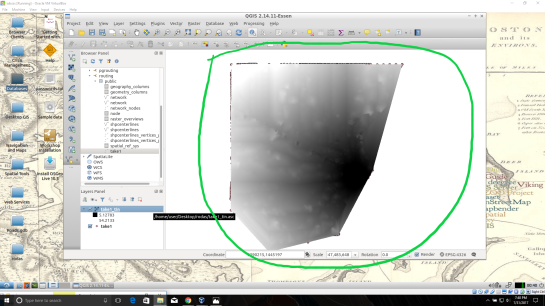
step13.8

Take some time to visualize the raster by coloring and adjusting values in symbology until you are comfortable with the look.

step13.9

step13.10

14. ​Create contours of our isochrone:​ Contours can be calculated from the isochrone as well.

Find near the top of QGIS window, open the “Raster” menu drop-down and select Extraction → Contour.

step14

Fill out the appropriate interval between contour lines but leave the check box “Attribute name” unchecked. Click “OK”.

step14.2

step14.3

15.​ Zip and Share:​ Find where you saved your TIN and contours, compress them in a zip folder by highlighting them both and right-click to select “compress”. Email the compressed folder to yourself to export out of your virtual machine.

Example Isochrone catchment for this workflow:

CREATE OR REPLACE VIEW "2022" AS 
SELECT di.seq, Di.id1, Di.id2, Di.cost,                           
       Pt.id, Pt.geom 
FROM pgr_drivingdistance('SELECT gid::integer AS id,                                       
     Source::integer AS source, Target::integer AS target, 
     Traveltime::double precision AS cost FROM network'::text, 
     2022::bigint, 100000::double precision, false, false) 
   di(seq, id1, id2, cost) 
JOIN netowrk_nodes pt 
ON di.id1 = pt.id;

References: Virtual Box ORACLE VM, OSGeo-Live 11  amd64 iso, Workshop FOSS4G Bonn(​http://workshop.pgrouting.org/2.2.10/en/index.html​),
Back to Top

Sustaining Members