Related Plugins and Tags

QGIS Planet

Mapping Hubway Station Stats

Today, I’ve been working on some station statistics. From the trip data, I calculated incoming and outgoing trips per station as well as the station’s first day of operations. Combining this information makes it possible to calculate the average day’s “bike balance”. A balanced station has the same number of incoming and outgoing trips while an unbalanced station will either run out of bikes or empty slots for returns.

I’ve published the resulting station map on QGIS Cloud (http://qgiscloud.com/anitagraser/hubway_cloud1) where you can have a look at the bike balance values.

Additionally, I’ve created a mashup in Leaflet pulling together background tiles from Stamen and the cloud-hosted WMS for better orientation:


Exploring Hubway’s Data II

Today, I’ve been experimenting with a new way to visualize origin-destination pairs (ODs). The following image shows my first results:

The ideas was to add a notion of direction as well as uncertainty. The “flower petals” have a pointed origin and grow wider towards the middle. (Looking at the final result, they should probably go much narrower towards the end again.) The area covered by the petals is a simple approximation of where I’d expect the bike routes without performing any routing.

To get there, I reprojected the connection lines to EPSG:3857 and calculated connection length and line orientation using QGIS Field Calculator $length operator and the bearing formula given in QGIS Wiki:

(atan((xat(-1)-xat(0))/(yat(-1)-yat(0)))) * 180/3.14159 + (180 *(((yat(-1)-yat(0)) < 0) + (((xat(-1)-xat(0)) < 0 AND (yat(-1) - yat(0)) >0)*2)))

For the style, I created a new “flower petal” SVG symbol in Inkscape and styled it with varying transparency values: Rare connections are more transparent than popular ones. This style is applied to the connection start points. Using the advanced options “size scale” and “rotation”, it is possible to rotate the petals into the right direction as well as scale them using the previously calculated values for connection length and orientation.

Update

While the above example uses pretty wide petals this one is done with a much narrower petal. I think it’s more appropriate for the data at hand:

Most of the connections are clearly heading south east, across Charles River, except for that group of connections pointing the opposite direction, to Harvard Square.


Exploring Hubway’s Data I

Hubway is a bike sharing system in Boston and they are currently hosting a data visualization challenge. What a great chance to play with some real-world data!

To get started, I loaded both station Shapefile and trip CSV into a new Spatialite database. The GUI is really helpful here – everything is done in a few clicks. Afterwards, I decided to look into which station combinations are most popular. The following SQL script creates my connections table:

create table connections (
start_station_id INTEGER,
end_station_id INTEGER,
count INTEGER,
Geometry GEOMETRY);


insert into connections select 
start_station_id, 
end_station_id, 
count(*) as count, 
LineFromText('LINESTRING('||X(a.Geometry)||' '||Y(a.Geometry)||','
                          ||X(b.Geometry)||' '||Y(b.Geometry)||')') as Geometry
 from trips, stations a, stations b
where start_station_id = a.ID 
and end_station_id = b.ID
and a.ID != b.ID
and a.ID is not NULL
and b.ID is not NULL
group by start_station_id, end_station_id;

(Note: This is for Spatialite 2.4, so there is no MakeLine() method. Use MakeLine if you are using 3.0.)

For a first impression, I decided to map popular connections with more than one hundred entries. Wider lines mean more entries. The points show the station locations and they are color coded by starting letter. (I’m not yet sure if they mean anything. They seem to form groups.)

Some of the stations don’t seem to have any strong connections at all. Others are rather busy. The city center and the dark blue axis pointing west seem most popular.

I’m really looking forward to what everyone else will be finding in this dataset.


Exploring Mobility Data Using Time Manager

Data from various vehicles is collected for many purposes in cities worldwide. To get a feeling for just how much data is available, I created the following video using QGIS Time Manager which has been shown at the Austrian Museum of Applied Arts “MADE 4 YOU – Design for Change”. It shows one hour of taxi tracks in the city of Vienna:

If you like the video, please go to http://www.ertico.com/2012-its-video-competition-open-vote and vote for it in the category “Videos directed at the general public”.


3 Reasons to Move Your QGIS Plugins to the New Repository

  1. Since the release of QGIS 1.8, Plugin Installer no longer includes the “add 3rd party repositories” button. This was an intentional design choice!
  2. The new official plugin repository at plugins.qgis.org keeps everything in one place making it easier for users to find documentation and report issues. It will also provide many long-wanted features such as a rating system for plugins. You can already sort by number of downloads to discover the most popular plugins.
  3. Last but not least: New users will not be able to discover your plugin if it is not in the repository.

Go ahead to plugins.qgis.org and upload your plugin now!


Introducing the Latest Style User Interface Improvements

Yesterday, Martin Dobias announced that Arun’s GSoC work on QGIS symbology has been merged into the developer version. So let’s have a look at todays nightly-build!

I’ll step through the features mentioned in the announcement to see how they look and work:

1. Style manager has been greatly improved: grouping of symbols, tagging, “smart” groups (showing only symbols matching some criteria), search

On opening new Style Manager, we can already see that it has changed considerably: There are groups on the left, tags at the bottom and a search field in the upper right corner.

new Style Manager

New groups are created with the “+” button and styles can be added using the context menu:

adding a style to a group

2. Symbol selector and properties dialogs have been integrated to just one dialog, improving the usability a lot

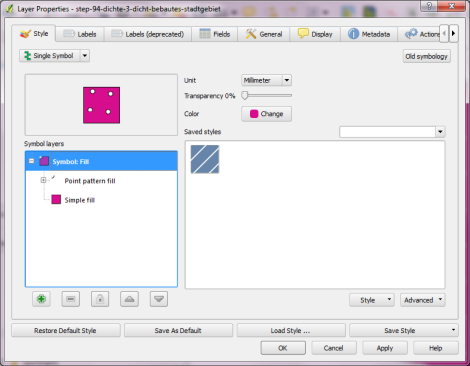
Instead of opening tons of nested windows, complex styles can now be easily edited using the symbol layer tree on the left:

new Properties window

3. Style database is now stored in a SQLite database rather than an XML file for better scalability. You can import all your saved symbols and color ramps from ~/.qgis/symbology-ng-style.xml – from now they will be stored in ~/.qgis/symbology-ng-style.db.

Importing through Style Manager works like a charm. All styles will be imported into the given group.

importing previous style.xml

4. Style import improvements: load style directly from given URL, saving imported symbols into a group

Instead of giving a path to a style XML, it’s also possible to specify a URL. That’s a great step towards shared symbol libraries!

5. SVG fill: shows directories for easier traversal through the SVG directories

Definitely a plus! It’s now much easier to work with big SVG symbol collections.

What a great result of this year’s Google Summer of Code for QGIS. Give these new features a try! I already fell in love with them.


Stamen Maps for QGIS

Stamen’s maps are amongst the most creative and beautiful OpenStreetMap visualizations and it would be great to have them as base maps in QGIS.

No problem! Nathaniel Kelso has already done all the work for us and we can download the extended OpenLayers plugin from his Github page. (There is a pull request in place to add Stamen to the default plugin too.)

Simply unpack the plugin into QGIS’ plugin folder. As you can see in the following screen shot, I’ve put it besides the “original” OpenLayers 0.6.2 plugin. In QGIS plugin manager, I then switched to Nathaniel’s version.

It adds the possibility to load Stamen’s Watercolor, Toner and Terrain tiles into the QGIS project:

Like all other OpenLayers layers, these can now be overlaid with more data such as this heatmap which is based on Twitter data I presented in a previous post, processed using Heatmap plugin and semi-transparently overlaid onto Stamen’s Toner map:


Physical Maps on QGIS Cloud

QGIS Cloud is a great cloud hosting service for QGIS Server by Sourcepole. After online registration and installation of an (experimental) plugin, QGIS projects can be uploaded to the cloud quite comfortably.

For a quick test, I tried to recreate the map from “Open Data for Physical Maps”. Right now, one of the limitations is that raster layers cannot be uploaded. Instead of the SRTM data, I therefore chose OCM landscape from OpenLayers plugin to provide some hillshade. The process of uploading data and publishing the project went smoothly and I didn’t encounter any problems.

You can explore the map online at qgiscloud.com/anitagraser/corine_austria.

Considering the complexity of the Corine dataset, rendering is quite fast – certainly much better than on my notebook.


Open Data for Physical Maps

Corine Land Cover is a European program to create a land cover inventory of Europe. The data is freely available and a valuable input for many analyses. In this post, we’ll be using it to create a physical map.

For the background, reused the hillshade presented in “Mapping Open Data With Open GIS”

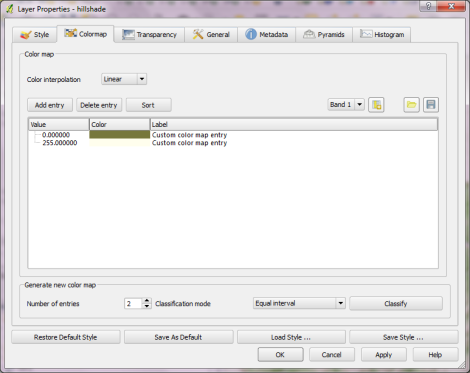
Instead of the standard grayscale, I defined a sand-colored colormap that looks warmer and more natural:

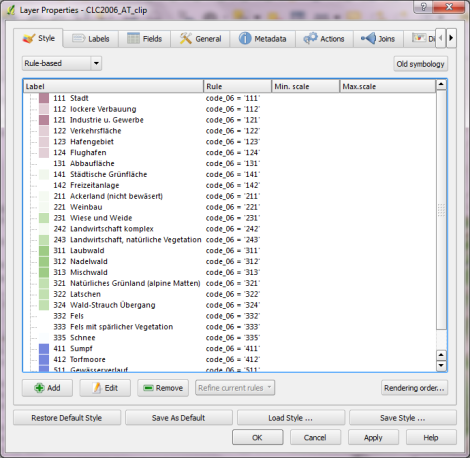
On top of this hillshade, I put the Corine land cover layer. Instead of the official, rather bright colors I selected a more neutral color palette and varying transparency values: Water areas are drawn with no transparency while forests are set to 50 % and built-up areas to up to 80 % transparency. I also skipped classes such as “bare rock” by setting them to be totally transparent:

On top of the land cover, I added a river dataset and styled it with the same color used for water surfaces in the Corine layer. Obviously, this is an optional step. Big rivers are visible within the land cover data too.

After adding a mask and labels, the map is ready to add the finishing touches in Print Composer: Title, explanatory text and a scale bar. I decided against adding a legend to this particular map since I hope that the color choices are intuitive enough.

If you want to create your own physical map, you can use Corine Land Cover for European regions or the National Vegetation Classification in the U.S.


A Rainbow Gradient for QGIS Vectors

Here’s a rainbow gradient for use with QGIS “Categorized” or “Graduated” vector renderer:

<!DOCTYPE qgis_style>
<qgis_style version="0">
  <symbols/>
  <colorramps>
    <colorramp type="gradient" name="rainbow">
      <prop k="color1" v="250,8,8,255"/>
      <prop k="color2" v="92,11,122,255"/>
      <prop k="stops" v="0.3;237,244,25,255:0.5;46,155,45,255:0.66;29,18,122,255:0.82;152,6,130,255"/>
    </colorramp>
  </colorramps>
</qgis_style>

(Save as .xml and import using QGIS Style Manager.)

I’ll put it on my QGIS Resources Github repository too. Soon.


Mapping Open Data With Open GIS

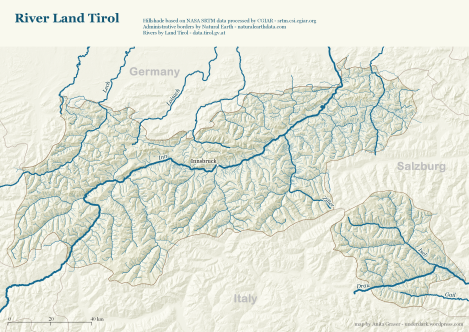
This post explores some cartographic features of QGIS while mapping the river network of Tirol, Austria. All data used is freely available.

For the background, I downloaded NASA SRTM elevation data from CGIAR-CSI and created a hillshade using Terrain Analysis tools in QGIS 1.8.

To emphasize both state borders and the fact that Tirol consists of two separate areas, I created a mask using the Difference tool and styled it a transparent white.

The river network is too dense to label all rivers on an A4 map. Expression-based labels make it possible to only label selected features. For this dataset, the expression limits labeling to features with certain values of GEW_WRRL attribute:

CASE WHEN (GEW_WRRL = '10.000 km2 Fluss' OR "GEW_WRRL"= '4.000 km2 Fluss' OR "GEW_WRRL"='1.000 km2 Fluss') AND length("GEW_NAME_A") < 10 THEN "GEW_NAME_A" END

Labels of neighboring areas together with map title, descriptions and scale bar were added in Print Composer.

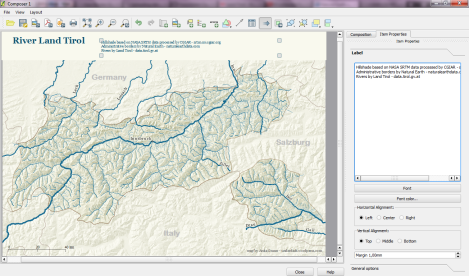
Working with Print Composer, it is useful to know that you can use Copy&Paste to duplicate map components and right-click to lock them from being moved. Also, every new component by default comes with a black outline and white background which can (and should) be disabled/changed in “General options”.

This is the final QGIS Print Composer output – without any further post-processing in Inkscape or Gimp:


SLD Support and other QGIS 1.8 Style Features

The upcoming 1.8 release contains many new features for handling layer styles.

Copy-paste Styles

Very handy new entries in the layer list context menu: “Copy Style” and “Paste Style” make copying layer styles really fast. You don’t even have to open layer properties anymore.

SLD Support

Besides the classic QML layer style files, QGIS 1.8 supports the SLD standard. SLDs can be exported from and imported into new symbology.

One thing worth to note: SLDs can be exported from any type of renderer: single symbol, categorized, graduated or rule-based, but when importing an SLD, either a single symbol or rule-based renderer is created.

That means that categorized or graduated styles are converted to rule-based. If you want to preserve those renderers, you have to stick to the QML format. On the other hand, it could be very handy sometimes to have this easy way of converting styles to rule-based.

Symbol Levels

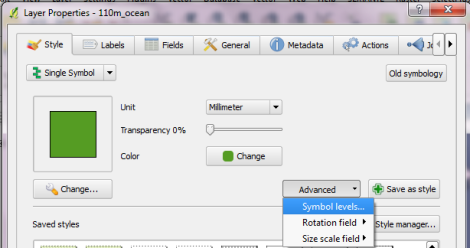
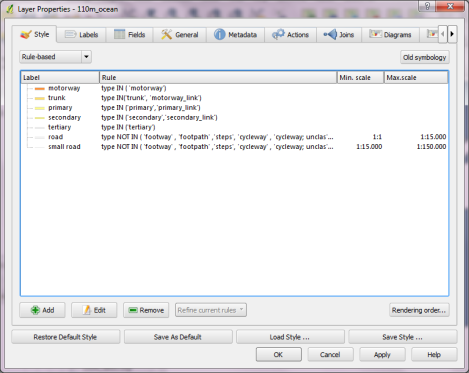
If you are looking for the “Symbol level” settings, they have been moved to the “Advanced” button:

Rule-based Renderer

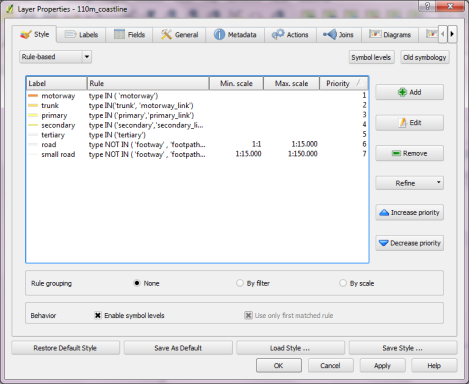
The rule-based renderer GUI got a major face-lift. Just compare the 1.7 version

Rule-based renderer GUI in 1.7

to the new clean 1.8 version:

Rule-based renderer in 1.8

Grouping of styles has been overhauled too: Using drag-and-drop, layers can be arranged into groups in a more flexible manner than previously possible.

There is also a new context menu which enables workflows such as changing the transparency of multiple symbols at once:

Symbol levels for the rule-based renderer can now be accessed via “Rendering order”.

It’s obvious that a lot of work has been put into style handling since the 1.7 release and these improvements are just a small fraction of what’s been done to get closer to the big goal: releasing 2.0.


Glowing Hot Maps – QGIS Meets Gimp

Waiting time is over, Gimp 2.8 is finally here. That is reason enough to take it for a quick test run!

How about a new look for the QGIS user map?

This “glowing hot” map was made using the Gimp filter of the same name:

For the user point layer, I selected a simple point style with high transparency and separately exported land and user points from print composer.

user points as exported from QGIS

In Gimp, I applied the “glowing hot” filter to the user points and combined the layers. The trick here is to first use “Color to alpha” on the user point layer and turn black to transparent. This way, the “glowing hot” filter will only be applied to the remaining points.

Gimp 2.8 RC1 is close enough to the previous version to get comfortable fast. I like the single-window mode even if it’s hard to tell which part of the GUI has the focus sometimes.

Open source GIS and image editing for a perfect work flow.


Loading Zipped Files Directly into QGIS

Today’s hot topic on the mailing list was a recently added feature which enables QGIS to load data directly from ZIP archives.

To get the contents of a ZIP archive display in the browser dock, it is necessary to activate this feature in the Options dialog. The setting is called “Scan for contents of compressed files (.zip) in browser dock” and is located right at the bottom of the first tab. Both “basic scan” and “full scan” settings seem to work fine:

Settings – Options

In the file browser panel, archives are now listed like any other folder and their content can be added to the map through both double click and drag and drop.

This can help save tons of disk space: The NaturalEarthData.zip in this example is 280 MB big while the unzipped folders take more than 700 MB.


QGIS Server on Ubuntu Step-by-step

This post summarizes my notes about installing QGIS Server on Ubuntu, adding a QGIS project file to the server and using the WMS in an OpenLayers application.

Installation

First, it’s useful to figure out the Ubuntu version:

lsb_release -a

Since my server runs “lucid”, I add the following package sources to /etc/apt/sources.list (as described in the QGIS installation documentation)

deb http://qgis.org/debian lucid main
deb-src http://qgis.org/debian lucid main

Before we can install anything, we need to add the key and update the package list

gpg --keyserver keyserver.ubuntu.com --recv 1F9ADD375CA44993
gpg --export --armor 1F9ADD375CA44993 | sudo apt-key add -
sudo apt-get update

Now we can install QGIS Server and the necessary Apache package

sudo apt-get install qgis-mapserver libapache2-mod-fcgid

It never hurts to restart Apache :)

sudo /etc/init.d/apache2 restart

Let’s test the installation before we proceed. The GetCapabilities request should already work

http://10.101.21.28/cgi-bin/qgis_mapserv.fcgi?SERVICE=WMS&VERSION=1.3.0&REQUEST=GetCapabilities

Adding a QGIS project file

It’s time to add a QGIS project to our server. To do that, we move to the QGIS Server folder

cd /usr/lib/cgi-bin

where you should find qgis_mapserv.fcgi and wms_metadata.xml.
I’ve decided to have one folder for each project file. My first project is “vienna”.

sudo mkdir vienna
cd vienna

qgis_mapserv.fcgi and wms_metadata.xml can now be linked into this new folder

sudo ln -s ../qgis_mapserv.fcgi .
sudo ln -s ../wms_metadata.xml .

The only thing that’s missing anymore is a QGIS project file. It can be copied or linked into the folder. After restarting Apache, we should be good to go.

Let’s test the setup using “Add WMS Layer” in QGIS by adding the service URL such as

http://10.101.21.28/cgi-bin/vienna/qgis_mapserv.fcgi

and ticking “Ignore GetMap URI …” and “Ignore GetFeature URI …”.

After clicking “Connect”, all layers from the project file we added should get listed and we can select and load them.

QGIS Server can serve as many project files as you want. There a different ways to organize your server but I would simply add a new folder (like the “vienna” folder in this example) and link in the executable and project file.

Using QGIS Server WMS in OpenLayers

Of course QGIS Server doesn’t just talk to QGIS Desktop but to any other WMS client that conforms to the standard. One classic use case is to add the WMS layers to an OpenLayers application. This is rather simple but I’ll add it here for the sake of completeness:

I used to have a Geoserver WMS base layer in my application. The only lines of code that needed to be changed to migrate to QGIS Server were the service URL and the layer names.

    wms = new OpenLayers.Layer.WMS(
        'roads', "http://10.101.21.28/cgi-bin/vienna/qgis_mapserv.fcgi",
        {
            layers: 'roads', 
            format: 'image/png';
            bgcolor: '#fafafa'
        }, 
        {
            buffer: 1, 
            isBaseLayer: true, 
            graphicZIndex: 0, 
        }
    );

Standardized services are great!


Adding Raster Layer Support to Time Manager

So far, Time Manager has been limited to vector layers. Support for raster layers has been on the wish list for quite a while. I’ve been considering different approaches and for now I have settled with one that keeps the way how raster layers work as close to the workings of vector layers as possible:

All layers have to be loaded before they can be added to Time Manager. The layers are added one-by-one and start and end time values are defined. (This differs from vector layers where start/end attribute are defined instead.) All raster layers that are not within the current time frame are set to 100 % transparency.

I’m not certain yet whether this is a good approach though. I’ll probably keep trying different approaches for a while.

This is a screen cast of the current status:

The plugin source is available on Github, as usual. It’s still going to take a while until there will be a plugin package including this feature.

I’m looking forward to reading your comments here or on Youtube. Do you think this approach is usable?


Migrating a QGIS Project to New Symbology and Labeling

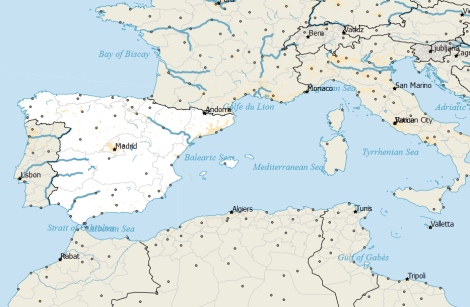
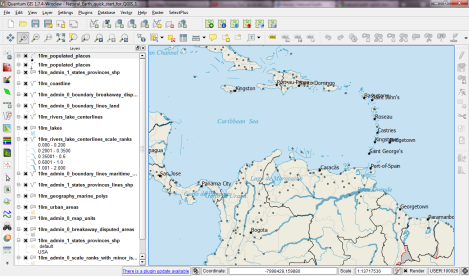
This is a follow-up to my recent “Natural Earth Quick Start Kit” post in which I presented the great quick start kit provided by the Natural Earth team. The QGIS project file they provide was written in QGIS 1.4 with both old symbology and old labeling:

Original Natural Earth Quickstart map centered on the Mediterranean

Since then a lot has changed. QGIS has a new powerful labeling engine which avoids label collisions and more advanced layer symbology. If that’s not reason enough to switch, it is also worth noting that both old systems will most certainly be removed for QGIS 2.0 release. Luckily, switching is pretty easy:

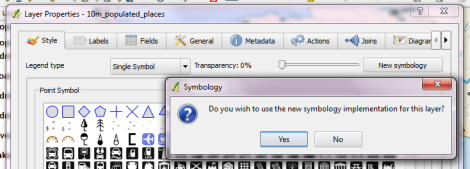
Switching to new symbology

In QGIS 1.7.4, switching to new symbology is very straight forward: Click the “new symbology” button in the upper right corner of the style tab and confirm the popup message. That’s it.

Switching to new labeling

Changing from old to new labeling is less automated. It will help if you take notes about font, size and colors as well as scale ranges before deactivating labeling in layer properties. Enable new labeling from the labeling toolbar and fill in the settings you have written down.

One of the known issues with new labeling is that it is currently not possible to rotate the labels without also specifying the label position. In most projects, this won’t be an issue though.

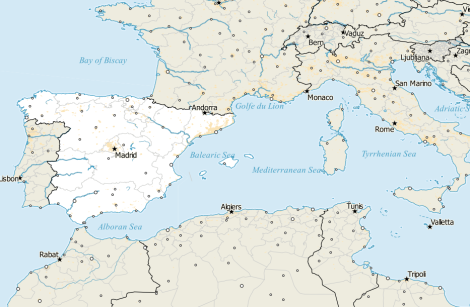
Updating the Natural Earth project

Besides switching to the new infrastructure, I’ve applied some minor changes to increase readability:

  • Buffers for city labels help where labels overlap with equally black country borders.
  • Buffers for capital symbols (stars) make them stand out over border lines.
  • Suppressed labeling for marine polygons smaller than 10mm avoids clutter.
  • Thinner river line styles with rounded corners make the map look cleaner.
  • A little halo around the land masses looks friendly.

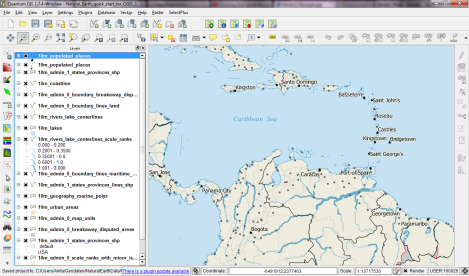
The same map with new labeling and new symbology

I’ve uploaded the new project file version to QGIS Ressources on Github if you want to give it a try.


Beautiful Global Projections – Adding Custom Projections to QGIS

This year we are celebrating Gerardus Mercator’s 500th birthday. We have all grown very accustomed to his Mercator projection but I want to take the chance to explore some alternatives:

Radical Cartography features an extensive projection reference compiled by Bill Rankin. One of the more exotic projections is “Van der Grinten I” by Alphons J. van der Grinten, 1898. It has a “pleasant balance of shape and scale distortion”. The “boundary is a circle” and “all parallels and meridians are circular arcs (spacing of parallels is arbitrary)”.

Using the name, we can try to find the projection definition on Spatialreference.org. One of the definitions that works well in QGIS is “ESRI:53029 Sphere Van der Grinten I” with the following proj4 string:

+proj=vandg +lon_0=0 +x_0=0 +y_0=0 +R_A +a=6371000 +b=6371000 +units=m +no_defs

In QGIS Settings – Custom CRS, we can add this projection to the list of available CRS:

  1. Press the “Star” button to add a new empty entry”
  2. Add the Name and proj4 string
  3. Press the “Save” button to make the changes permanent

Custom projection dialog

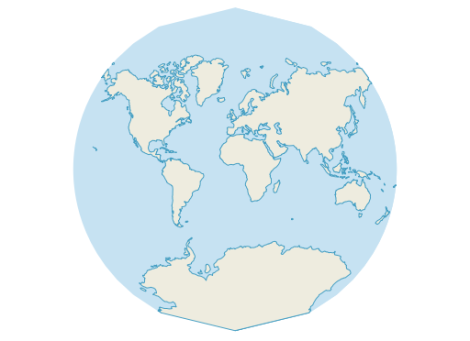
Once this is done, “Van der Grinten I” can be selected for on-the-fly reprojection. I’ve been using NaturalEarth’s land and ocean dataset. The result might not be a perfect circle (due to the coarseness of the dataset) but I find it very appealing:

Van der Grinten projection


Natural Earth Quick Start Kit

Natural Earth is a great resource and you have probably already used it. One of the many nice things about Natural Earth is that it gets you started very quickly:
They offer a quick start kit that provides a sample of Natural Earth data as well as a QGIS project file. The project is really well done with appropriate scale-dependent styles and labels for all layers. A screenshot can capture only part of it:

The original Natural Earth Quick Start project

One potential point for improvement is labeling. The project uses old labeling and therefore suffers from label collisions. Changing to new labeling engine results in a clearer picture. (I’ve also added label buffers since both city symbols and labels are black and therefore can get difficult to distinguish.)

Another nice trick is to suppress labels for small features. The minimum size of features to be labeled can be set on the “advanced” tab of the new labeling dialog. In this case, I went with 10 mm to avoid labeling small marine polygons.

Changed to new labeling engine

I haven’t worked through all layers yet, but I am planning to share the updated project file back to the Natural Earth team.


Mapping the Night

Most maps of night time lights show the land masses lit brightly by city lights. But the oceans are not as dark as these maps suggest. NOAA/NGDC datasets available through edenextdata.com show very bright spots in the North Sea:

Night time lights trace the coast but illuminate the sea too.

The dataset description mentions that the sensors pick up moonlit clouds, lights from human settlements, fires, gas flares, heavily lit fishing boats, lightning and the aurora. So might these spots be fishing boats?


Back to Top

Sustaining Members