Related Plugins and Tags

QGIS Planet

Data-defined properties in QGIS 2.0

In QGIS 2.0, the old “size scale” field has been replaced by data-defined properties which enable us to control many more properties than jut size and rotation. One of the often requested features – for example – is the possibility for data-defined colors:

datadefinedproperties

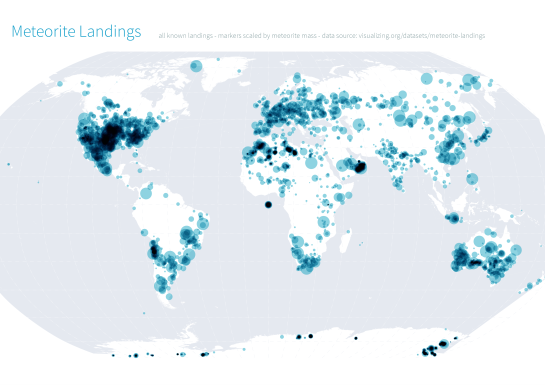
Today’s example map visualizes a dataset of known meteorite landings published on http://visualizing.org/datasets/meteorite-landings. I didn’t clean the data, so there is quite a bunch of meteorites at 0/0.

To create the map, I used QGIS 2.0 feature blending mode “multiply” as well as data-defined size based on meteorite mass:

meteorites1

Background oceans and graticule by NaturalEarthData.


TimeManager in QGIS master

Today, I updated my QGIS Time Manager plugin to version 0.8. It now works with QGIS master and that means that we can take advantage of all the cool new features in our animations. The following quick example uses the “multiply” blend mode with the tweet sample data which is provided by default when you install the plugin:

(The video here is a little small. Watch it on Youtube to see the details.)


QGIS Flickr Group

The excitement about the upcoming 2.0 release is growing and to add some fuel to the fires, Mathieu founded the QGIS Flickr Group. Anyone can join and add their maps done with QGIS master.

I’m looking forward to seeing what you have come up with. Please note that this group is meant for maps only (therefore no screenshots of the application please).


Sextante Modeler Evolution 1.0.8 to 1.1

Sextante is quickly becoming the goto geoprocessing toolbox for me. I’ve been working with Sextante 1.0.8 on QGIS 1.8 and lately I’ve started looking into Sextante 1.1 for QGIS 2. This post highlights some of the main differences between the two versions. I’m sure there are many more hidden gems I have not discovered so far.

One thing you will notice if you have used previous versions of Sextante is that the new version comes with a simplified interface which groups tools into three categories: geoalgorithms, models, and scripts. If you prefer the old style grouping by algorithm source such as GDAL, GRASS, etc. you can switch to the Advanced interface.

Let’s start with the bad news: Models created in 1.0.8 are not compatible with 1.1 since many of the algorithms have been rearranged in new categories and Sextante cannot find them by their old names anymore, e.g.

1.0.8 … ALGORITHM:ftools:fixeddistancebuffer
1.1 … ALGORITHM:qgis:fixeddistancebuffer

The great news is that the modeler has been improved greatly. Model representations now show the flow of input and output data through the model steps much more clearly:

Sextante 1.0.8 Modeler

Sextante 1.0.8 modeler

Sextante 1.1 Modeler

Sextante 1.1 modeler

I also found the new modeler much more stable – no crashes so far. *fingerscrossed*

Another nice new feature is Sextante commander which can be started using the shortcut Ctrl+Alt+M. It’s a quick launch solution for all Sextante algorithms:

sextante_commander

At FOSS4G, I’ll be presenting some work I did evaluation OSM using Sextante 1.0.8. I’d love to hear how you are using Sextante.


Print Composer 2.0 – Take #7

Today’s post: More print composer overview magic!

Inverted Map Overviews

Thanks to the “Invert overview” option, we can now chose between highlighting the detail area (left example in the image) or blocking out the surrounding area (right example).

printcomposer_overviews

The “Lock layers for map item” option can come in very handy if you want to reduce the number of layers in the overview map while still keeping all layers of interest in the main map.


Advanced Python Field Calculator

Advanced Python field calculator is one of the numerous tools in Sextante for QGIS. It’s extremely powerful but it doesn’t use the syntax of QGIS’ default field calculator (the one you can access via attribute table). Therefore, here comes a short introduction:

If you want to reproduce this example, I used a dataset of town areas from the new open government data site of Lower Austria.

The upper half of the Advanced Python field calculator is rather self-explanatory but the lower half is where it gets interesting: Code in the global expression section will be executed only once before the calculator starts iterating through all the features of the input layer. Therefore, this is the correct place to import necessary modules or to calculate variables that will be used in subsequent calculations. Code in the formula section will be evaluated for each feature in the input layer. As shown in the following example, this is where we can calculate new values, e.g. the area of the polygons in km²:

sextante_pythonfieldcalc_area

As you can see, the feature geometry can be accessed using $geom.

If you want to access an existing attribute, that’s possible using <attribute_name>.

Anyway, this is the resulting layer’s attribute table including the new areaKM2 field:

sextante_pythonfieldcalc_area_results

Thanks to Victor for pointing me to the documentation of FieldPyculator which Advanced Python field calculator is based on.


Print Composer 2.0 – Take #6

The latest version of Print composer features new

Rulers and guide lines or “alignments”

Rulers are a well-known feature in graphics programs such as Gimp and Photoshop. Now you can also find them in QGIS Print Composer. Click onto the ruler, hold the mouse key down and move the cursor to position guide lines for map feature alignment.

printcomposer_grid

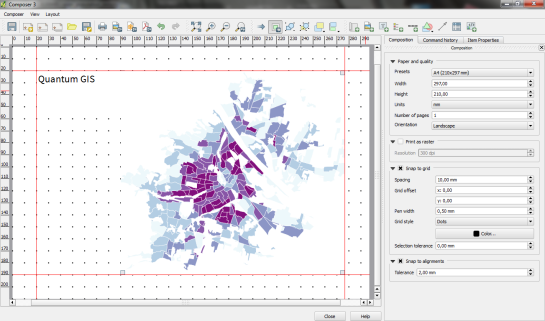
Of course, there’s also the handy “Snap to grid” functionality.


Print Composer 2.0 – Take #5

This fifth part in my series on QGIS 2.0 Print Composer presents

Map grids

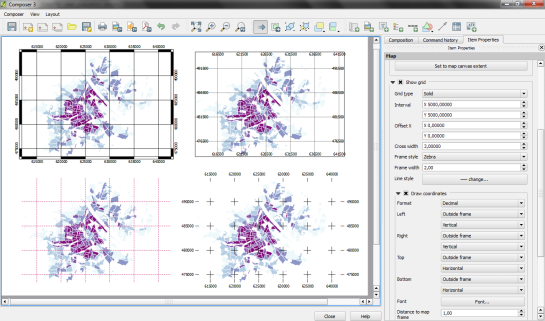
There are numerous different options for map grids in the new composer but a picture is worth a thousand words:

printcomposer_grids

The upper-left map features a zebra frame style and coordinate labels aligned horizontally and vertically.

The upper-right map shows a normal frame with labels written inside the frame instead of outside. This grid shows an additional offset.

The lower-left map has no frame but customized, colored and dashed grid lines.

Finally, the lower-right map shows a cross grid with default horizontal coordinate labels.


Print Composer 2.0 – Take #4

Today’s spotlight is on a feature which you’ll really love if you have to arrange a little more text on a print layout:

HTML labels

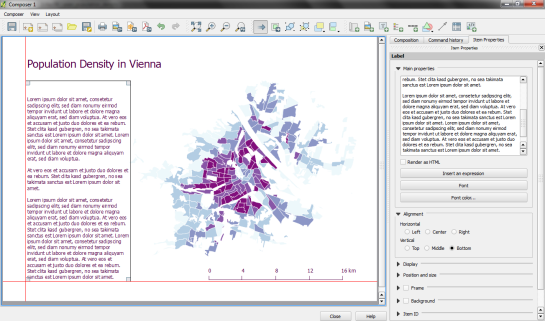
Regular labels are limited to one font, size and color. With the new “Render as HTML” option, you gain flexibility to use HTML tags to style your text by adding headers, lists and even images (note the QGIS logo I added by pointing to the image online):

printcomposer_html


Print Composer 2.0 – Take #3

After guide lines and multi-column legends, today’s focus is on

Overview maps

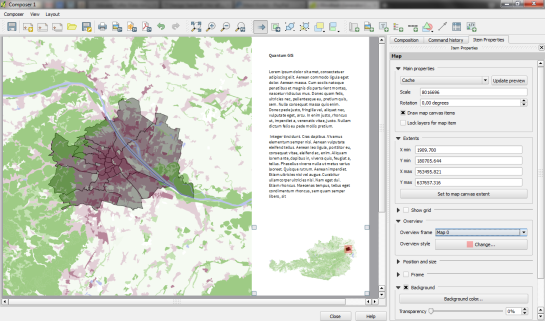
Small overview maps are used to help the reader get an idea of where the region displayed on the main map is located. In the new Print Composer, it’s simple to add such overviews: Add the main map as usual. Then add another map object to the composition an go to the “Overview” section. There, you can specify that the second map object should be an overview map for the first one: Just specify “Map 0″ in the dropdown list:

printcomposer_overview


Print Composer 2.0 – Take #2

After yesterday’s first post on guide lines & snapping for user-friendly map element arrangement, we’ll have a look at another great new addition:

Multi-column legends

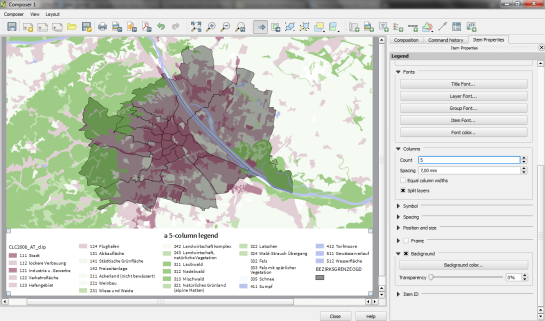
In the panel on the right, there is a new section called “Columns”. Here we can create multi-column legend layouts by specifying the desired number of columns. Add some spacing too. It will make the result look more balanced.

By default, Print Composer tries to keep all classes of one layer in one column. You can override this behavior – as I did in this example – by ticking “Split Layers”:

printcomposer_columns

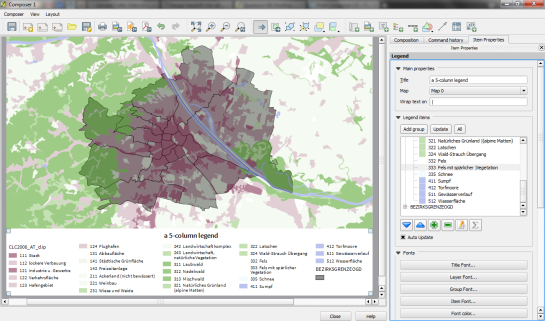
Another useful trick is to use text wrapping for long class labels. This option can be found in the legend’s “Main properties” right at the top of the side panel. In this example, I specified wrap on the pipe “|” symbol and inserted this symbol into the longer class names to force a line break:

printcomposer_wraplegendtext


Print Composer 2.0 – Take #1

This is the first post in a series dedicated solely to Print Composer in QGIS 2.0 which you can already admire in recent nightly builds.

Guide lines & snapping for user-friendly map element arrangement

Arranging map elements has never been easier: Elements can be moved as freely as before but now they will automatically try to align with other elements on the page or the page borders. Additional red guide lines help interpret the snapping behavior.

printcomposer_guides


Group Stats Tutorial

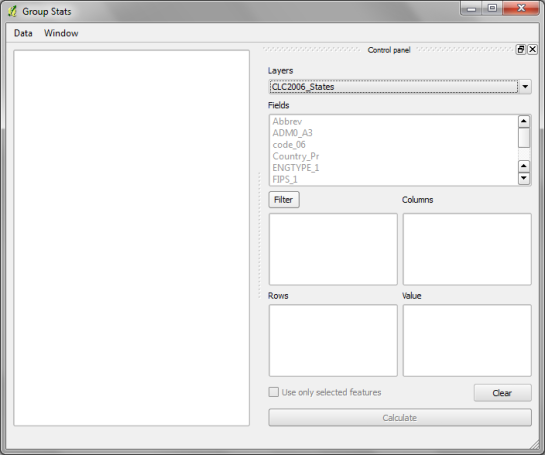
Group Stats is a plugin for QGIS which makes it easy to calculate statistics for feature groups in a vector layer. Note that the plugin is still marked “experimental” so you have to allow experimental plugins in order to install it. I tried this plugin for the first time today and decided to write this post because it didn’t seem immediately obvious how to use it.

The plugin button is added to the vector toolbar and of course you can access it via vector menu.

groupstatsicon

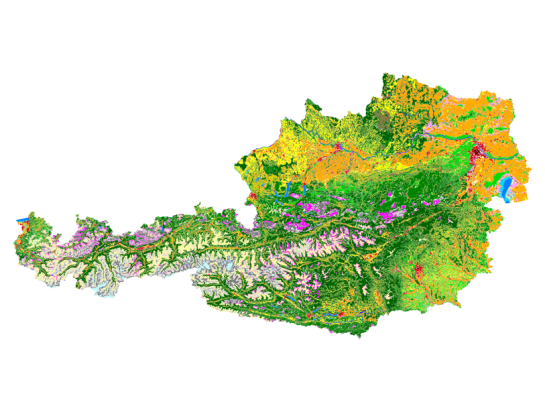
The example I want to show is: How to calculate the total area of of each Corine Land Cover (CLC) class per state.

corineAT

After adding state information to the CLC datasets by intersecting CLC and state geometries from Natural Earth we can get started with Group Stats.

groupstats

The big area on the left will display the results. The input fields are on the right. The general idea is to drag and drop fields and/or functions into the “columns”, “rows” and “values” sections. (Double-clicking field names does not do anything.) To remove fields again, you have to drop them back into the field list.

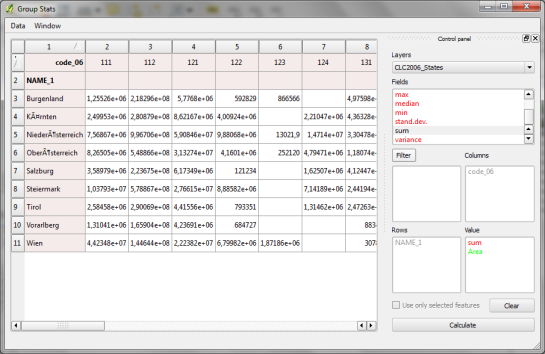
To calculate the total area of of each Corine Land Cover (CLC) class per state, I chose land cover classes as columns, state names as rows and sum of areas as values:

groupstatsclc

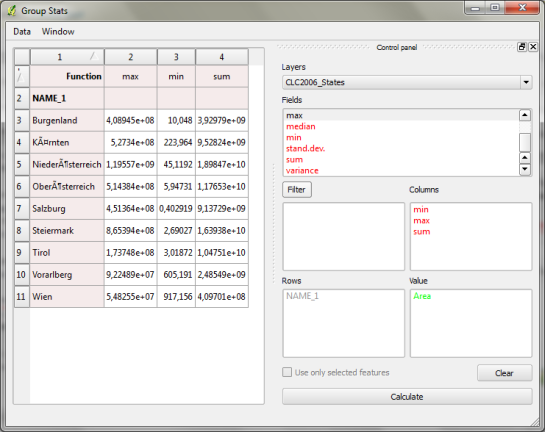
It’s also possible to add multiple functions in the columns/rows input sections to calculate different statistics at once:

groupstats_functions

Group Stats can be used in many cases that otherwise require a Spreadsheet software. The results can be exported to CSV easily. Usability could certainly be improved by allowing common interactions such as removing fields by pressing the delete key or adding fields by double-clicking.


New QGIS Symbol Packages

So far, QGIS does not come with many default symbols. Quite often one just needs two or three colors that go well together. That’s why I created a series of simple fill symbols based on ColorBrewer. They are available on Github QGIS-resources:

As always, these XMLs can be imported using Style Manager.

polysymbols

Another great addition to QGIS-resources was added this week by user aplannersguide. He shared his styles for osm2pgsql layers:

bdd73ba0-4ad3-11e2-8d74-1327374e522c


Expanding Sextante’s ftools Toolbox

This post covers how to add you own tools to expand Sextante’s ftools toolbox.

I was looking through Sextante for a tool that inserts additional nodes into a linestring at intervals of my choice. I couldn’t find that exact tool but I found something similar: Densify Geometries in ftools which adds the same number of nodes to all line segments. So I decided to modify Densify Geometries to fit my requirements.

Ftools scripts (such as DensifyGeometries.py) are located in ~/.qgis/python/plugins/sextante/ftools. To create my modified version, I just copied the original and modified the code to accept a densification interval instead of a number of nodes. Since I didn’t know how to add my new tool to Sextante I contacted the developer mailing list and after a short coffee break I had the answer (thanks Alexander!):

The new algorithm has to be exposed in the provider FToolsAlgorithmProvider.py. To do that: Add an import statement for the new algorithm (using existing statements as examples) and add the algorithm to the list self.alglist in the __init__() method. That’s it!

sextante_with_mytool

Sextante automatically creates the input form you can see in above screenshot. Very handy! And the new tool can be added to geoprocessing models just like any of the original ones.


On Sharing QGIS Symbols

The current developer version makes it easier to share symbol libraries online. Here a quick example of how to share using Github.

This is one of the symbol libraries I uploaded:

import3

If you click on “Raw”, you get the url of the raw text file which can be used to import the symbols into Style Manager:

import2

The importer lets you select which symbols to import:

import1


Improving Population Density Maps Using Dasymetric Mapping

Yesterday, I described my process to generate a basic population density map from the city of Vienna’s open government data. In the end of that post, I described some ideas for further improvement. Today, I want to follow-up on those ideas using what is known as dasymetric mapping. GIS Dictionary defines it well (much better than Wikipedia):

Dasymetric mapping is a technique in which attribute data that is organized by a large or arbitrary area unit is more accurately distributed within that unit by the overlay of geographic boundaries that exclude, restrict, or confine the attribute in question.
For example, a population attribute organized by census tract might be more accurately distributed by the overlay of water bodies, vacant land, and other land-use boundaries within which it is reasonable to infer that people do not live.

That’s exactly what I want to do: Based on subdistricts with population density values and auxiliary data – Corine Land Cover to be exact – I want to create an improved representation of population density within the city.

This is the population density map I start out with:
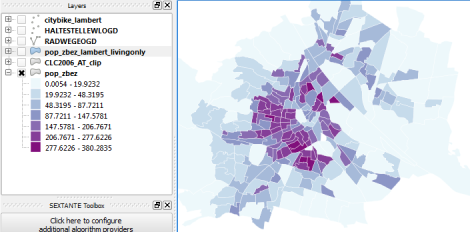
… and this is the Corine Land Cover dataset for the same area:

It shows built-up areas (red), parks and natural areas (green) as well as water-covered regions (blue). For further analysis, I follow the assumption that people only live in areas with Corine code 111 “Continuous urban fabric” and 112 “Discontinuous urban fabric”. Therefore, I use the Intersection tool to clip only these residential areas from the subdistrict polygons. The subdistrict population can now be distributed over these new, smaller areas (use Field Calculator) to create a more realistic visualization of population density:

For easier comparison, I put the original density and the dasymetric map into a looping animation. Some subdistricts change their population density values quite drastically, especially in regions where big parts covered by water or rail infrastructure were removed:

Corine Land Cover is not too detailed but I think it still usable on this scale. One thing to note is that I used data from 2006 with population data from 2012 so some areas in the outer districts will have been turned residential in the meantime. But I hope this doesn’t distort the overall picture too much.


Mapping OGDWien Population Density

The city of Vienna provides both subdistrict geometries and population statistics. Mapping the city’s population density should be straightforward, right? Let’s see …

We should be able to join on ZBEZ and SUB_DISTRICT_CODE, check! But what about the actual population counts? Unfortunately, there is no file which simply lists population per subdistrict. The file I found contains four lines for each subdistrict: females 2011, males 2011, females 2012 and males 2012. That’s not the perfect format for mapping general population density.

A quick way to prepare our input data is applying pivot tables, eg. in Open Office: The goal is to have one row per subdistrict and columns for population in 2011 and 2012:

Export as CSV, add CSVT and load into QGIS. Finally, we can join geometries and CSV table:

A quick look at the joined data confirms that each subdistrict now has a population value. But visualizing absolute values results in misleading maps. Big subdistricts with only average density will overrule smaller but much denser subdistricts:

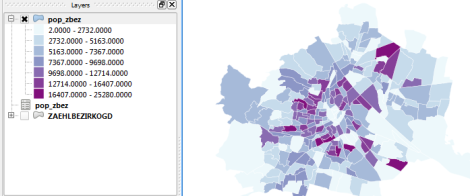
That’s why we need to calculate population density. This is easy to do using Field Calculator. The subdistrict file already contains area values but even if they were missing, we could calculate it using the $area operator: "pop2012" / ($area / 10000). The resulting population density in population per ha finally shows which subdistricts are the most densely populated:

One could argue that this is still no accurate representation of population density: Big parts of some subdistricts are actually covered by water – especially along the Danube – and therefore uninhabited. There are also big parks which could be excluded from the subdistrict area. But that’s going to be the topic of another post.

If you want to use my results so far, you can download the GeoJSON file from Github.


Dataviz with OpenSource Tools

Today, I’ve finished my submission for the Hubway Data Visualization Challenge. All parts of the resulting dataviz were created using open source tools. My toolbox for this work contains: QGIS, Spatialite, Inkscape, Gimp and Open Office Calc. To see the complete submission and read more about it, check the project page.


Hubway’s Bike Balance Landscape

Continuing where I left off yesterday, I went on to creating another visualization based on the assumption that people like to bike downhill but will be more reluctant to bike uphill.

As described in yesterday’s post, the Hubway network features stations with a negative bike balance (more bikes leaving than arriving) and others with a positive balance. Positively balanced stations are where people like biking to while negatively balanced stations are less attractive – like if they were on top of a hill and hard to reach.

Using this assumption and QGIS Grid Interpolation and Relief tool, I’ve created the following biking landscape:

With a negative balance of -2.76 bikes per day, Mayor Thomas M. Menino – Government Center station is the most unpopular station to bike to. Assuming the trip dataset is complete, this means that Hubway has to regularly transport bikes from positively balanced stations to this one to keep the system going.

Due to some trips containing NULL values in start/end station id, the total number of incoming and outgoing trips does not add up perfectly. But otherwise, this should represent the state of Hubway’s biking landscape pretty well.


Back to Top

Sustaining Members