Related Plugins and Tags

QGIS Planet

A QGIS router for GIP.at

Monday, January 4th 2016, was the open data release date of the official Austrian street network dataset called GIP.at. As far as I know, the dataset is not totally complete yet but it should be in the upcoming months. I’ve blogged about GIP.at before in Open source IDF parser for QGIS and Open source IDF router for QGIS where I was implementing tools based on the data samples that were available then. Naturally, I was very curious if my parser and particularly the router could handle the whole country release …

Some code tweaking, patience for loading, and 9GB of RAM later, QGIS happily routes through Austria, for example from my work place to Salzburg – maybe for some skiing:

Screenshot 2016-01-06 17.11.27

The routing request itself takes something between 1 and 2 seconds. (I should still add a timer to it.)

So far, I’ve implemented shortest distance routing for pedestrians, bikes, and cars. Since the data also contains travel speeds, it should be quite straight-forward to also add shortest travel time routing.

The code is available on Github for you to try. I’d appreciate any feedback!


Talking QGIS with UNIGIS Salzburg

Last summer, I had the pleasure to talk with UNIGIS Salzburg about the QGIS project: how it works and what makes it great. Now, finally, the video is out on Youtube:

Amongst other things, we are discussing the UNIGIS module on QGIS, which I have been teaching for the past few months.


How to label only selected features in QGIS 2.8 and up

In 2011, I wrote “How to Label Only Selected Features in QGIS” which ends with the wish that

Another “data defined setting” like “show this label (true/false)” would be more intuitive.

… and now we have it!

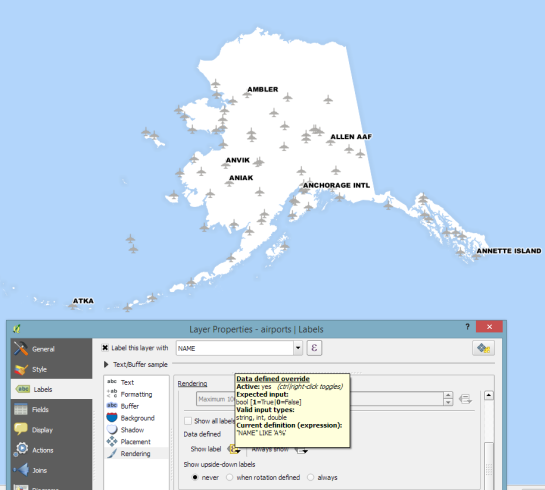
It’s called Show label and you can find it in the Rendering section of the labeling dialog.

The following screenshot shows a quick example of how to label only airports starting with A by setting the expression

"NAME" LIKE 'A%'

labelselected

This post was motivated by a question by Eduardo here on this blog. Hope it helps!


How to create connectivity-based line caps

It’s been a while since my last blog post mostly because I’ve been busy with some more long form writing. Most notably, I’ve been writing a paper on the QGIS Projcessing framework in the open access ISPRS International Journal of Geo-Information together with Victor Olaya and I’m still in the process of writing a new book titled “QGIS Map Design” together with Gretchen Peterson which is scheduled for early 2016.

Today’s post has been on my todo list for a while now. It’s inspired by a talk at a recent cartography conference I attended:

(For a summary of the whole event, check the storify I compiled.)

The idea of this slide and several more was to show all the attention to detail which goes into designing a good road map. One aspect seemed particularly interesting to me since I had never considered it before: what do we communicate by our choice of line caps? The speaker argued that we need different caps for different situations, such as closed square caps at the end of a road and open flat caps when a road turns into a narrower path.

I’ve been playing with this idea to see how to reproduce the effect in QGIS …

So first of all, I created a small test dataset with different types of road classes. The dataset is pretty simple but the key to recreating the style is in the attributes for the road’s end node degree values (degree_fro and degree_to), the link’s road class as well as the class of the adjacent roads (class_to and class_from). The degree value simply states how many lines connect to a certain network node. So a dead end as a degree of 1, a t-shaped intersection has a degree of 3, and so on. The adjacent class columns are only filled if the a neighbor is of class minor since I don’t have a use for any other values in this example. Filling the degree and adjacent class columns is something that certainly could be automated but I haven’t looked into that yet.

roadattributes


The layer is then styled using rules. There is one rule for each road class value. Rendering order is used to ensure that bridges are drawn on top of all other lines.

roadrules

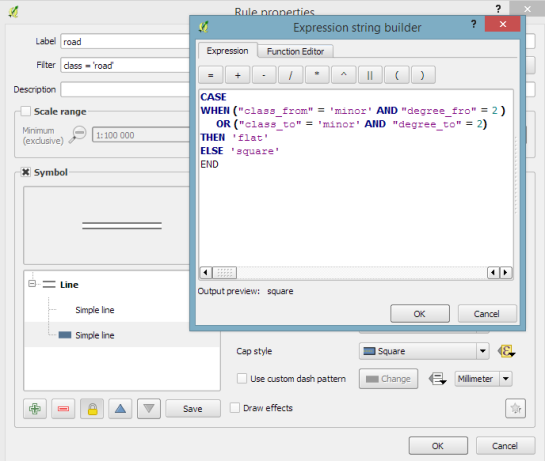
Now for the juicy part: the caps are defined using a data-defined expression. The goal of the expression is to detect where a road turns into a narrow path and use a flat cap there. In all other cases, square cap should be used.

roadrule

Like some of you noted on Twitter after I posted the first preview, there is one issue and that is that we can only set one cap style per line and it will affect both ends of the line in the same way. In practice though, I’m not sure this will actually cause any issues in the majority of cases.

I wonder if it would be possible to automate this style in a way such that it doesn’t require any precomputed attributes but instead uses some custom functions in the data-defined expressions which determine the correct style on the fly. Let me know if you try it!


Take part in the QGIS user survey

The QGIS project is asking for user feedback to gain a better understanding of the wishes and requirements of its user base. Please take part in the survey and share the links with other QGIS users. The survey is available in multiple languages:


Quick webmaps with qgis2web

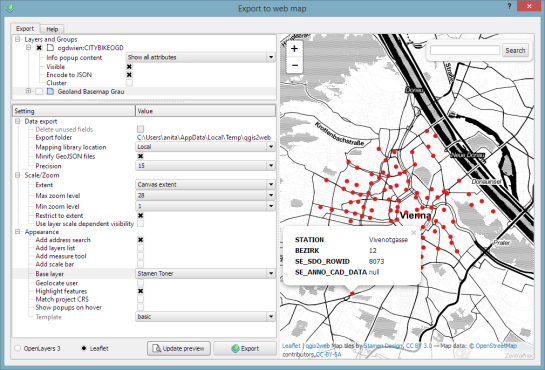
In Publishing interactive web maps using QGIS, I presented two plugins for exporting web maps from QGIS. Today, I want to add an new member to this family: the qgis2web plugin is the successor of qgis-ol3 and combines exports to both OpenLayers3 as well as Leaflet.

The plugin is under active development and currently not all features are supported for both OpenLayers3 and Leaflet, but it’s a very convenient way to kick-off a quick webmapping project.

Here’s an example of an OpenLayers3 preview with enabled popups:

OpenLayers3 preview

OpenLayers3 preview

And here is the same map in Leaflet with the added bonus of a nice address search bar which can be added automatically as well:

Leaflet preview

Leaflet preview

The workflow is really straight forward: select the desired layers and popup settings, pick some appearance extras, and then don’t forget to hit the Update preview button otherwise you might be wondering why nothing happens ;)

I’ll continue testing these plugins and am looking forward to seeing what features the future will bring.


What went on at FOSS4G 2015?

Granted, I could only follow FOSS4G 2015 remotely on social media but what I saw was quite impressive and will keep me busy exploring for quite a while. Here’s my personal pick of this year’s highlights which I’d like to share with you:

QGIS

Marco Hugentobler at FOSS4G 2015 (Photo by Jody Garnett)

Marco Hugentobler at FOSS4G 2015 (Photo by Jody Garnett)

The Sourcepole team has been particularly busy with four presentations which you can find on their blog.

Marco Hugentobler’s keynote is just great, summing up the history of the QGIS project and discussing success factor for open source projects.

Marco also gave a second presentation on new QGIS features for power users, including live layer effects, new geometry support (curves!), and geometry checker.

There has also been an update to QTiles plugin by NextGIS this week.

If you’re a bit more into webmapping, Victor Olaya presented the Web App Builder he’s been developing at Boundless. Web App Builder should appear in the official plugin repo soon.

Preview of Web App Builder from Victors presentation

Preview of Web App Builder from Victors presentation

Geocoding

If you work with messy, real-world data, you’ve most certainly been fighting with geocoding services, trying to make the best of a bunch of address lists. The Python Geocoder library promises to make dealing with geocoding services such as Google, Bing, OSM & many easier than ever before.

Let me know if you tried it.

Mobmap Visualizations

Mobmap – or more specifically Mobmap2 – is an extension for Chrome which offers visualization and analysis capabilities for trajectory data. I haven’t tried it yet but their presentation certainly looks very interesting:


Using TimeManager for WMS-T layers

This is a guest post by Karolina Alexiou (aka carolinux), Anita’s collaborator on the Time Manager plugin.

As of version 2.1.5, TimeManager provides some support for stepping through WMS-T layers, a format about which Anita has written  in the past.  From the official definition, the OpenGIS® Web Map Service Interface Standard (WMS) provides a simple HTTP interface for requesting geo-registered map images from one or more distributed geospatial databases. A WMS request defines the geographic layer(s) and area of interest to be processed. The response to the request is one or more geo-registered map images (returned as JPEG, PNG, etc) that can be displayed in a browser application. QGIS can display those images as a raster layer. The WMS-T standard allows the user of the service to set a time boundary in addition to a geographical boundary with their HTTP request.

We are going to add the following url as the web map provider service: http://mesonet.agron.iastate.edu/cgi-bin/wms/nexrad/n0r-t.cgi

From QGIS, go to Layer>Add Layer>Add WMS/WMST Layer and add a new server and connect to it. For the service we have chosen, we only need to specify a name and the url.

Select the top level layer, in our case named nexrad_base_reflect and click Add. Now you have added the layer to your QGIS project.

To add it to TimeManager as well, add it as a raster with the settings from the screenshot below. Start time and end time have the values 2005-08-29:03:10:00Z and 2005-08-30:03:10:00Z respectively, which is a period which overlaps with hurricane Katrina. Now, the WMS-T standard uses a handful of different time formats, and at this time, the plugin requires you to know this format and input the start and end values in this format. If there’s interest to sponsor this feature, in the future we may get the format directly from the web service description. The web service description is an XML document (see here for an example) which, among other information, contains a section that defines the format, default time and granularity of the time dimension.

add_raster

If we set the time step to 2 hours and click play, we will see that TimeManager renders each interval by querying the web map service for it, as you can see in this short video.

Querying the web service and waiting for the response takes some time. So, the plugin requires some patience for looking at this particular layer format in interactive mode. If we export the frames, however, we can get a nice result. This is an animation showing hurricane Katrina progressing over a 30 minute interval.

whoosh

If you want to sponsor further development of the Time Manager plugin, you can arrange a session with me – Karolina Alexiou – via Codementor.


Open source IDF router for QGIS

This is a follow-up on my previous post introducing an Open source IDF parser for QGIS. Today’s post takes the code further and adds routing functionality for foot, bike, and car routes including oneway streets and turn restrictions.

You can find the script in my QGIS-resources repository on Github. It creates an IDFRouter object based on an IDF file which you can use to compute routes.

The following screenshot shows an example car route in Vienna which gets quite complex due to driving restrictions. The dark blue line is computed by my script on GIP data while the light blue line is the route from OpenRouteService.org (via the OSM route plugin) on OSM data. Minor route geometry differences are due to slight differences in the network link geometries.

Screenshot 2015-08-01 16.29.57


Open source IDF parser for QGIS

IDF is the data format used by Austrian authorities to publish the official open government street graph. It’s basically a text file describing network nodes, links, and permissions for different modes of transport.

Since, to my knowledge, there hasn’t been any open source IDF parser available so far, I’ve started to write my own using PyQGIS. You can find the script which is meant to be run in the QGIS Python console in my Github QGIS-resources repo.

I haven’t implemented all details yet but it successfully parses nodes and links from the two example IDF files that have been published so far as can be seen in the following screenshot which shows the Klagenfurt example data:

Screenshot 2015-07-23 16.23.25

If you are interested in advancing this project, just get in touch here or on Github.


A Processing model for Tanaka contours

If you follow my blog, you’ve most certainly seen the post How to create illuminated contours, Tanaka-style from earlier this year. As Victor Olaya noted correctly in the comments, the workflow to create this effect lends itself perfectly to being automated with a Processing model.

The model needs only two inputs: the digital elevation model raster and the interval at which we want the contours to be created:

Screenshot 2015-07-05 18.59.34

The model steps are straightforward: the contours are generated and split into short segments before the segment orientation is computed using the following code in the Advanced Python Field Calculator:

p1 = $geom.asPolyline()[0]
p2 = $geom.asPolyline()[-1]
a = p1.azimuth(p2)
if a < 0:
   a += 360
value = a

Screenshot 2015-07-05 18.53.26

You can find the finished model on Github. Happy QGISing!


AGIT & GI_Forum 2015 wrap-up

It’s my pleasure to report back from this year’s AGIT and GI_Forum conference (German and English speaking respectively). It was great to meet the gathered GIS crowd! If you missed it, don’t despair: I’ve compiled a personal summary on Storify, and papers (German, English) and posters are available online. Here’s a pick of my favorite posters:

I also had the pleasure to be involved in multiple presentations this year:

QGIS at the OSGeo Day

As part of the OSGeo Day, I had the chance to present the latest and greatest QGIS features for map design in front of a full house:

Routing with OSM

On a slightly different note, my colleague Markus Straub and I presented an introduction to routing with OpenStreetMap covering which kind of routing-related information is available in OSM as well as a selection of different tools to perform routing on OSM.

Solving the “unnamed link” problem

In this talk, I presented approaches to solving issues with route descriptions that contain unnamed pedestrian or cycle paths.

Here you can find the full open access paper: Graser, A., & Straub, M. (2015). Improving Navigation: Automated Name Extraction for Separately Mapped Pedestrian and Cycle Links. GI_Forum ‒ Journal for Geographic Information Science, 1-2015, 546-556, doi:10.1553/giscience2015s546.

Inferring road popularity from GPS trajectories

In this talk, my colleague Markus Straub presented our new approach to computing how popular a certain road is. The resulting popularity value can be used for planning as well as routing.

Here you can find the full open access paper: Straub, M., & Graser, A. (2015). Learning from Experts: Inferring Road Popularity from GPS Trajectories. GI_Forum ‒ Journal for Geographic Information Science, 1-2015, 41-50, doi:10.1553/giscience2015s41.


QGIS on the rise with journalists

If you are following QGIS on Twitter you’ve probably noticed the increasing number of tweets by journalists using QGIS.

For example this map in the Financial Times by Hannah Dormido

or this one with overview maps and three different levels of details

or this map with semi-transparent label backgrounds and nice flag images

or even Time Manager animations by raoulranoa in the Los Angeles Times

I think this is a great development and a sign of how wide-spread QGIS usage is today.

If you know of any other examples or if you are a journalist using QGIS yourself, I’d love to see more!


Video tutorial: animated heatmaps with QGIS

Do you like the QGIS heatmap functionality? Did you know that QGIS can also create animated heatmaps?

The following video tutorial shows all necessary steps. To reproduce it, you can get the sample data from my Time Manager workshop at #QGIS2015.


QGIS 2.10 symbology feature preview

With the release of 2.10 right around the corner, it’s time to have a look at the new features this version of QGIS will bring. One area which has received a lot of development attention is layer styling. In particular, I want to point out the following new features:

1. Graduated symbol size

The graduated renderer has been expanded. Formerly, only color-graduated symbols could be created automatically. Now, it is possible to choose between color and size-graduated styles:

Screenshot 2015-06-21 18.39.25

2. Symbol size assistant

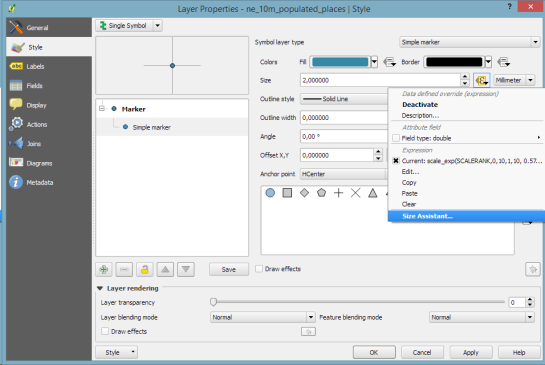
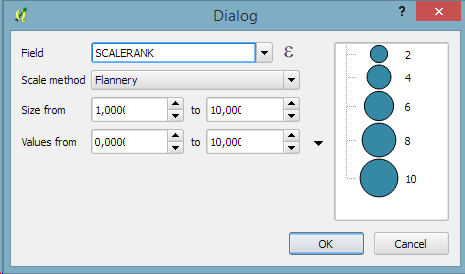
On a similar note, I’m sure you’ll enjoy the size assistant for data-defined size:

Screenshot 2015-06-21 23.16.10 Screenshot 2015-06-21 23.16.01

What’s particularly great about this feature is that it also creates a proper legend for the data-defined sizes:

Screenshot 2015-06-21 23.18.46

3. Interactive class exploration and definition

Another great addition to the graduated renderer dialog is the histogram tab which visualizes the distribution of values as well as the defined class borders. Additionally, the user can interactively change the classes by moving the class borders:

Screenshot 2015-06-21 18.43.09

4. Live layer effects

Since Nyall’s crowd funding initiative for live layer effects was a resounding success, it is now possible to create amazing effects for your vector styles such as shadows, glow, and blur effects:

Screenshot 2015-06-21 18.45.22

I’m very much looking forward to seeing all the new map designs this enables on the QGIS map Flickr group.

Thanks to everyone who was involved in developing and funding these new features!


QGIS 3.0 future plans

If you follow the QGIS developer mailing list, you’ve probably seen threads about the next major release: 3.0. The topic has been one of the many points we talked about at the latest QGIS developer meeting and Tim Sutton sums up the discussed plan in a post published today:

One hot topic was ‘when will QGIS 3.0 be released’. The short answer to that question is that ‘we don’t know’ – Jürgen Fischer and Matthias Kuhn are still investigating our options and once they have had enough time to understand the implications of upgrading to Qt5, Python 3 etc. they will make some recommendations. I can tell you that we agreed to announce clearly and long in advance (e.g. 1 year) the roadmap to moving to QGIS 3.0 so that plugin builders and others who are using QGIS libraries for building third party apps will have enough time to be ready for the transition. At the moment it is still uncertain if there even is a pressing need to make the transition, so we are going to hang back and wait for Jürgen & Matthias’ feedback.

The take-away message here is that the QGIS team is aware of the current developments around Python and Qt and will keep the community updated about the further development path well before any move.

qgis_keep_calm


How to create illuminated contours, Tanaka-style

In the category “last night on Twitter”, a challenge I couldn’t resist: creating illuminated contours (aka Tanaka contours) in QGIS. Daniel P. Huffman started the thread by posting this great example:

CFnWnA5UkAAuFm9

This was quickly picked up by Hannes Kröger who blogged about his first attempt at reproducing the effect using QGIS and GIMP. Obviously, that left the challenge of finding a QGIS-only solution.

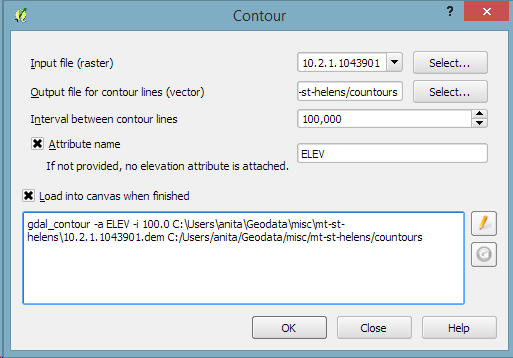
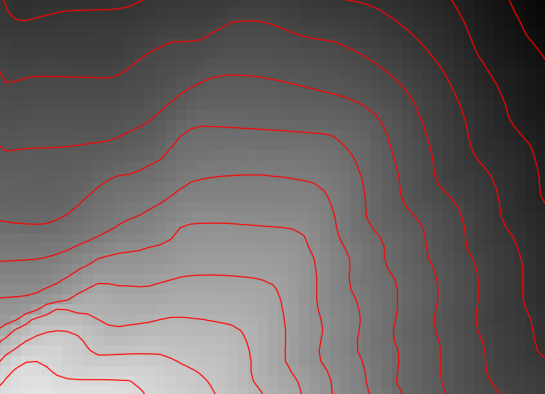
Everything that’s needed to create this effect is a DEM. As Hannes describes in his post, the DEM can then be used to compute the contour lines, e.g. with Raster | Extraction | Contour:

gdal_contour -a ELEV -i 100.0 C:\Users\anita\Geodata\misc\mt-st-helens\10.2.1.1043901.dem C:/Users/anita/Geodata/misc/mt-st-helens/countours

Screenshot 2015-05-24 11.17.49

contours

In order to be able to compute the brightness of the illuminated contours, we need to compute the orientation of every subsection of the contours. Therefore, we need to split the contour lines at each node. One way to do this is using v.split from the Processing toolbox:

Screenshot 2015-05-24 11.23.11

When we split the contours and visualize the result using arrows, we can see that they all wrap around the mountain in clockwise direction (light DEM cells equal higher elevation):

split_contours

After the split, we can compute the orientation of the contour subsections using, for example, a user-defined function:

Screenshot 2015-05-24 19.09.12

This function can then be used in a Field calculator expression:

Screenshot 2015-05-24 19.11.53

Based on the orientation, we can then write an expression to control the contour line color. For example, if we want the sun to appear in the north west (-45°) we can use:

color_hsl( 0,0, 
  scale_linear( abs(
    ( CASE WHEN "azimuth"-45 < 0
      THEN "azimuth"-45+360 
      ELSE "azimuth"-45
    END )
  -180), 0, 180, 0, 100)
  )

This will color the lines which are directly exposed to the sun white hsl(0,0,100) while the ones in the shadows will be black hsl(0,0,0).

Screenshot 2015-05-24 11.55.50

Use the Overlay layer blending mode to blend contours and DEM color:

illuminated_contours

The final step, to get as close to the original design as possible, is to create the effect of discrete elevation classes instead of a smooth color gradient. This can easily be achieved by changing the color interpolation mode of the DEM from Linear to Discrete:

Screenshot 2015-05-24 12.11.01

This leaves us with the following gorgeous effect:

tanaka_contours

As Hannes pointed out, another important aspect of Tanaka’s method is to also alter the contour line width. Lines in the sun or shadow should be wider (1 in this example) than those in orthogonal direction (0.2 in this example):

scale_linear( 
abs( abs(
  ( CASE WHEN "azimuth"-45 < 0
    THEN  "azimuth"-45+360
    ELSE  "azimuth"-45
  END )
-180) -90),
0, 90, 0.2, 1)

datadefined_line_width

Enjoy!


Time Manager workshop at #QGIS2015

Today was the final day of #QGIS2015 the first joint QGIS conference and developer meeting. I had the pleasure to meet Time Manager co-developer Karolina Alexiou aka carolinux in person and give a talk including a hands-on workshop on Time Manager together. Time Manager makes it possible to explore spatio-temporal data by creating animations directly in QGIS.

The talk presents QGIS visualization tools with a focus on efficient use of layer styling to both explore and present spatial data. Examples include the recently added heatmap style as well as sophisticated rule-based and data-defined styles. The focus of this presentation is exploring and presenting spatio-temporal data using the Time Manager plugin. A special treat are time-dependent styles using expression-based styling which access the current Time Manager timestamp.

To download the example data and QGIS projects download Time_Manager_Examples.zip.


Trajectory animations with fadeout effect

Today’s post is a short tutorial for creating trajectory animations with a fadeout effect using QGIS Time Manager. This is the result we are aiming for:

The animation shows the current movement in pink which fades out and leaves behind green traces of the trajectories.

About the data

GeoLife GPS Trajectories were collected within the (Microsoft Research Asia) Geolife project by 182 users in a period of over three years (from April 2007 to August 2012). [1,2,3] The GeoLife GPS Trajectories download contains many text files organized in multiple directories. The data files are basically CSVs with 6 lines of header information. They contain the following fields:

Field 1: Latitude in decimal degrees.
Field 2: Longitude in decimal degrees.
Field 3: All set to 0 for this dataset.
Field 4: Altitude in feet (-777 if not valid).
Field 5: Date – number of days (with fractional part) that have passed since 12/30/1899.
Field 6: Date as a string.
Field 7: Time as a string.

Data prep: PostGIS

Since any kind of GIS operation on text files will be quite inefficient, I decided to load the data into a PostGIS database. This table of millions of GPS points can then be sliced into appropriate chunks for exploration, for example, a day in Beijing:

CREATE MATERIALIZED VIEW geolife.beijing 
AS SELECT trajectories.id,
    trajectories.t_datetime,
    trajectories.t_datetime + interval '1 day' as t_to_datetime,
    trajectories.geom,
    trajectories.oid
   FROM geolife.trajectories
   WHERE st_dwithin(trajectories.geom,
           st_setsrid(
             st_makepoint(116.3974589, 
                           39.9388838), 
             4326), 
           0.1) 
   AND trajectories.t_datetime >= '2008-11-11 00:00:00'
   AND trajectories.t_datetime < '2008-11-12 00:00:00'
WITH DATA

Trajectory viz: a fadeout effect for point markers

The idea behind this visualization is to show both the current movement as well as the history of the trajectories. This can be achieved with a fadeout effect which leaves behind traces of past movement while the most recent positions are highlighted to stand out.

Map tiles by Stamen Design, under CC BY 3.0. Data by OpenStreetMap, under ODbL.

Map tiles by Stamen Design, under CC BY 3.0. Data by OpenStreetMap, under ODbL.

This effect can be created using a Single Symbol renderer with a marker symbol with two symbol layers: one layer serves as the highlights layer (pink) while the second layer represents the traces (green) which linger after the highlights disappear. Feature blending is used to achieve the desired effect for overlapping markers.

Screenshot 2015-05-06 23.52.40

The highlights layer has two expression-based properties: color and size. The color fades to white and the point size shrinks as the point ages. The age can be computed by comparing the point’s t_datetime timestamp to the Time Manager animation time $animation_datetime.

This expression creates the color fading effect:

color_hsv(  
  311,
  scale_exp( 
    minute(age($animation_datetime,"t_datetime")),
    0,60,
    100,0,
    0.2
  ),
  90
)

and this expression makes the point size shrink:

scale_exp( 
  minute(age($animation_datetime,"t_datetime")),
  0,60,
  24,0,
  0.2
)

Outlook

I’m currently preparing this and a couple of other examples for my Time Manager workshop at the upcoming 1st QGIS conference in Nødebo. The workshop materials will be made available online afterwards.

Literature

[1] Yu Zheng, Lizhu Zhang, Xing Xie, Wei-Ying Ma. Mining interesting locations and travel sequences from GPS trajectories. In Proceedings of International conference on World Wild Web (WWW 2009), Madrid Spain. ACM Press: 791-800.
[2] Yu Zheng, Quannan Li, Yukun Chen, Xing Xie, Wei-Ying Ma. Understanding Mobility Based on GPS Data. In Proceedings of ACM conference on Ubiquitous Computing (UbiComp 2008), Seoul, Korea. ACM Press: 312-321.
[3] Yu Zheng, Xing Xie, Wei-Ying Ma, GeoLife: A Collaborative Social Networking Service among User, location and trajectory. Invited paper, in IEEE Data Engineering Bulletin. 33, 2, 2010, pp. 32-40.


Time Manager 1.6 – now with feature interpolation

Over the last couple of weeks, Karolina has been very busy improving and expanding Time Manager. This post is to announce the 1.6 release of Time Manager which brings you many fixes and exciting new features.

Screenshot 2015-03-25 17.58.38

What’s this feature interpolation you’re talking about?

Interpolation is really helpful if you have multiple observations of the same (moving) real-world object at different points in time and you want to visualize the movement between the observations. This can be used to visualize animal paths, vehicle tracks, or any other movement in space.

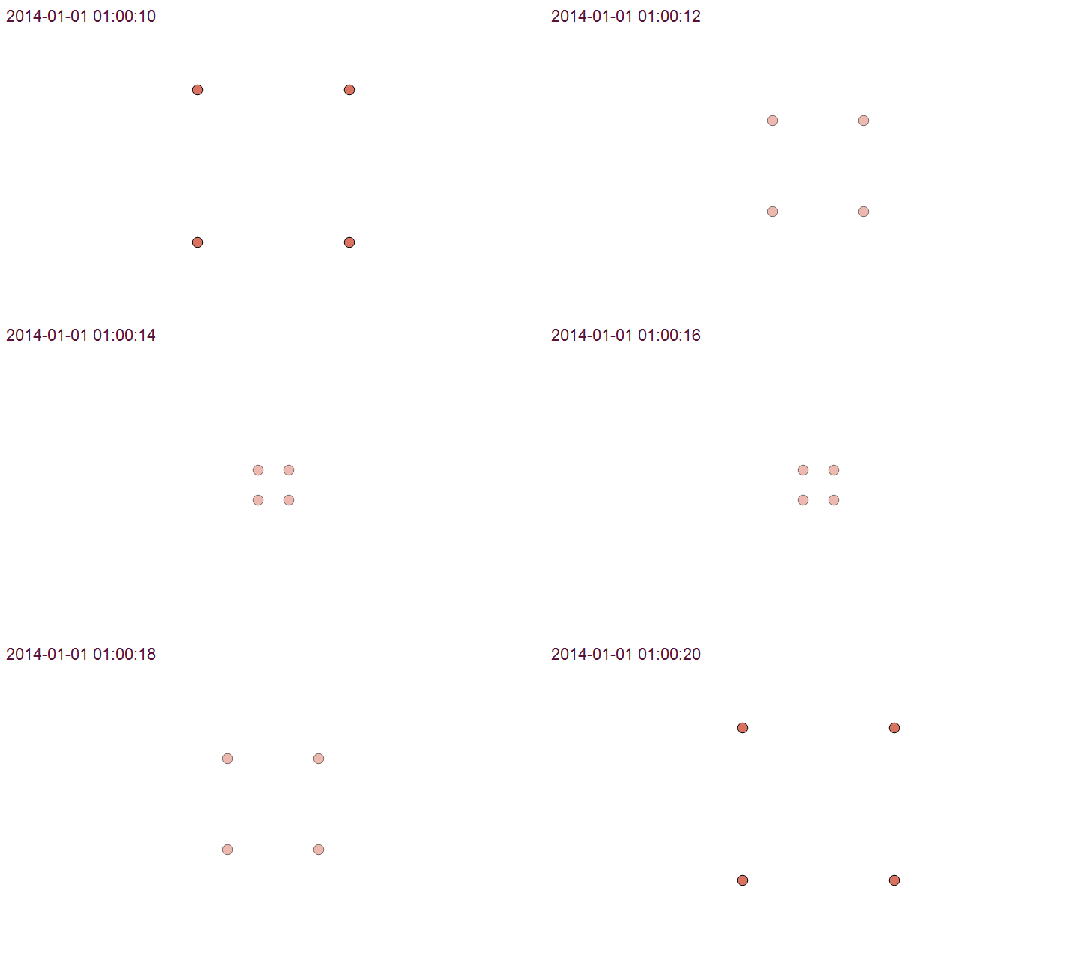
The following example shows a simple layer which contains 12 point features (3 for each id value).

Screenshot 2015-03-25 17.50.55

Using Time Manager interpolation, it is easy to create animations with interpolated positions between observations:

animation

How is it done?

When you open the Time Manager 1.6 Settings | Add layer dialog, you will find a new option for interpolation settings. This first version supports linear interpolation of point features but more options might be added in the future. Note how the id attribute is specified to let Time Manager know which features belong to the same real-world object.

Screenshot 2015-03-25 17.43.08

For the interpolation, Time Manager creates a new layer which contains the interpolated features. You can see this layer in the layer list.

Screenshot 2015-03-25 17.46.13

I’m really looking forward to seeing all the great animations this feature will enable. Thanks Karolina for making this possible!


Back to Top

Sustaining Members