Related Plugins and Tags

QGIS Planet

Detecting close encounters using MobilityDB 1.0

It’s been a while since we last talked about MobilityDB in 2019 and 2020. Since then, the project has come a long way. It joined OSGeo as a community project and formed a first PSC, including the project founders Mahmoud Sakr and Esteban Zimányi as well as Vicky Vergara (of pgRouting fame) and yours truly.

This post is a quick teaser tutorial from zero to computing closest points of approach (CPAs) between trajectories using MobilityDB.

Setting up MobilityDB with Docker

The easiest way to get started with MobilityDB is to use the ready-made Docker container provided by the project. I’m using Docker and WSL (Windows Subsystem Linux on Windows 10) here. Installing WLS/Docker is out of scope of this post. Please refer to the official documentation for your operating system.

Once Docker is ready, we can pull the official container and fire it up:

docker pull mobilitydb/mobilitydb
docker volume create mobilitydb_data
docker run --name "mobilitydb" -d -p 25432:5432 -v mobilitydb_data:/var/lib/postgresql mobilitydb/mobilitydb
psql -h localhost -p 25432 -d mobilitydb -U docker

Currently, the container provides PostGIS 3.2 and MobilityDB 1.0:

Loading movement data into MobilityDB

Once the container is running, we can already connect to it from QGIS. This is my preferred way to load data into MobilityDB because we can simply drag-and-drop any timestamped point layer into the database:

For this post, I’m using an AIS data sample in the region of Gothenburg, Sweden.

After loading this data into a new table called ais, it is necessary to remove duplicate and convert timestamps:

CREATE TABLE AISInputFiltered AS
SELECT DISTINCT ON("MMSI","Timestamp") *
FROM ais;

ALTER TABLE AISInputFiltered ADD COLUMN t timestamp;
UPDATE AISInputFiltered SET t = "Timestamp"::timestamp;

Afterwards, we can create the MobilityDB trajectories:

CREATE TABLE Ships AS
SELECT "MMSI" mmsi,
tgeompoint_seq(array_agg(tgeompoint_inst(Geom, t) ORDER BY t)) AS Trip,
tfloat_seq(array_agg(tfloat_inst("SOG", t) ORDER BY t) FILTER (WHERE "SOG" IS NOT NULL) ) AS SOG,
tfloat_seq(array_agg(tfloat_inst("COG", t) ORDER BY t) FILTER (WHERE "COG" IS NOT NULL) ) AS COG
FROM AISInputFiltered
GROUP BY "MMSI";

ALTER TABLE Ships ADD COLUMN Traj geometry;
UPDATE Ships SET Traj = trajectory(Trip);

Once this is done, we can load the resulting Ships layer and the trajectories will be loaded as lines:

Computing closest points of approach

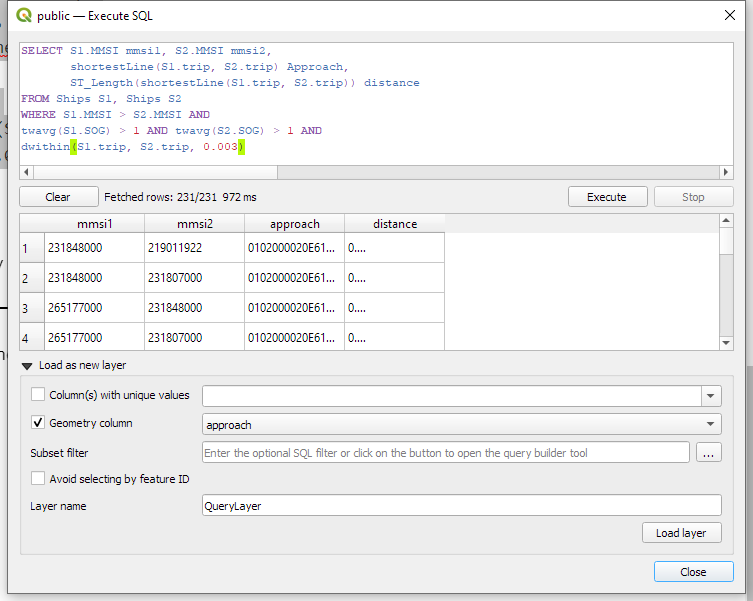
To compute the closest point of approach between two moving objects, MobilityDB provides a shortestLine function. To be correct, this function computes the line connecting the nearest approach point between the two tgeompoint_seq. In addition, we can use the time-weighted average function twavg to compute representative average movement speeds and eliminate stationary or very slowly moving objects:

SELECT S1.MMSI mmsi1, S2.MMSI mmsi2, 
       shortestLine(S1.trip, S2.trip) Approach,
       ST_Length(shortestLine(S1.trip, S2.trip)) distance
FROM Ships S1, Ships S2
WHERE S1.MMSI > S2.MMSI AND
twavg(S1.SOG) > 1 AND twavg(S2.SOG) > 1 AND
dwithin(S1.trip, S2.trip, 0.003)

In the QGIS Browser panel, we can right-click the MobilityDB connection to bring up an SQL input using Execute SQL:

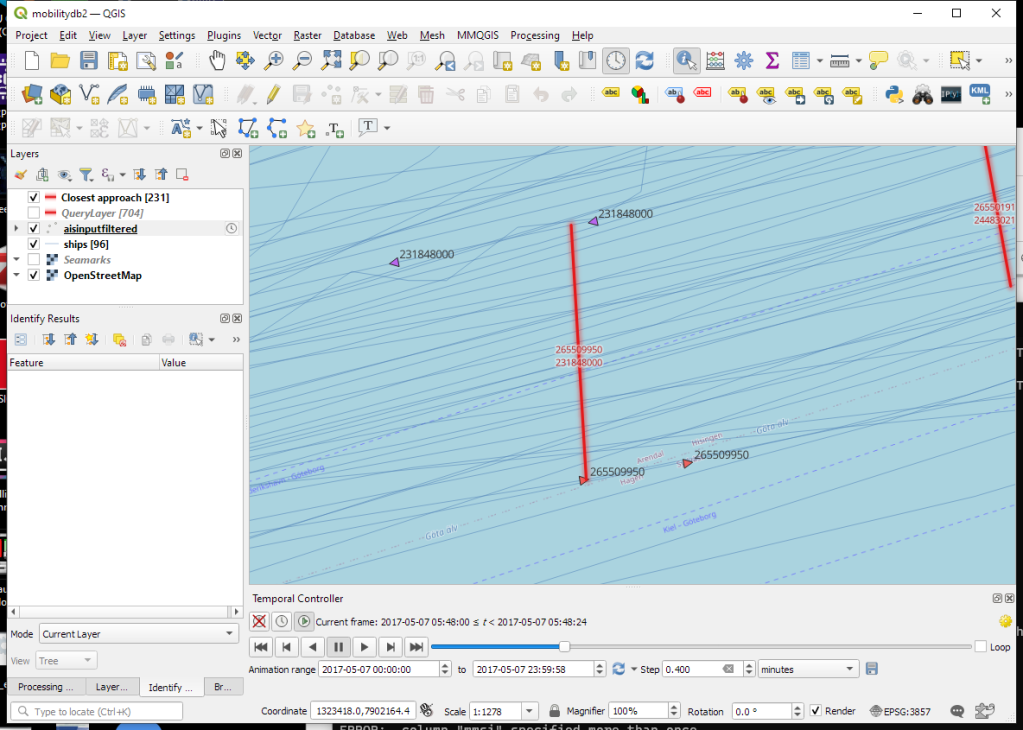
The resulting query layer shows where moving objects get close to each other:

To better see what’s going on, we’ll look at individual CPAs:

Having a closer look with the Temporal Controller

Since our filtered AIS layer has proper timestamps, we can animate it using the Temporal Controller. This enables us to replay the movement and see what was going on in a certain time frame.

I let the animation run and stopped it once I spotted a close encounter. Looking at the AIS points and the shortest line, we can see that MobilityDB computed the CPAs along the trajectories:

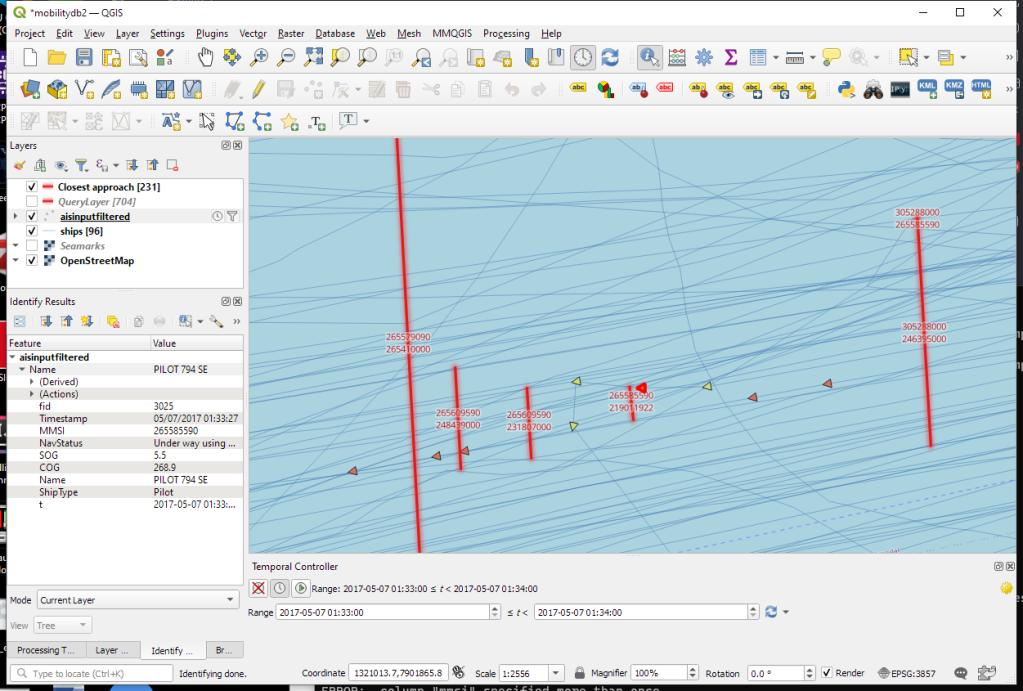
A more targeted way to investigate a specific CPA is to use the Temporal Controllers’ fixed temporal range mode to jump to a specific time frame. This is helpful if we already know the time frame we are interested in. For the CPA use case, this means that we can look up the timestamp of a nearby AIS position and set up the Temporal Controller accordingly:

More

I hope you enjoyed this quick dive into MobilityDB. For more details, including talks by the project founders, check out the project website.


This post is part of a series. Read more about movement data in GIS.

Inscribed and bounding circles in PostGIS

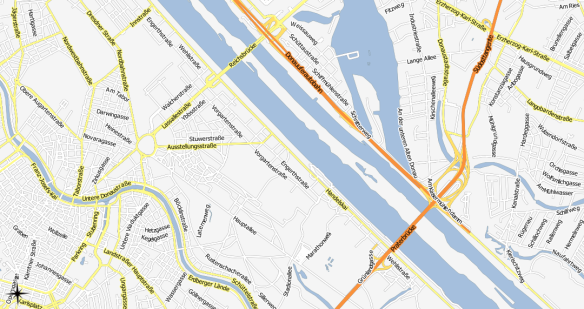
Today, I’m revisiting work from 2017. In Brezina, Graser & Leth (2017), we looked at different ways to determine the width of sidewalks in Vienna based on the city’s street surface database.

Image source: Brezina, Graser & Leth (2017)

Inscribed and circumscribed circles were a natural starting point. Circumscribed or bounding circle tools (the smallest circle to enclose an input polygon) have been commonly available in desktop GIS and spatial databases. Inscribed circle tools (the largest circle that fits into an input polygon) used to be less readily available. Lately, support has improved since ST_MaximumInscribedCircle has been added in PostGIS 3.1.0 (requires GEOS >= 3.9.0).

The tricky thing is that ST_MaximumInscribedCircle does not behave like ST_MinimumBoundingCircle. While the bounding circle function returns the circle geometry, the inscribed circle function returns a record containing information on the circle center and radius. Handling the resulting records involves some not so intuitive SQL.

Here is what I’ve come up with to get both the circle geometries as well as the radius values:

WITH foo AS 
(
	SELECT id, 
		ST_MaximumInscribedCircle(geom) AS inscribed_circle,
		ST_MinimumBoundingRadius(geom) AS bounding_circle
	FROM demo.sidewalks 
)
SELECT
	id,
	(bounding_circle).radius AS bounding_circle_radius,
	ST_MinimumBoundingCircle(geom) AS bounding_circle_geom, 
	(inscribed_circle).radius AS inscribed_circle_radius,
	ST_Buffer((inscribed_circle).center, (inscribed_circle).radius) AS inscribed_circle_geom
FROM foo

And here is how the results look like in QGIS, with purple shapeburst fills for bounding circles and green shapeburst fills for inscribed circles:

References

Brezina, T., Graser, A., & Leth, U. (2017). Geometric methods for estimating representative sidewalk widths applied to Vienna’s streetscape surfaces database. Journal of Geographical Systems, 19(2), 157-174, doi:10.1007/s10109-017-0245-2.

Movement data in GIS #29: power your web apps with movement data using mobilitydb-sqlalchemy

This is a guest post by Bommakanti Krishna Chaitanya @chaitan94

Introduction

This post introduces mobilitydb-sqlalchemy, a tool I’m developing to make it easier for developers to use movement data in web applications. Many web developers use Object Relational Mappers such as SQLAlchemy to read/write Python objects from/to a database.

Mobilitydb-sqlalchemy integrates the moving objects database MobilityDB into SQLAlchemy and Flask. This is an important step towards dealing with trajectory data using appropriate spatiotemporal data structures rather than plain spatial points or polylines.

To make it even better, mobilitydb-sqlalchemy also supports MovingPandas. This makes it possible to write MovingPandas trajectory objects directly to MobilityDB.

For this post, I have made a demo application which you can find live at https://mobilitydb-sqlalchemy-demo.adonmo.com/. The code for this demo app is open source and available on GitHub. Feel free to explore both the demo app and code!

In the following sections, I will explain the most important parts of this demo app, to show how to use mobilitydb-sqlalchemy in your own webapp. If you want to reproduce this demo, you can clone the demo repository and do a “docker-compose up –build” as it automatically sets up this docker image for you along with running the backend and frontend. Just follow the instructions in README.md for more details.

Declaring your models

For the demo, we used a very simple table – with just two columns – an id and a tgeompoint column for the trip data. Using mobilitydb-sqlalchemy this is as simple as defining any regular table:

from flask_sqlalchemy import SQLAlchemy
from mobilitydb_sqlalchemy import TGeomPoint

db = SQLAlchemy()

class Trips(db.Model):
   __tablename__ = "trips"
   trip_id = db.Column(db.Integer, primary_key=True)
   trip = db.Column(TGeomPoint)

Note: The library also allows you to use the Trajectory class from MovingPandas as well. More about this is explained later in this tutorial.

Populating data

When adding data to the table, mobilitydb-sqlalchemy expects data in the tgeompoint column to be a time indexed pandas dataframe, with two columns – one for the spatial data  called “geometry” with Shapely Point objects and one for the temporal data “t” as regular python datetime objects.

from datetime import datetime
from shapely.geometry import Point

# Prepare and insert the data
# Typically it won’t be hardcoded like this, but it might be coming from 
# other data sources like a different database or maybe csv files
df = pd.DataFrame(
   [
       {"geometry": Point(0, 0), "t": datetime(2012, 1, 1, 8, 0, 0),},
       {"geometry": Point(2, 0), "t": datetime(2012, 1, 1, 8, 10, 0),},
       {"geometry": Point(2, -1.9), "t": datetime(2012, 1, 1, 8, 15, 0),},
   ]
).set_index("t")

trip = Trips(trip_id=1, trip=df)
db.session.add(trip)
db.session.commit()

Writing queries

In the demo, you see two modes. Both modes were designed specifically to explain how functions defined within MobilityDB can be leveraged by our webapp.

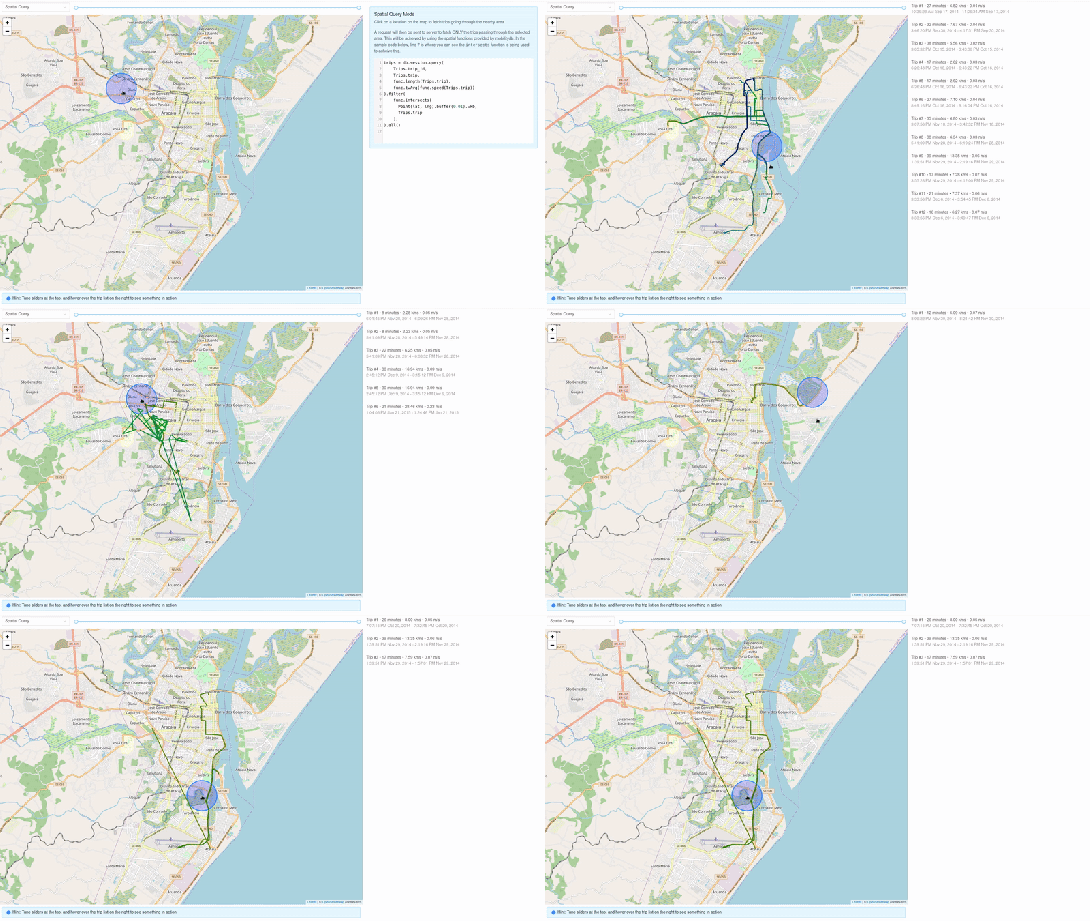
1. All trips mode – In this mode, we extract all trip data, along with distance travelled within each trip, and the average speed in that trip, both computed by MobilityDB itself using the ‘length’, ‘speed’ and ‘twAvg’ functions. This example also shows that MobilityDB functions can be chained to form more complicated queries.

mobilitydb-sqlalchemy-demo-1

trips = db.session.query(
   Trips.trip_id,
   Trips.trip,
   func.length(Trips.trip),
   func.twAvg(func.speed(Trips.trip))
).all()

2. Spatial query mode – In this mode, we extract only selective trip data, filtered by a user-selected region of interest. We then make a query to MobilityDB to extract only the trips which pass through the specified region. We use MobilityDB’s ‘intersects’ function to achieve this filtering at the database level itself.

mobilitydb-sqlalchemy-demo-2

trips = db.session.query(
   Trips.trip_id,
   Trips.trip,
   func.length(Trips.trip),
   func.twAvg(func.speed(Trips.trip))
).filter(
   func.intersects(Point(lat, lng).buffer(0.01).wkb, Trips.trip),
).all()

Using MovingPandas Trajectory objects

Mobilitydb-sqlalchemy also provides first-class support for MovingPandas Trajectory objects, which can be installed as an optional dependency of this library. Using this Trajectory class instead of plain DataFrames allows us to make use of much richer functionality over trajectory data like analysis speed, interpolation, splitting and simplification of trajectory points, calculating bounding boxes, etc. To make use of this feature, you have set the use_movingpandas flag to True while declaring your model, as shown in the below code snippet.

class TripsWithMovingPandas(db.Model):
   __tablename__ = "trips"
   trip_id = db.Column(db.Integer, primary_key=True)
   trip = db.Column(TGeomPoint(use_movingpandas=True))

Now when you query over this table, you automatically get the data parsed into Trajectory objects without having to do anything else. This also works during insertion of data – you can directly assign your movingpandas Trajectory objects to the trip column. In the below code snippet we show how inserting and querying works with movingpandas mode.

from datetime import datetime
from shapely.geometry import Point

# Prepare and insert the data
# Typically it won’t be hardcoded like this, but it might be coming from 
# other data sources like a different database or maybe csv files
df = pd.DataFrame(
   [
       {"geometry": Point(0, 0), "t": datetime(2012, 1, 1, 8, 0, 0),},
       {"geometry": Point(2, 0), "t": datetime(2012, 1, 1, 8, 10, 0),},
       {"geometry": Point(2, -1.9), "t": datetime(2012, 1, 1, 8, 15, 0),},
   ]
).set_index("t")

geo_df = GeoDataFrame(df)
traj = mpd.Trajectory(geo_df, 1)

trip = Trips(trip_id=1, trip=traj)
db.session.add(trip)
db.session.commit()

# Querying over this table would automatically map the resulting tgeompoint 
# column to movingpandas’ Trajectory class
result = db.session.query(TripsWithMovingPandas).filter(
   TripsWithMovingPandas.trip_id == 1
).first()

print(result.trip.__class__)
# <class 'movingpandas.trajectory.Trajectory'>

Bonus: trajectory data serialization

Along with mobilitydb-sqlalchemy, recently I have also released trajectory data serialization/compression libraries based on Google’s Encoded Polyline Format Algorithm, for python and javascript called trajectory and trajectory.js respectively. These libraries let you send trajectory data in a compressed format, resulting in smaller payloads if sending your data through human-readable serialization formats like JSON. In some of the internal APIs we use at Adonmo, we have seen this reduce our response sizes by more than half (>50%) sometimes upto 90%.

Want to learn more about mobilitydb-sqlalchemy? Check out the quick start & documentation.


This post is part of a series. Read more about movement data in GIS.

Movement data in GIS #25: moving object databases

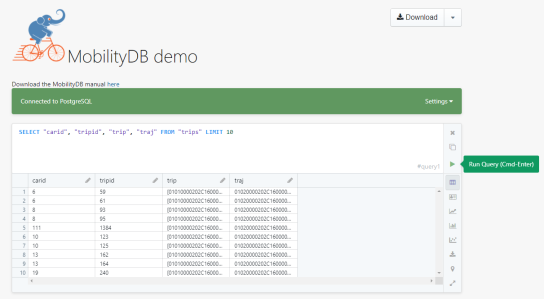
Recently there has been some buzz on Twitter about a new moving object database (MOD) called MobilityDB that builds on PostgreSQL and PostGIS (Zimányi et al. 2019). The MobilityDB Github repo has been published in February 2019 but according to the following presentation at PgConf.Russia 2019 it has been under development for a few years:

Of course, moving object databases have been around for quite a while. The two most commonly cited MODs are HermesDB (Pelekis et al. 2008) which comes as an extension for either PostgreSQL or Oracle and is developed at the University of Piraeus and SECONDO (de Almeida et al. 2006) which is a stand-alone database system developed at the Fernuniversität Hagen. However, both MODs remain at the research prototype level and have not achieved broad adoption.

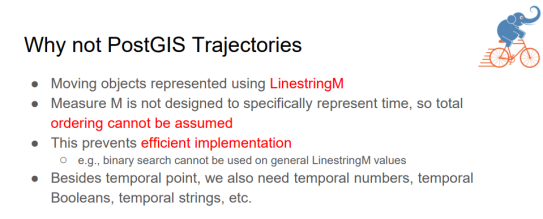
It will be interesting to see if MobilityDB will be able to achieve the goal they have set in the title of Zimányi et al. (2019) to become “a mainstream moving object database system”. It’s promising that they are building on PostGIS and using its mature spatial analysis functionality instead of reinventing the wheel. They also discuss why they decided that PostGIS trajectories (which I’ve written about in previous posts) are not the way to go:

However, the presentation does not go into detail whether there are any straightforward solutions to visualizing data stored in MobilityDB.

According to the Github readme, MobilityDB runs on Linux and needs PostGIS 2.5. They also provide an online demo as well as a Docker container with MobilityDB and all its dependencies. If you give it a try, I would love to hear about your experiences.

References

  • de Almeida, V. T., Guting, R. H., & Behr, T. (2006). Querying moving objects in secondo. In 7th International Conference on Mobile Data Management (MDM’06) (pp. 47-47). IEEE.
  • Pelekis, N., Frentzos, E., Giatrakos, N., & Theodoridis, Y. (2008). HERMES: aggregative LBS via a trajectory DB engine. In Proceedings of the 2008 ACM SIGMOD international conference on Management of data (pp. 1255-1258). ACM.
  • Zimányi, E., Sakr, M., Lesuisse, A., & Bakli, M. (2019). MobilityDB: A Mainstream Moving Object Database System. In Proceedings of the 16th International Symposium on Spatial and Temporal Databases (pp. 206-209). ACM.

This post is part of a series. Read more about movement data in GIS.

Movement data in GIS #23: trajectories in context

Today’s post continues where “Why you should be using PostGIS trajectories” leaves off. It’s the result of a collaboration with Eva Westermeier. I had the pleasure to supervise her internship at AIT last year and also co-supervised her Master’s thesis [0] on the topic of enriching trajectories with information about their geographic context.

Context-aware analysis of movement data is crucial for different domains and applications, from transport to ecology. While there is a wealth of data, efficient and user-friendly contextual trajectory analysis is still hampered by a lack of appropriate conceptual approaches and practical methods. (Westermeier, 2018)

Part of the work was focused on evaluating different approaches to adding context information from vector datasets to trajectories in PostGIS. For example, adding land cover context to animal movement data or adding information on anchoring and harbor areas to vessel movement data.

Classic point-based model vs. line-based model

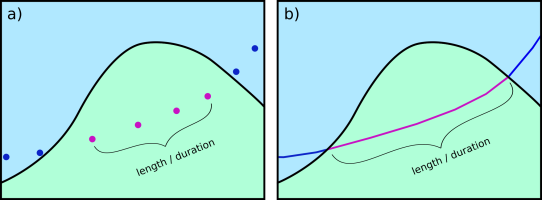
The obvious approach is to intersect the trajectory points with context data. This is the classic point data model of contextual trajectories. It’s straightforward to add context information in the point-based model but it also generates large numbers of repeating annotations. In contrast, the line data model using, for example, PostGIS trajectories (LinestringM) is more compact since trajectories can be split into segments at context borders. This creates one annotation per segment and the individual segments are convenient to analyze (as described in part #12).

Spatio-temporal interpolation as provided by the line data model offers additional advantages for the analysis of annotated segments. Contextual segments start and end at the intersection of the trajectory linestring with context polygon borders. This means that there are no gaps like in the point-based model. Consequently, while the point-based model systematically underestimates segment length and duration, the line-based approach offers more meaningful segment length and duration measurements.

Schematic illustration of a subset of an annotated trajectory in two context classes, a) systematic underestimation of length or duration in the point data model, b) full length or duration between context polygon borders in the line data model (source: Westermeier (2018))

Another issue of the point data model is that brief context changes may be missed or represented by just one point location. This makes it impossible to compute the length or duration of the respective context segment. (Of course, depending on the application, it can be desirable to ignore brief context changes and make the annotation process robust towards irrelevant changes.)

Schematic illustration of context annotation for brief context changes, a) and b)
two variants for the point data model, c) gapless annotation in the line data model (source: Westermeier (2018) based on Buchin et al. (2014))

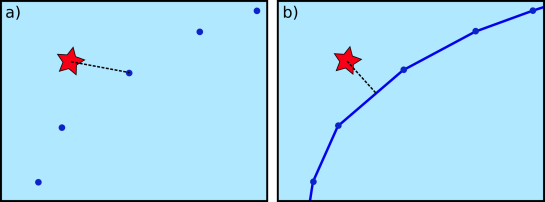
Beyond annotations, context can also be considered directly in an analysis, for example, when computing distances between trajectories and contextual point objects. In this case, the point-based approach systematically overestimates the distances.

Schematic illustration of distance measurement from a trajectory to an external
object, a) point data model, b) line data model (source: Westermeier (2018))

The above examples show that there are some good reasons to dump the classic point-based model. However, the line-based model is not without its own issues.

Issues

Computing the context annotations for trajectory segments is tricky. The main issue is that ST_Intersection drops the M values. This effectively destroys our trajectories! There are ways to deal with this issue – and the corresponding SQL queries are published in the thesis (p. 38-40) – but it’s a real bummer. Basically, ST_Intersection only provides geometric output. Therefore, we need to reconstruct the temporal information in order to create usable trajectory segments.

Finally, while the line-based model is well suited to add context from other vector data, it is less useful for context data from continuous rasters but that was beyond the scope of this work.

Conclusion

After the promising results of my initial investigations into PostGIS trajectories, I was optimistic that context annotations would be a straightforward add-on. The line-based approach has multiple advantages when it comes to analyzing contextual segments. Unfortunately, generating these contextual segments is much less convenient and also slower than I had hoped. Originally, I had planned to turn this work into a plugin for the Processing toolbox but the results of this work motivated me to look into other solutions. You’ve already seen some of the outcomes in part #20 “Trajectools v1 released!”.

References

[0] Westermeier, E.M. (2018). Contextual Trajectory Modeling and Analysis. Master Thesis, Interfaculty Department of Geoinformatics, University of Salzburg.


This post is part of a series. Read more about movement data in GIS.

Movement data in GIS #15: writing a PL/pgSQL stop detection function for PostGIS trajectories

Do you sometimes start writing an SQL query and around at line 50 you get the feeling that it might be getting out of hand? If so, it might be useful to start breaking it down into smaller chunks and wrap those up into custom functions. Never done that? Don’t despair! There’s an excellent PL/pgSQL tutorial on postgresqltutorial.com to get you started.

To get an idea of the basic structure of a PL/pgSQL function and to proof that PostGIS datatypes work just fine in this context, here’s a basic function that takes a trajectory geometry and outputs its duration, i.e. the difference between its last and first timestamp:

CREATE OR REPLACE FUNCTION AG_Duration(traj geometry) 
RETURNS numeric LANGUAGE 'plpgsql'
AS $BODY$ 
BEGIN
RETURN ST_M(ST_EndPoint(traj))-ST_M(ST_StartPoint(traj));
END; $BODY$;

My end goal for this exercise was to implement a function that takes a trajectory and outputs the stops along this trajectory. Commonly, a stop is defined as a long stay within an area with a small radius. This leads us to the following definition:

CREATE OR REPLACE FUNCTION AG_DetectStops(
   traj geometry, 
   max_size numeric, 
   min_duration numeric)
RETURNS TABLE(sequence integer, geom geometry) 
-- implementation follows here!

Note how this function uses RETURNS TABLE to enable it to return all the stops that it finds. To add a line to the output table, we need to assign values to the sequence and geom variables and then use RETURN NEXT.

Another reason to use PL/pgSQL is that it enables us to write loops. And loops I wanted for my stop detection function! Specifically, I wanted to go through all the points in the trajectory:

FOR pt IN SELECT (ST_DumpPoints(traj)).geom LOOP
-- here comes the magic!
END LOOP;

Eventually the function should go through the trajectory and identify all segments that stay within an area with max_size diameter for at least min_duration time. To test for the area size, we can use:

IF ST_MaxDistance(segment,pt) <= max_size THEN is_stop := true; 

Putting everything together, my current implementation looks like this:

CREATE OR REPLACE FUNCTION AG_DetectStops(
   traj geometry,
   max_size numeric,
   min_duration numeric)
RETURNS TABLE(sequence integer, geom geometry) 
LANGUAGE 'plpgsql'
AS $BODY$
DECLARE 
   pt geometry;
   segment geometry;
   is_stop boolean;
   previously_stopped boolean;
   stop_sequence integer;
   p1 geometry;
BEGIN
segment := NULL;
sequence := 0;
is_stop := false;
previously_stopped := false;
p1 := NULL;
FOR pt IN SELECT (ST_DumpPoints(traj)).geom LOOP
   IF segment IS NULL AND p1 IS NULL THEN 
      p1 := pt; 
   ELSIF segment IS NULL THEN 
      segment := ST_MakeLine(p1,pt); 
      p1 := NULL;
      IF ST_Length(segment) <= max_size THEN is_stop := true; END IF; ELSE segment := ST_AddPoint(segment,pt); -- if we're in a stop, we want to grow the segment, otherwise we remove points to the specified min_duration IF NOT is_stop THEN WHILE ST_NPoints(segment) > 2 AND AG_Duration(ST_RemovePoint(segment,0)) >= min_duration LOOP
            segment := ST_RemovePoint(segment,0); 
         END LOOP;
      END IF;
      -- a stop is identified if the segment stays within a circle of diameter = max_size
      IF ST_Length(segment) <= max_size THEN is_stop := true; ELSIF ST_Distance(ST_StartPoint(segment),pt) > max_size THEN is_stop := false;
      ELSIF ST_MaxDistance(segment,pt) <= max_size THEN is_stop := true; ELSE is_stop := false; END IF; -- if we found the end of a stop, we need to check if it lasted long enough IF NOT is_stop AND previously_stopped THEN IF ST_M(ST_PointN(segment,ST_NPoints(segment)-1))-ST_M(ST_StartPoint(segment)) >= min_duration THEN
            geom := ST_RemovePoint(segment,ST_NPoints(segment)-1); 
            RETURN NEXT;
            sequence := sequence + 1;
            segment := NULL;
            p1 := pt;
         END IF;
      END IF;
   END IF;
   previously_stopped := is_stop;
END LOOP;
IF previously_stopped AND AG_Duration(segment) >= min_duration THEN 
   geom := segment; 
   RETURN NEXT; 
END IF;
END; $BODY$;

While this function is not really short, it’s so much more readable than my previous attempts of doing this in pure SQL. Some of the lines for determining is_stop are not strictly necessary but they do speed up processing.

Performance still isn’t quite where I’d like it to be. I suspect that all the adding and removing points from linestring geometries is not ideal. In general, it’s quicker to find shorter stops in smaller areas than longer stop in bigger areas.

Let’s test! 

Looking for a testing framework for PL/pgSQL, I found plpgunit on Github. While I did not end up using it, I did use its examples for inspiration to write a couple of tests, e.g.

CREATE OR REPLACE FUNCTION test.stop_at_beginning() RETURNS void LANGUAGE 'plpgsql'
AS $BODY$
DECLARE t0 integer; n0 integer;
BEGIN
WITH temp AS ( SELECT AG_DetectStops(
   ST_GeometryFromText('LinestringM(0 0 0, 0 0 1, 0.1 0.1 2, 2 2 3)'),
   1,1) stop 
)
SELECT ST_M(ST_StartPoint((stop).geom)), 
       ST_NPoints((stop).geom) FROM temp INTO t0, n0;	
IF t0 = 0 AND n0 = 3
   THEN RAISE INFO 'PASSED - Stop at the beginning of the trajectory';
   ELSE RAISE INFO 'FAILED - Stop at the beginning of the trajectory';
END IF;
END; $BODY$;

Basically, each test is yet another PL/pgSQL function that doesn’t return anything (i.e. returns void) but outputs messages about the status of the test. Here I made heavy use of the PERFORM statement which executes the provided function but discards the results:


Update: The source code for this function is now available on https://github.com/anitagraser/postgis-spatiotemporal

Movement data in GIS #12: why you should be using PostGIS trajectories

In short: both writing trajectory queries as well as executing them is considerably faster using PostGIS trajectories (as LinestringM) rather than the commonly used point-based approach.

Here are a couple of examples to give you an impression of the differences.

Spoiler alert! Trajectory queries are up to 500 times faster than comparable point-based queries.

A quick look at indexing

In both cases, we have indexed the tracker id, geometry, and time columns to speed up query processing.

The trajectory table has 3 indexes

  • gist (time_range)
  • gist (track gist_geometry_ops_nd)
  • btree (tracker)

The point-based table has 4 indexes

  • gist (pt)
  • btree (trajectory_id)
  • btree (tracker)
  • btree (t)

Length

First, let’s see how to determine trajectory length for all observed moving objects (identified by a tracker id).

Using the point-based approach, we first need to ensure that the points are in the correct temporal order, create the lines, and finally sum up their length:

WITH ordered AS (
 SELECT trajectory_id, tracker, t, pt
 FROM geolife.trajectory_pt
 ORDER BY t
), tmp AS (
 SELECT trajectory_id, tracker, st_makeline(pt) traj
 FROM ordered 
 GROUP BY trajectory_id, tracker
)
SELECT tracker, round(sum(ST_Length(traj::geography)))
FROM tmp
GROUP BY tracker 
ORDER BY tracker

With trajectories, we can go right to computing lengths:

SELECT tracker, round(sum(ST_Length(track::geography)))
FROM geolife.trajectory_ext
GROUP BY tracker
ORDER BY tracker

On my test system, the trajectory query run time is 22.7 sec instead of 43.0 sec for the point-based approach:

Duration

Compared to trajectory length, duration is less complicated in the point-based approach:

WITH tmp AS (
 SELECT trajectory_id, tracker, min(t) start_time, max(t) end_time
 FROM geolife.trajectory_pt
 GROUP BY trajectory_id, tracker
)
SELECT tracker, sum(end_time - start_time)
FROM tmp
GROUP BY tracker
ORDER BY tracker

Still, the trajectory query is less complex and much faster at 31 ms instead of 6.0 sec:

SELECT tracker, sum(upper(time_range) - lower(time_range))
FROM geolife.trajectory_ext
GROUP BY tracker
ORDER BY tracker

Temporal filter

Extracting trajectories that occurred during a certain time frame is another common use case:

WITH tmp AS (
 SELECT trajectory_id, tracker, min(t) start_time, max(t) end_time
 FROM geolife.trajectory_pt
 GROUP BY trajectory_id, tracker
)
SELECT trajectory_id, tracker, start_time, end_time
FROM tmp
WHERE end_time > '2008-11-26 11:00'
AND start_time < '2008-11-26 15:00'
ORDER BY tracker

This point-based query takes 6.0 sec while the shorter trajectory query finishes in 12 ms:

SELECT id, tracker, time_range
FROM geolife.trajectory_ext
WHERE time_range && '[2008-11-26 11:00+1,2008-11-26 15:00+01]'::tstzrange

or equally fast (12 ms) by making use of the n-dimensional index:

WHERE track &&&	ST_Collect(
 ST_MakePointM(-180, -90, extract(epoch from '2008-11-26 11:00'::timestamptz)),
 ST_MakePointM(180, 90, extract(epoch from '2008-11-26 15:00'::timestamptz))
)

Spatial filter

Finally, of course, let’s have a look at spatial filters, for example, trajectories that start in a certain area:

WITH my AS ( 
 SELECT ST_Buffer(ST_SetSRID(ST_MakePoint(116.31894,39.97472),4326),0.0005) areaA
), tmp AS (
 SELECT trajectory_id, tracker, min(t) t 
 FROM geolife.trajectory_pt
 GROUP BY trajectory_id, tracker
)
SELECT distinct traj.tracker, traj.trajectory_id 
FROM tmp
JOIN geolife.trajectory_pt traj
ON tmp.trajectory_id = traj.trajectory_id AND traj.t = tmp.t
JOIN my
ON ST_Within(traj.pt, my.areaA)

This point-based query takes 6.0 sec while the shorter trajectory query finishes in 488 ms:

WITH my AS ( 
 SELECT ST_Buffer(ST_SetSRID(ST_MakePoint(116.31894, 39.97472),4326),0.0005) areaA
)
SELECT id, tracker, ST_AsText(track)
FROM geolife.trajectory_ext
JOIN my
ON areaA && track
AND ST_Within(ST_StartPoint(track), areaA)

For more generic “does this trajectory intersect another geometry”, the points can also be aggregated to a linestring on the fly but that takes 21.9 sec:

I’ll be presenting more work on PostGIS trajectories at GI_Forum in Salzburg in July. In the talk, I’ll also have a look at the custom PG-Trajectory datatype. Here’s the full open-access paper:

Graser, A. (2018) Evaluating Spatio-temporal Data Models for Trajectories in PostGIS Databases. GI_Forum ‒ Journal of Geographic Information Science, 1-2018, 16-33. DOI: 10.1553/giscience2018_01_s16.

You can find my fork of the PG-Trajectory project – including all necessary fixes – on Bitbucket.


This post is part of a series. Read more about movement data in GIS.

Movement data in GIS #10: open tools for AIS tracks from MarineCadastre.gov

MarineCadastre.gov is a great source for AIS data along the US coast. Their data formats and tools though are less open. Luckily, GDAL – and therefore QGIS – can read ESRI File Geodatabases (.gdb).

MarineCadastre.gov also offer a Track Builder script that creates lines out of the broadcast points. (It can also join additional information from the vessel and voyage layers.) We could reproduce the line creation step using tools such as Processing’s Point to path but this post will show how to create PostGIS trajectories instead.

First, we have to import the points into PostGIS using either DB Manager or Processing’s Import into PostGIS tool:

Then we can create the trajectories. I’ve opted to create a materialized view:

The first part of the query creates a temporary table called ptm (short for PointM). This step adds time stamp information to each point. The second part of the query then aggregates these PointMs into trajectories of type LineStringM.

CREATE MATERIALIZED VIEW ais.trajectory AS
 WITH ptm AS (
   SELECT b.mmsi,
     st_makepointm(
       st_x(b.geom), 
       st_y(b.geom), 
       date_part('epoch', b.basedatetime)
     ) AS pt,
     b.basedatetime t
   FROM ais.broadcast b
   ORDER BY mmsi, basedatetime
 )
 SELECT row_number() OVER () AS id,
   st_makeline(ptm.pt) AS st_makeline,
   ptm.mmsi,
   min(ptm.t) AS min_t,
   max(ptm.t) AS max_t
 FROM ptm
 GROUP BY ptm.mmsi
WITH DATA;

The trajectory start and end times (min_t and max_t) are optional but they can help speed up future queries.

One of the advantages of creating trajectory lines is that they render many times faster than the original points.

Of course, we end up with some artifacts at the border of the dataset extent. (Files are split by UTM zone.) Trajectories connect the last known position before the vessel left the observed area with the position of reentry. This results, for example, in vertical lines which you can see in the bottom left corner of the above screenshot.

With the trajectories ready, we can go ahead and start exploring the dataset. For example, we can visualize trajectory speed and/or create animations:

Purple trajectory segments are slow while green segments are faster

We can also perform trajectory analysis, such as trajectory generalization:

This is a first proof of concept. It would be great to have a script that automatically fetches the datasets for a specified time frame and list of UTM zones and loads them into PostGIS for further processing. In addition, it would be great to also make use of the information in the vessel and voyage tables, thus splitting up trajectories into individual voyages.


Read more:

Drive-time Isochrones from a single Shapefile using QGIS, PostGIS, and Pgrouting

This is a guest post by Chris Kohler .

Introduction:

This guide provides step-by-step instructions to produce drive-time isochrones using a single vector shapefile. The method described here involves building a routing network using a single vector shapefile of your roads data within a Virtual Box. Furthermore, the network is built by creating start and end nodes (source and target nodes) on each road segment. We will use Postgresql, with PostGIS and Pgrouting extensions, as our database. Please consider this type of routing to be fair, regarding accuracy, as the routing algorithms are based off the nodes locations and not specific addresses. I am currently working on an improved workflow to have site address points serve as nodes to optimize results. One of the many benefits of this workflow is no financial cost to produce (outside collecting your roads data). I will provide instructions for creating, and using your virtual machine within this guide.

Steps:–Getting Virtual Box(begin)–

Intro 1. Download/Install Oracle VM(https://www.virtualbox.org/wiki/Downloads)

Intro 2. Start the download/install OSGeo-Live 11(https://live.osgeo.org/en/overview/overview.html).

Pictures used in this workflow will show 10.5, though version 11 can be applied similarly. Make sure you download the version: osgeo-live-11-amd64.iso. If you have trouble finding it, here is the direct link to the download (https://sourceforge.net/projects/osgeo-live/files/10.5/osgeo-live-10.5-amd64.iso/download)
Intro 3. Ready for virtual machine creation: We will utilize the downloaded OSGeo-Live 11 suite with a virtual machine we create to begin our workflow. The steps to create your virtual machine are listed below. Also, here are steps from an earlier workshop with additional details with setting up your virtual machine with osgeo live(http://workshop.pgrouting.org/2.2.10/en/chapters/installation.html).

1.  Create Virutal Machine: In this step we begin creating the virtual machine housing our database.

Open Oracle VM VirtualBox Manager and select “New” located at the top left of the window.

VBstep1

Then fill out name, operating system, memory, etc. to create your first VM.

vbstep1.2

2. Add IDE Controller:  The purpose of this step is to create a placeholder for the osgeo 11 suite to be implemented. In the virtual box main window, right-click your newly-created vm and open the settings.

vbstep2

In the settings window, on the left side select the storage tab.

Find “adds new storage controller button located at the bottom of the tab. Be careful of other buttons labeled “adds new storage attachment”! Select “adds new storage controller button and a drop-down menu will appear. From the top of the drop-down select “Add IDE Controller”.

vbstep2.2

vbstep2.3

You will see a new item appear in the center of the window under the “Storage Tree”.

3.  Add Optical Drive: The osgeo 11 suite will be implemented into the virtual machine via an optical drive. Highlight the new controller IDE you created and select “add optical drive”.

vbstep3

A new window will pop-up and select “Choose Disk”.

vbstep3.2

Locate your downloaded file “osgeo-live 11 amd64.iso” and click open. A new object should appear in the middle window under your new controller displaying “osgeo-live-11.0-amd64.iso”.

vbstep3.3

Finally your virtual machine is ready for use.
Start your new Virtual Box, then wait and follow the onscreen prompts to begin using your virtual machine.
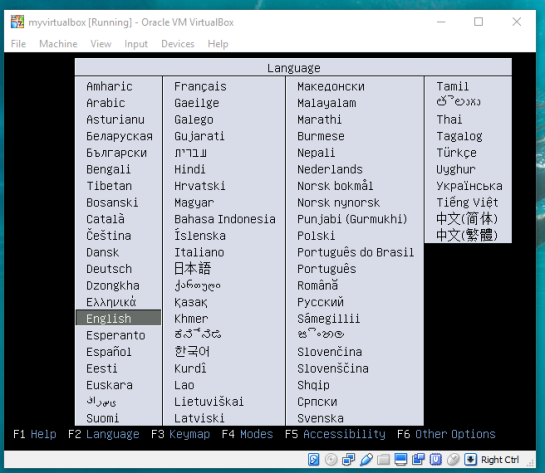
vbstep3.4

–Getting Virtual Box(end)—

4. Creating the routing database, and both extensions (postgis, pgrouting): The database we create and both extensions we add will provide the functions capable of producing isochrones.

To begin, start by opening the command line tool (hold control+left-alt+T) then log in to postgresql by typing “psql -U user;” into the command line and then press Enter. For the purpose of clear instruction I will refer to database name in this guide as “routing”, feel free to choose your own database name. Please input the command, seen in the figure below, to create the database:

CREATE DATABASE routing;

You can use “\c routing” to connect to the database after creation.

step4

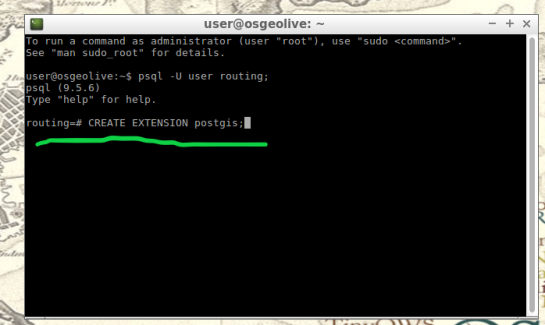
The next step after creating and connecting to your new database is to create both extensions. I find it easier to take two-birds-with-one-stone typing “psql -U user routing;” this will simultaneously log you into postgresql and your routing database.

When your logged into your database, apply the commands below to add both extensions

CREATE EXTENSION postgis;
CREATE EXTENSION pgrouting;
step4.2

step4.3

5. Load shapefile to database: In this next step, the shapefile of your roads data must be placed into your virtual machine and further into your database.

My method is using email to send myself the roads shapefile then download and copy it from within my virtual machines web browser. From the desktop of your Virtual Machine, open the folder named “Databases” and select the application “shape2pgsql”.

step5

Follow the UI of shp2pgsql to connect to your routing database you created in Step 4.

step5.2

Next, select “Add File” and find your roads shapefile (in this guide we will call our shapefile “roads_table”) you want to use for your isochrones and click Open.

step5.3

Finally, click “Import” to place your shapefile into your routing database.

6. Add source & target columns: The purpose of this step is to create columns which will serve as placeholders for our nodes data we create later.

There are multiple ways to add these columns into the roads_table. The most important part of this step is which table you choose to edit, the names of the columns you create, and the format of the columns. Take time to ensure the source & target columns are integer format. Below are the commands used in your command line for these functions.

ALTER TABLE roads_table ADD COLUMN "source" integer;
ALTER TABLE roads_table ADD COLUMN "target" integer;

step6

step6.2

7. Create topology: Next, we will use a function to attach a node to each end of every road segment in the roads_table. The function in this step will create these nodes. These newly-created nodes will be stored in the source and target columns we created earlier in step 6.

As well as creating nodes, this function will also create a new table which will contain all these nodes. The suffix “_vertices_pgr” is added to the name of your shapefile to create this new table. For example, using our guide’s shapefile name , “roads_table”, the nodes table will be named accordingly: roads_table_vertices_pgr. However, we will not use the new table created from this function (roads_table_vertices_pgr). Below is the function, and a second simplified version, to be used in the command line for populating our source and target columns, in other words creating our network topology. Note the input format, the “geom” column in my case was called “the_geom” within my shapefile:

pgr_createTopology('roads_table', 0.001, 'geom', 'id',
 'source', 'target', rows_where := 'true', clean := f)

step7

Here is a direct link for more information on this function: http://docs.pgrouting.org/2.3/en/src/topology/doc/pgr_createTopology.html#pgr-create-topology

Below is an example(simplified) function for my roads shapefile:

SELECT pgr_createTopology('roads_table', 0.001, 'the_geom', 'id')

8. Create a second nodes table: A second nodes table will be created for later use. This second node table will contain the node data generated from pgr_createtopology function and be named “node”. Below is the command function for this process. Fill in your appropriate source and target fields following the manner seen in the command below, as well as your shapefile name.

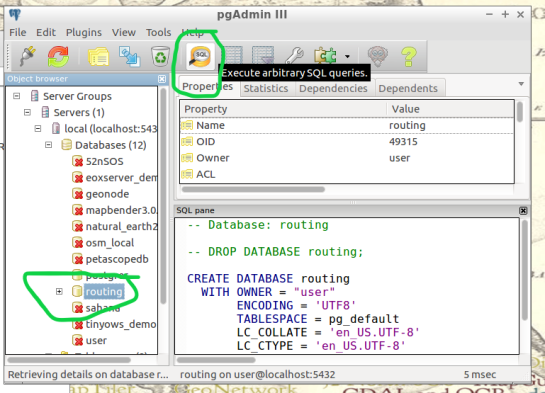
To begin, find the folder on the Virtual Machines desktop named “Databases” and open the program “pgAdmin lll” located within.

step8

Connect to your routing database in pgAdmin window. Then highlight your routing database, and find “SQL” tool at the top of the pgAdmin window. The tool resembles a small magnifying glass.
step8.2

We input the below function into the SQL window of pgAdmin. Feel free to refer to this link for further information: (https://anitagraser.com/2011/02/07/a-beginners-guide-to-pgrouting/)

CREATE TABLE node AS
   SELECT row_number() OVER (ORDER BY foo.p)::integer AS id,
          foo.p AS the_geom
   FROM (     
      SELECT DISTINCT roads_table.source AS p FROM roads_table
      UNION
      SELECT DISTINCT roads_table.target AS p FROM roads_table
   ) foo
   GROUP BY foo.p;

step8.3

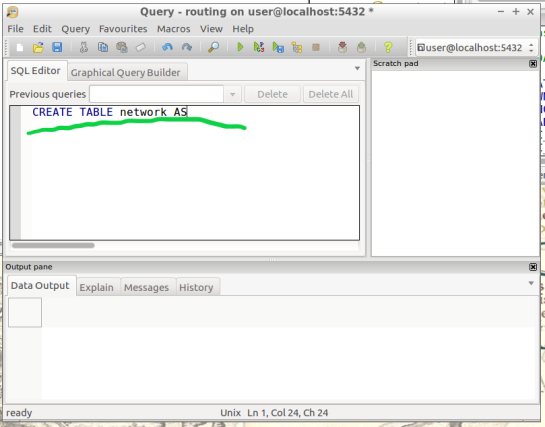
  1.  Create a routable network: After creating the second node table from step 8,  we will combine this node table(node) with our shapefile(roads_table) into one, new, table(network) that will be used as the routing network. This table will be called “network” and will be capable of processing routing queries.  Please input this command and execute in SQL pgAdmin tool as we did in step 8. Here is a reference for more information:(https://anitagraser.com/2011/02/07/a-beginners-guide-to-pgrouting/)   

step8.2


CREATE TABLE network AS
   SELECT a.*, b.id as start_id, c.id as end_id
   FROM roads_table AS a
      JOIN node AS b ON a.source = b.the_geom
      JOIN node AS c ON a.target = c.the_geom;
step9.2

10. Create a “noded” view of the network:  This new view will later be used to calculate the visual isochrones in later steps. Input this command and execute in SQL pgAdmin tool.

CREATE OR REPLACE VIEW network_nodes AS 
SELECT foo.id,
 st_centroid(st_collect(foo.pt)) AS geom 
FROM ( 
  SELECT network.source AS id,
         st_geometryn (st_multi(network.geom),1) AS pt 
  FROM network
  UNION 
  SELECT network.target AS id, 
         st_boundary(st_multi(network.geom)) AS pt 
  FROM network) foo 
GROUP BY foo.id;

step10

11.​ Add column for speed:​ This step may, or may not, apply if your original shapefile contained a field of values for road speeds.

In reality a network of roads will typically contain multiple speed limits. The shapefile you choose may have a speed field, otherwise the discrimination for the following steps will not allow varying speeds to be applied to your routing network respectfully.

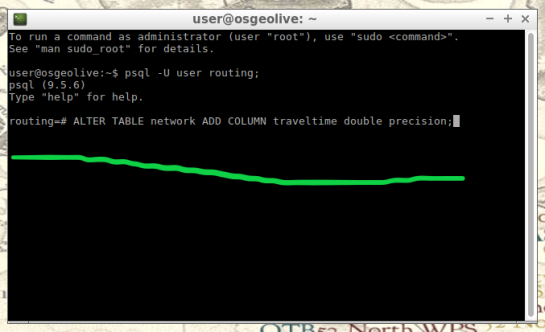
If values of speed exists in your shapefile we will implement these values into a new field, “traveltime“, that will show rate of travel for every road segment in our network based off their geometry. Firstly, we will need to create a column to store individual traveling speeds. The name of our column will be “traveltime” using the format: ​double precision.​ Input this command and execute in the command line tool as seen below.

ALTER TABLE network ADD COLUMN traveltime double precision;
step11

Next, we will populate the new column “traveltime” by calculating traveling speeds using an equation. This equation will take each road segments geometry(shape_leng) and divide by the rate of travel(either mph or kph). The sample command I’m using below utilizes mph as the rate while our geometry(shape_leng) units for my roads_table is in feet​. If you are using either mph or kph, input this command and execute in SQL pgAdmin tool. Below further details explain the variable “X”.

UPDATE network SET traveltime = shape_leng / X*60
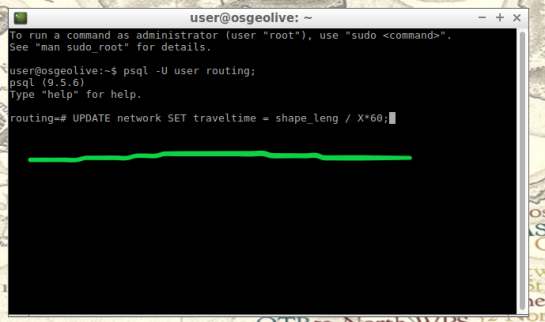
step11.2

How to find X​, ​here is an example​: Using example 30 mph as rate. To find X, we convert 30 miles to feet, we know 5280 ft = 1 mile, so we multiply 30 by 5280 and this gives us 158400 ft. Our rate has been converted from 30 miles per hour to 158400 feet per hour. For a rate of 30 mph, our equation for the field “traveltime”  equates to “shape_leng / 158400*60″. To discriminate this calculations output, we will insert additional details such as “where speed = 30;”. What this additional detail does is apply our calculated output to features with a “30” value in our “speed” field. Note: your “speed” field may be named differently.

UPDATE network SET traveltime = shape_leng / 158400*60 where speed = 30;

Repeat this step for each speed value in your shapefile examples:

UPDATE network SET traveltime = shape_leng / X*60 where speed = 45;
UPDATE network SET traveltime = shape_leng / X*60 where speed = 55;

The back end is done. Great Job!

Our next step will be visualizing our data in QGIS. Open and connect QGIS to your routing database by right-clicking “PostGIS” in the Browser Panel within QGIS main window. Confirm the checkbox “Also list tables with no geometry” is checked to allow you to see the interior of your database more clearly. Fill out the name or your routing database and click “OK”.

If done correctly, from QGIS you will have access to tables and views created in your routing database. Feel free to visualize your network by drag-and-drop the network table into your QGIS Layers Panel. From here you can use the identify tool to select each road segment, and see the source and target nodes contained within that road segment. The node you choose will be used in the next step to create the views of drive-time.

12.Create views​: In this step, we create views from a function designed to determine the travel time cost. Transforming these views with tools will visualize the travel time costs as isochrones.

The command below will be how you start querying your database to create drive-time isochrones. Begin in QGIS by draging your network table into the contents. The visual will show your network as vector(lines). Simply select the road segment closest to your point of interest you would like to build your isochrone around. Then identify the road segment using the identify tool and locate the source and target fields.

step12

step12.2

Place the source or target field value in the below command where you see ​VALUE​, in all caps​.

This will serve you now as an isochrone catchment function for this workflow. Please feel free to use this command repeatedly for creating new isochrones by substituting the source value. Please input this command and execute in SQL pgAdmin tool.

*AT THE BOTTOM OF THIS WORKFLOW I PROVIDED AN EXAMPLE USING SOURCE VALUE “2022”

CREATE OR REPLACE VIEW "​view_name" AS 
SELECT di.seq, 
       di.id1, 
       di.id2, 
       di.cost, 
       pt.id, 
       pt.geom 
FROM pgr_drivingdistance('SELECT
     gid::integer AS id, 
     Source::integer AS source, 
     Target::integer AS target,                                    
     Traveltime::double precision AS cost 
       FROM network'::text, ​VALUE::bigint, 
    100000::double precision, false, false)
    di(seq, id1, id2, cost)
JOIN network_nodes pt ON di.id1 = pt.id;
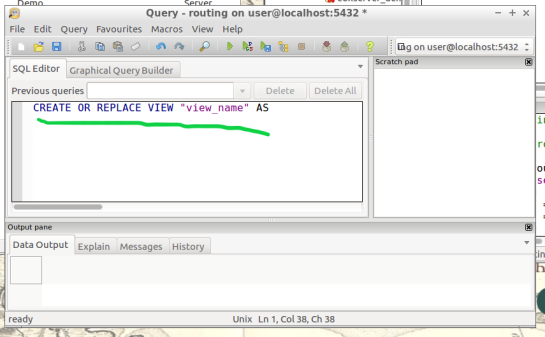
step12.3

13.Visualize Isochrone: Applying tools to the view will allow us to adjust the visual aspect to a more suitable isochrone overlay.

​After creating your view, a new item in your routing database is created, using the “view_name” you chose. Drag-and-drop this item into your QGIS LayersPanel. You will see lots of small dots which represent the nodes.

In the figure below, I named my view “take1“.

step13

Each node you see contains a drive-time value, “cost”, which represents the time used to travel from the node you input in step 12’s function.
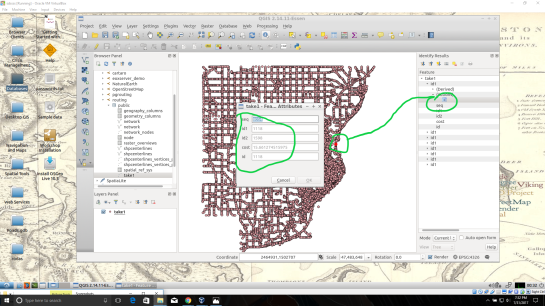
step13.2

Start by installing the QGIS plug-in Interpolation” by opening the Plugin Manager in QGIS interface.
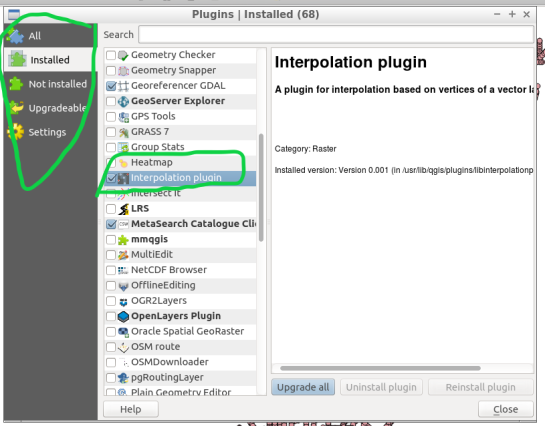
step13.3

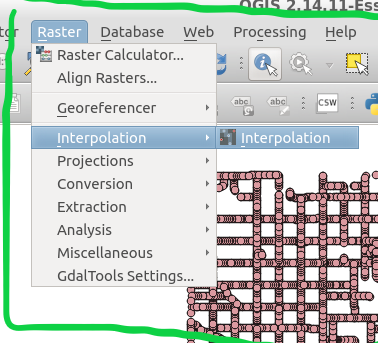
Next, at the top of QGIS window select “Raster” and a drop-down will appear, select “Interpolation”.
step13.4


A new window pops up and asks you for input.

step13.5

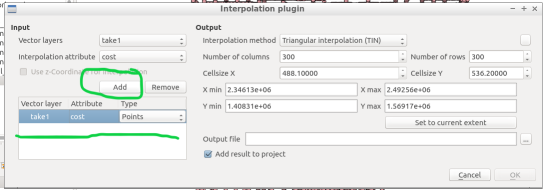
Select your “​view”​ as the​ vector layer​, select ​”cost​” as your ​interpolation attribute​, and then click “Add”.

step13.6

A new vector layer will show up in the bottom of the window, take care the type is Points. For output, on the other half of the window, keep the interpolation method as “TIN”, edit the ​output file​ location and name. Check the box “​Add result to project​”.

Note: decreasing the cellsize of X and Y will increase the resolution but at the cost of performance.

Click “OK” on the bottom right of the window.

step13.7

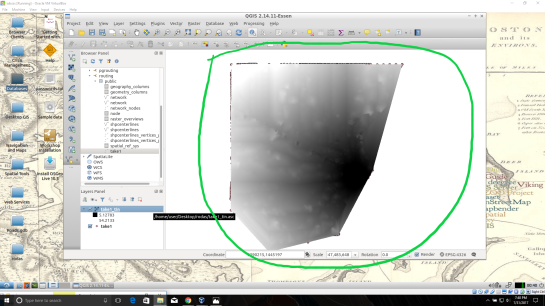
A black and white raster will appear in QGIS, also in the Layers Panel a new item was created.
step13.8

Take some time to visualize the raster by coloring and adjusting values in symbology until you are comfortable with the look.

step13.9

step13.10

14. ​Create contours of our isochrone:​ Contours can be calculated from the isochrone as well.

Find near the top of QGIS window, open the “Raster” menu drop-down and select Extraction → Contour.

step14

Fill out the appropriate interval between contour lines but leave the check box “Attribute name” unchecked. Click “OK”.

step14.2

step14.3

15.​ Zip and Share:​ Find where you saved your TIN and contours, compress them in a zip folder by highlighting them both and right-click to select “compress”. Email the compressed folder to yourself to export out of your virtual machine.

Example Isochrone catchment for this workflow:

CREATE OR REPLACE VIEW "2022" AS 
SELECT di.seq, Di.id1, Di.id2, Di.cost,                           
       Pt.id, Pt.geom 
FROM pgr_drivingdistance('SELECT gid::integer AS id,                                       
     Source::integer AS source, Target::integer AS target, 
     Traveltime::double precision AS cost FROM network'::text, 
     2022::bigint, 100000::double precision, false, false) 
   di(seq, id1, id2, cost) 
JOIN netowrk_nodes pt 
ON di.id1 = pt.id;

References: Virtual Box ORACLE VM, OSGeo-Live 11  amd64 iso, Workshop FOSS4G Bonn(​http://workshop.pgrouting.org/2.2.10/en/index.html​),

Movement data in GIS: issues & ideas

Since I’ve started working, transport and movement data have been at the core of many of my projects. The spatial nature of movement data makes it interesting for GIScience but typical GIS tools are not a particularly good match.

Dealing with the temporal dynamics of geographic processes is one of the grand challenges for Geographic Information Science. Geographic Information Systems (GIS) and related spatial analysis methods are quite adept at handling spatial dimensions of patterns and processes, but the temporal and coupled space-time attributes of phenomena are difficult to represent and examine with contemporary GIS. (Dr. Paul M. Torrens, Center for Urban Science + Progress, New York University)

It’s still a hot topic right now, as the variety of related publications and events illustrates. For example, just this month, there is an Animove two-week professional training course (18–30 September 2016, Max-Planck Institute for Ornithology, Lake Konstanz) as well as the GIScience 2016 Workshop on Analysis of Movement Data (27 September 2016, Montreal, Canada).

Space-time cubes and animations are classics when it comes to visualizing movement data in GIS. They can be used for some visual analysis but have their limitations, particularly when it comes to working with and trying to understand lots of data. Visualization and analysis of spatio-temporal data in GIS is further complicated by the fact that the temporal information is not standardized in most GIS data formats. (Some notable exceptions of formats that do support time by design are GPX and NetCDF but those aren’t really first-class citizens in current desktop GIS.)

Most commonly, movement data is modeled as points (x,y, and optionally z) with a timestamp, object or tracker id, and potential additional info, such as speed, status, heading, and so on. With this data model, even simple questions like “Find all tracks that start in area A and end in area B” can become a real pain in “vanilla” desktop GIS. Even if the points come with a sequence number, which makes it easy to identify the start point, getting the end point is tricky without some custom code or queries. That’s why I have been storing the points in databases in order to at least have the powers of SQL to deal with the data. Even so, most queries were still painfully complex and performance unsatisfactory.

So I reached out to the Twitterverse asking for pointers towards moving objects database extensions for PostGIS and @bitnerd, @pwramsey, @hruske, and others replied. Amongst other useful tips, they pointed me towards the new temporal support, which ships with PostGIS 2.2. It includes the following neat functions:

  • ST_IsValidTrajectory — Returns true if the geometry is a valid trajectory.
  • ST_ClosestPointOfApproach — Returns the measure at which points interpolated along two lines are closest.
  • ST_DistanceCPA — Returns the distance between closest points of approach in two trajectories.
  • ST_CPAWithin — Returns true if the trajectories’ closest points of approach are within the specified distance.

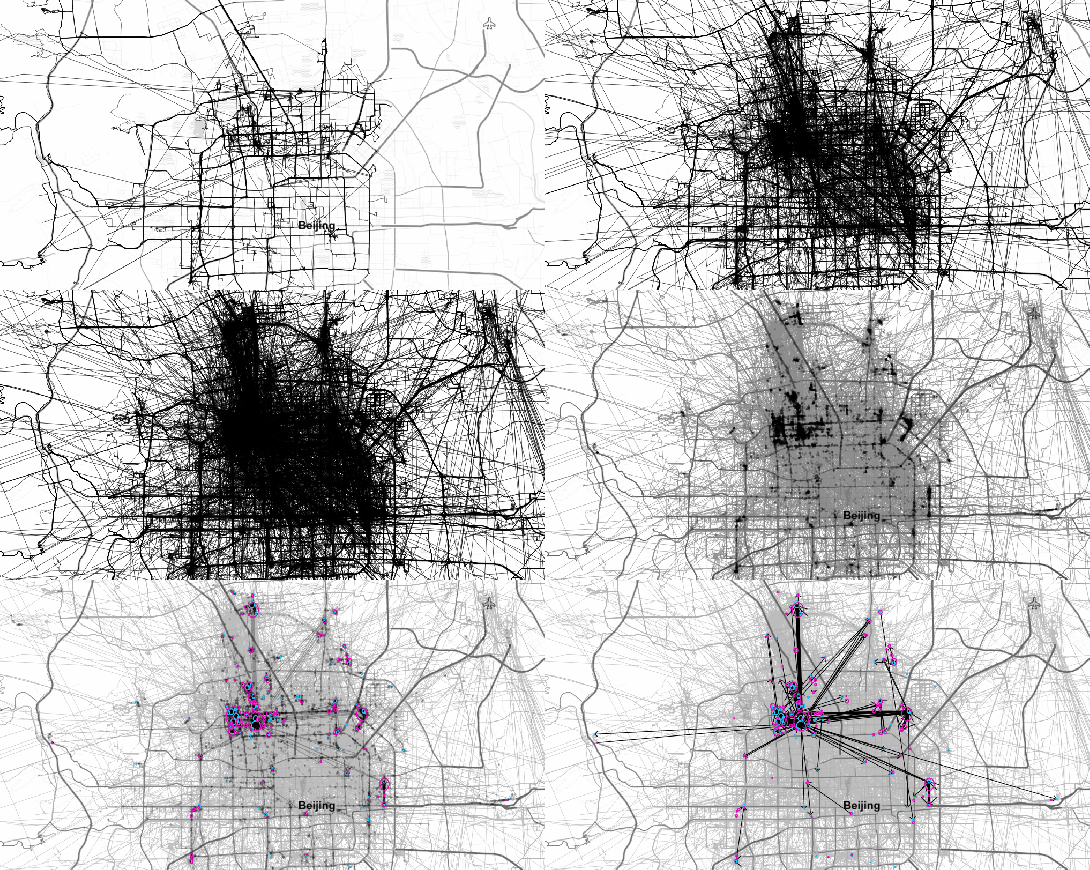
Instead of  points, these functions expect trajectories that are stored as LinestringM (or LinestringZM) where M is the time dimension. This approach makes many analyses considerably easier to handle. For example, clustering trajectory start and end locations and identifying the most common connections:

animation_clusters

(data credits: GeoLife project)

Overall, it’s an interesting and promising approach but there are still some open questions I’ll have to look into, such as: Is there an efficient way to store additional info for each location along the trajectory (e.g. instantaneous speed or other status)? How well do desktop GIS play with LinestringM data and what’s the overhead of dealing with it?


Public transport isochrones with pgRouting

This post covers a simple approach to calculating isochrones in a public transport network using pgRouting and QGIS.

For this example, I’m using the public transport network of Vienna which is loaded into a pgRouting-enable database as network.publictransport. To create the routable network run:

select pgr_createTopology('network.publictransport', 0.0005, 'geom', 'id');

Note that the tolerance parameter 0.0005 (units are degrees) controls how far link start and end points can be apart and still be considered as the same topological network node.

To create a view with the network nodes run:

create or replace view network.publictransport_nodes as
select id, st_centroid(st_collect(pt)) as geom
from (
	(select source as id, st_startpoint(geom) as pt
	from network.publictransport
	) 
union
	(select target as id, st_endpoint(geom) as pt
	from network.publictransport
	) 
) as foo
group by id;

To calculate isochrones, we need a cost attribute for our network links. To calculate travel times for each link, I used speed averages: 15 km/h for buses and trams and 32km/h for metro lines (similar to data published by the city of Vienna).

alter table network.publictransport add column length_m integer;
update network.publictransport set length_m = st_length(st_transform(geom,31287));

alter table network.publictransport add column traveltime_min double precision;
update network.publictransport set traveltime_min = length_m  / 15000.0 * 60; -- average is 15 km/h
update network.publictransport set traveltime_min = length_m  / 32000.0 * 60 where "LTYP" = '4'; -- average metro is 32 km/h

That’s all the preparations we need. Next, we can already calculate our isochrone data using pgr_drivingdistance, e.g. for network node #1:

create or replace view network.temp as
 SELECT seq, id1 AS node, id2 AS edge, cost, geom
  FROM pgr_drivingdistance(
    'SELECT id, source, target, traveltime_min as cost FROM network.publictransport',
    1, 100000, false, false
  ) as di
  JOIN network.publictransport_nodes pt
  ON di.id1 = pt.id;

The resulting view contains all network nodes which are reachable within 100,000 cost units (which are minutes in our case).

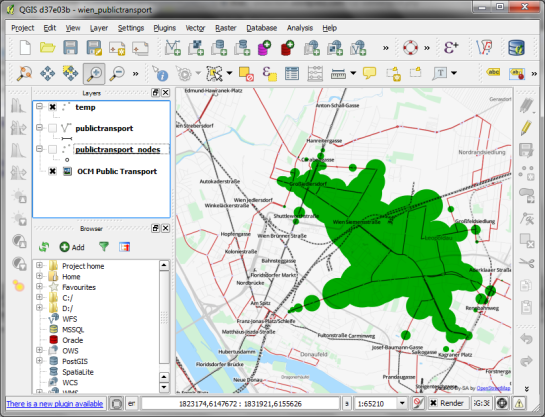
Let’s load the view into QGIS to visualize the isochrones:

isochrone_publictransport_1

The trick is to use data-defined size to calculate the different walking circles around the public transport stops. For example, we can set up 10 minute isochrones which take into account how much time was used to travel by pubic transport and show how far we can get by walking in the time that is left:

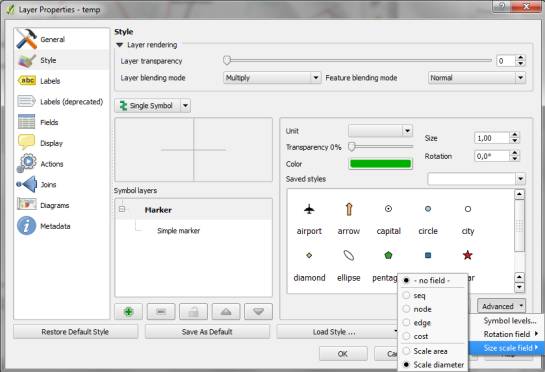
1. We want to scale the circle radius to reflect the remaining time left to walk. Therefore, enable Scale diameter in Advanced | Size scale field:

scale_diameter

2. In the Simple marker properties change size units to Map units.
3. Go to data defined properties to set up the dynamic circle size.

datadefined_size

The expression makes sure that only nodes reachable within 10 minutes are displayed. Then it calculates the remaining time (10-"cost") and assumes that we can walk 100 meters per minute which is left. It additionally multiplies by 2 since we are scaling the diameter instead of the radius.

To calculate isochrones for different start nodes, we simply update the definition of the view network.temp.

While this approach certainly has it’s limitations, it’s a good place to start learning how to create isochrones. A better solution should take into account that it takes time to change between different lines. While preparing the network, more care should to be taken to ensure that possible exchange nodes are modeled correctly. Some network links might only be usable in one direction. Not to mention that there are time tables which could be accounted for ;)


pgRouting 2.0 for Windows quick guide

This post is a quick instruction for installing Postgres 9.2, PostGIS 2.0 and pgRouting 2.0.

  1. For Postgres, download the installer from enterprisedb.com.
  2. Run the installer. You’ll have to pick a superuser password – remember it, you’ll need it again soon.
  3. At the end of the installation process, allow the installer to start Stack Builder.
  4. In Stack Builder, select the Postgres 9.2 installation and install PostGIS from the list of available extensions.
  5. The PostGIS installation procedure will prompt you for the superuser password you picked before.
  6. I suggest letting the installer create a sample database We’ll need it later anyway.

Now for the pgRouting part:

  1. Download the pgRouting zip file for your system (32 or 64 bit) from Winnie.
  2. Unzip the file. It contains bin, lib and share folders as well as two text files.
  3. Copy these folders and files over to your Postgres installation. In my case C:\Program Files\PostgreSQL\9.2

Installation – done.

Next, fire up pgAdmin. If you allowed the PostGIS installer to create a sample database, you will find it named postgis20 or similar. Otherwise just create a new database using the PostGIS template database. You can enable pgRouting in a database using the following steps:

  1. In postgis20, execute the following query to create the pgrouting extension. This will add the pgRouting-specific functions:
    CREATE EXTENSION pgrouting;
  2. Test if everything worked fine:
    SELECT pgr_version();

    It should return "(2.0.0-dev,v2.0.0-beta,18,a3be38b,develop,1.46.1)" or similar – depending on the version you downloaded.

pgadmin_pgrouting

How about some test data? I’ll be using the public transport network of the city of Vienna provided in GeoJSON format from http://data.wien.gv.at/daten/wfs?service=WFS&request=GetFeature&version=1.1.0&typeName=ogdwien:OEFFLINIENOGD&srsName=EPSG:4326&outputFormat=json:

  1. Just copy paste the url in Add Vector Layer | Protocol to load the dataset.
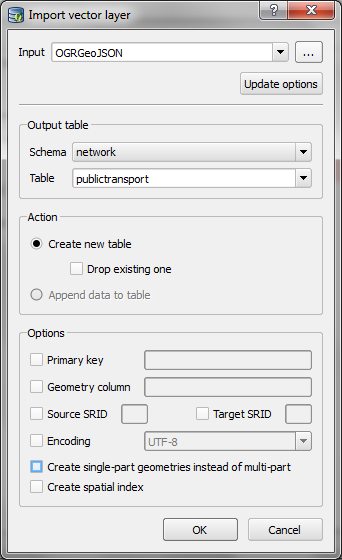
  2. Use DB Manager to load the layer into your database. (As you can see in the screenshot, I created a schema called network but that’s optional.)
  3. import_publictransport

  4. To make the line vector table routable, we use pgr_createTopology. This function assumes the columsn called “source” and “target” exist so we have to create those as well:
    alter table network.publictransport add column source integer;
    alter table network.publictransport add column target integer;
    select pgr_createTopology('network.publictransport', 0.0001, 'geom', 'id');
    

    I’m quite generously using a tolerance of 0.0001 degrees to build the topology. Depending on your dataset, you might want to be more strict here.

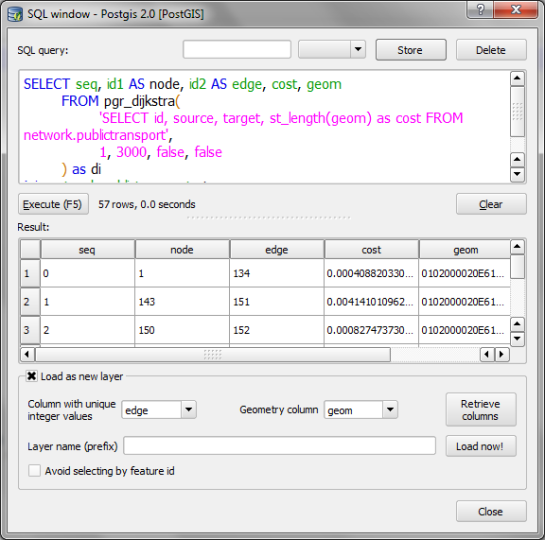
  5. Let’s test it! Route from source #1 to target #3000 using pgr_dijkstra:
    SELECT seq, id1 AS node, id2 AS edge, cost, geom
      FROM pgr_dijkstra(
        'SELECT id, source, target, st_length(geom) as cost FROM network.publictransport',
        1, 3000, false, false
      ) as di
      JOIN network.publictransport pt
      ON di.id2 = pt.id ;

    Note how the query joins the routing results and the network table together. (I’m aware that using the link length as a cost attribute will not lead to realistic results in a public transport network but bear with me for this example.)

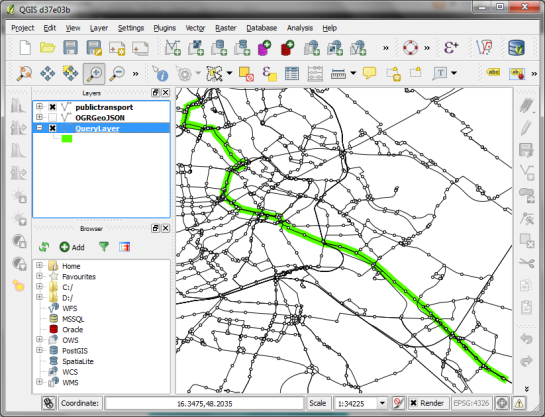
  6. We can immediately see the routing results using the Load as new layer option:

select_dijkstra
route

Nice work! pgRouting 2.0 has come a long way. In a post from April this year, Boston GIS even announced to add pgRouting into the Stack Builder. That’s going to make the installation even more smooth.


WFS to PostGIS in 1 Step

This is an update to my previous post “WFS to PostGIS in 3 Steps”. Thanks to Even Rouault’s comments and improvements to GDAL, it is now possible to load Latin1-encoded WFS (like the one by data.wien.gv.at) into PostGIS in just one simple step.

To use the following instructions, you’ll have to get the latest GDAL (release-1600-gdal-mapserver.zip)

You only need to run SDKShell.bat to set up the environment and ogr2ogr is ready for action:

C:\Users\Anita>cd C:\release-1600-gdal-mapserver
C:\release-1600-gdal-mapserver>SDKShell.bat
C:\release-1600-gdal-mapserver>ogr2ogr -overwrite -f PostgreSQL PG:"user=myuser password=mypassword dbname=wien_ogd" "WFS:http://data.wien.gv.at/daten/geoserver/ows?service=WFS&request=GetFeature&version=1.1.0&typeName=ogdwien:BEZIRKSGRENZEOGD&srsName=EPSG:4326"

Thanks everyone for your comments and help!


WFS to PostGIS in 3 Steps

This is a quick note on how to download features from a WFS and import them into a PostGIS database. The first line downloads a zipped Shapefile from the WFS. The second one unzips it and the last one loads the data into my existing “gis_experimental” database:

wget "http://data.wien.gv.at/daten/geoserver/ows?service=WFS&request=GetFeature&version=1.1.0&typeName=ogdwien:BEZIRKSGRENZEOGD&srsName=EPSG:4326&outputFormat=shape-zip" -O BEZIRKSGRENZEOGD.zip
unzip -d /tmp BEZIRKSGRENZEOGD.zip
shp2pgsql -s 4326 -I -S -c -W Latin1 "/tmp/BEZIRKSGRENZEOGD.shp" | psql gis_experimental

Now, I’d just need a loop through the WFS Capabilities to automatically fetch all offered layers … Ideas anyone?

Thanks to Tim for his post “Batch importing shapefiles into PostGIS” which was very useful here.

Update: Many readers have pointed out that ogr2ogr is a great tool for this kind of use cases and can do the above in one line. That’s true – if it works. Unfortunately, it is picky about the supported encodings, e.g. doesn’t want to parse ISO-8859-15. In such cases, the three code lines above can be a good alternative.


Osm2po Part 2 – PgRouting on OSM the Easy Way

This is the follow up post to “An osm2po Quickstart” which covers loading the OSM network into PostGIS and using the result with pgRouting. After parsing the OSM file, e.g.

C:\Users\Anita\temp\osm2po-4.2.30>java -jar osm2po-core-4.2.30-signed.jar prefix=at "C:\Users\Anita\Geodaten\OpenStreetMap Data\austria.osm.pbf"

you should find a folder with the name of the prefix you chose inside the osm2po folder. It contains a log file which in turn provides a command line template for importing the OSM network into PostGIS, e.g.

INFO commandline template: psql -U [username] -d [dbname] -q -f "C:\Users\Anita\temp\osm2po-4.2.30\at\at_2po_4pgr.sql"

Using this template, we can easily import the .sql file into an exiting database. My pgRouting-enabled database is called wien_ogd.

C:\Users\Anita\temp\osm2po-4.2.30\at>psql -U [username] -d wien_ogd -q -f C:\Users\Anita\temp\osm2po-4.2.30\at\at_2po_4pgr.sql

Now, the data is ready for usage in QGIS:

The osm2po table in QGIS

Using “pgRouting Layer” plugin, it’s now straightforward to calculate shortest paths. I had to apply some changes to the plugin code, so please get the latest version from Github.

A shortest path in osm2po network

Using osm2po turned out to be far less painful than I expected and I hope you’ll find this post useful too.


A Look at PgRouting find_ node_by_nearest_link_within_distance

The function with the glorious name “find_node_by_nearest_link_within_distance” is part of pgRouting and can be found in matching.sql.

“This function finds nearest node as a source or target of the nearest link”
That means that we can use this function e.g. to find the best road network node for a given address.

The function returns an object of type link_point:

CREATE TYPE link_point AS (id integer, name varchar);

To access only the id value of the nearest node, you can use:

SELECT id(foo.x) 
FROM (
   SELECT find_node_by_nearest_link_within_distance(
	'POINT(14.111 47.911)',
	0.5,
	'nw_table')::link_point as x
) AS foo


A Closer Look at Alpha Shapes in pgRouting

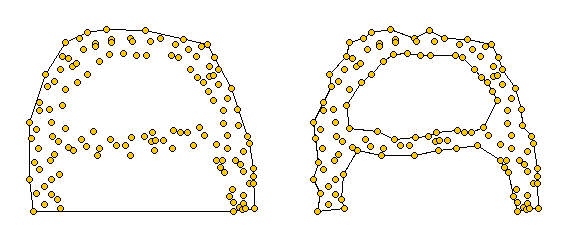
Alpha shapes are generalizations of the convex hull [1]. Convex hulls are well known and widely implemented in GIS systems. Alpha shapes are different in that they capture the shape of a point set. You can watch a great demo of how alpha shapes work on François Bélair’s website “Everything You Always Wanted to Know About Alpha Shapes But Were Afraid to Ask” I borrowed the following pictures from that site:

Alpha shapes for different values of alpha. The left one equals the convex hull of the point set. The right picture represents the alpha shape for a smaller value of alpha

pgRouting comes with an implementation of alpha shapes. There is an alpha shape function: alphashape(sql text) and a convenience wrapper: points_as_polygon(query character varying). The weird thing is that you don’t get to set an alpha value. The only thing supplied to the function is a set of points. Let’s see what kind of results it produces!

Starting point for this experiment is a 10 km catchment zone around node #2699 in my osm road network. Travel costs to nodes are calculated using driving_distance() function. (You can find more information on using this function in Catchment Areas with pgRouting driving_distance().)

CREATE TABLE home_catchment10km AS
SELECT *
   FROM osm_nodes
   JOIN
   (SELECT * FROM driving_distance('
      SELECT gid AS id,
          source,
          target,
          meters AS cost
      FROM osm_roads',
      2699,
      10000,
      false,
      false)) AS route
   ON
   osm_nodes.id = route.vertex_id

After costs are calculated, we can create some alpha shapes. The following queries create the table and insert an alpha shape for all points with a cost of less than 1500:

CREATE TABLE home_isodist (id serial, max_cost double precision);
SELECT AddGeometryColumn('home_isodist','the_geom',4326,'POLYGON',2);

INSERT INTO home_isodist (max_cost, the_geom) (
SELECT 1500, ST_SetSRID(the_geom,4326)
FROM 
  points_as_polygon(
    'SELECT id, ST_X(the_geom) AS x, ST_Y(the_geom) AS y FROM home_catchment10km where cost < 1500'));

In previous posts, I’ve created catchment areas by first interpolating a cost raster and creating contours from there. Now, let’s see how the two different approaches compare!

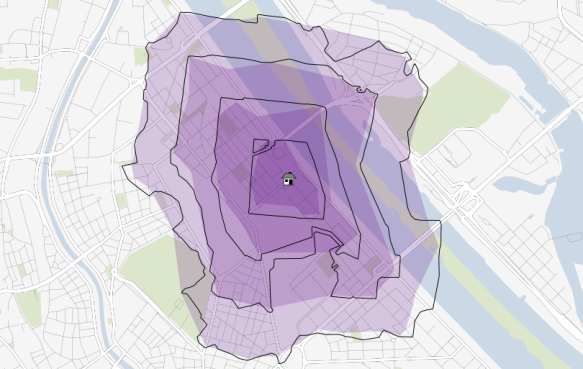
The following picture shows resulting catchment areas for 500, 1000, 1500, and 2000 meters around a central node. Colored areas show the form of pgRouting alpha shape results. Black contours show the results of the interpolation method:

Comparison of pgRouting alpha shapes and interpolation method

At first glance, results look similar enough. Alpha shape results look like a generalized version of interpolation results. I guess that it would be possible to get even closer if the alpha value could be set to a smaller value. The function should then produce a finer, more detailed polygon.

For a general overview about which areas of a network are reachable within certain costs, pgRouting alpha shapes function seems a viable alternative to the interpolation method presented in previous posts. However, the alpha value used by pgRouting seems too big to produce detailed catchment areas.

[1] http://biogeometry.duke.edu/software/alphashapes/


Guide to Advanced Labeling for OSM Roads

Advanced labeling in QGIS new labeling engine is mostly about data-defined settings. Almost any property of the label can be controlled.

For this example, we will try to mimic the look of the classic Google map with it’s line and label styles. The data for this post is from the OpenStreetMap project provided as Shapefiles by Cloudmade.

After importing the roads into PostGIS using PostGIS Manager Plugin, we can create a view that will contain the necessary label style information. The trick here is to use CASE statements to distinguish between different label “classes”. Motorway labels will be bigger than the rest and the buffer color will be the same color as used for the corresponding lines.

drop view if exists v_osm_roads_styled ;

CREATE VIEW v_osm_roads_styled AS
SELECT *,
CASE WHEN type = 'motorway' THEN 9
     ELSE 8 END
     as font_size,
'black'::TEXT as font_color,
false as font_bold,
false as font_italic,
false as font_underline,
false as font_strikeout,
false as font_family,
1 as buffer_size,
CASE WHEN type = 'motorway' THEN '#fb9139'::TEXT
     WHEN type IN ( 'primary','primary_link','secondary','secondary_link') THEN '#fffb8b'::TEXT
     ELSE 'white'::TEXT END
     as buffer_color
from osm_roads;

In QGIS, we can then load the view and start styling. First, let’s get the line style ready. Using rule-based renderer, it’s easy to create complex styles. In this case, I’ve left it rather simple and don’t distinguish between different zoom levels. That’s a topic for another post :)

Google-style rules for OSM road data

Now for the labels! In “Data defined settings”, we can assign the special attributes created in the database view to the settings.

Completed "Data defined settings"

To achieve an even better look, go to “Advanced” tab and enable “curved” and “on line” placement. “Merge connected lines to avoid duplicate labels” option is very helpful too.

Finally – after adding some water objects (Cloudmade natural.shp) – this is what our result looks like:

Google-style OSM map

This solution can be improved considerably by adding multiple zoom levels with corresponding styles. One obvious difference between the original Google map and this look-alike is the lack of road numbers. Tim’s post on “shield labels” can be a starting point for adding road numbers the way Google does.


Visualizing Global Connections

Today, I’ve been experimenting with data from OpenFlights.org. They offer airport, airline and route data for download. The first idea that came to mind was to connect airports on a shared route by lines. This kind of visualization just looks much nicer if the connections are curved instead of simple straight lines.

Luckily, that’s pretty easy to do using PostGIS. After loading airport positions and route data, we can create the connection lines like this (based on [postgis-users] Great circle as a linestring):

UPDATE experimental.airroutes
SET the_geom =
(SELECT ST_Transform(ST_Segmentize(ST_MakeLine(
       ST_Transform(a.the_geom, 953027),
       ST_Transform(b.the_geom, 953027)
     ), 100000 ), 4326 )
 FROM experimental.airports a, experimental.airports b
 WHERE a.id = airroutes.source_id
   AND b.id = airroutes.dest_id
);

The CRS used in the query is not available in PostGIS by default. You can add it like this (source: spatialreference.org):

INSERT into spatial_ref_sys (srid, auth_name, auth_srid, proj4text, srtext) values ( 953027, 'esri', 53027, '+proj=eqdc +lat_0=0 +lon_0=0 +lat_1=60 +lat_2=60 +x_0=0 +y_0=0 +a=6371000 +b=6371000 +units=m +no_defs ', 'PROJCS["Sphere_Equidistant_Conic",GEOGCS["GCS_Sphere",DATUM["Not_specified_based_on_Authalic_Sphere",SPHEROID["Sphere",6371000,0]],PRIMEM["Greenwich",0],UNIT["Degree",0.017453292519943295]],PROJECTION["Equidistant_Conic"],PARAMETER["False_Easting",0],PARAMETER["False_Northing",0],PARAMETER["Central_Meridian",0],PARAMETER["Standard_Parallel_1",60],PARAMETER["Standard_Parallel_2",60],PARAMETER["Latitude_Of_Origin",0],UNIT["Meter",1],AUTHORITY["EPSG","53027"]]');

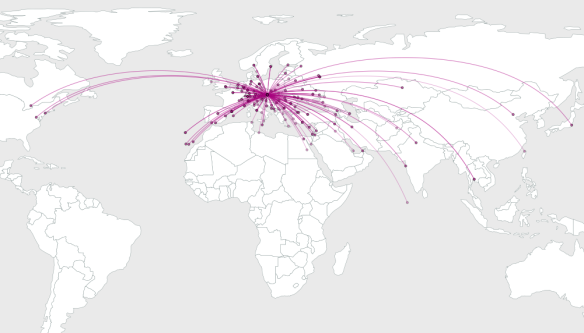
This is an example visualization (done in QGIS) showing only flight routes starting from Vienna International Airport:

Flight routes from Vienna International

Connections crossing the date line are currently more problematic. Lines would have to be split, otherwise this is what you’ll get:

Date line trouble


How to create a Table with Geometry Column in PostGIS

Do you need to create a table with a geometry column in PostGIS from scratch?
Can’t remember the syntax of AddGeometryColumn(varchar catalog_name, varchar schema_name, varchar table_name, varchar column_name, integer srid, varchar type, integer dimension)? I can’t. ;)

Let’s make our lives easier: QGIS PostGIS Manager offers a convenient GUI for creating tables with geometry columns:

PostGIS Manager Create Table dialog

The dialog works a lot like what you’re probably used to in pgAdmin – with the added nicety of supporting Geometry columns.

In my opinion, this is the fastest way so far to create a spatially enabled table. It provides a much better user experience than telling users (especially new ones) to use AddGeometryColumn(…


Back to Top

Sustaining Members