Related Plugins and Tags

QGIS Planet

Generating trajectories from massive movement datasets

To explore travel patterns like origin-destination relationships, we need to identify individual trips with their start/end locations and trajectories between them. Extracting these trajectories from large datasets can be challenging, particularly if the records of individual moving objects don’t fit into memory anymore and if the spatial and temporal extent varies widely (as is the case with ship data, where individual vessel journeys can take weeks while crossing multiple oceans). 

This is part 2 of “Exploring massive movement datasets”.

Roughly speaking, trip trajectories can be generated by first connecting consecutive records into continuous tracks and then splitting them at stops. This general approach applies to many different movement datasets. However, the processing details (e.g. stop detection parameters) and preprocessing steps (e.g. removing outliers) vary depending on input dataset characteristics.

For example, in our paper [1], we extracted vessel journeys from AIS data which meant that we also had to account for observation gaps when ships leave the observable (usually coastal) areas. In the accompanying 10-minute talk, I went through a 4-step trajectory exploration workflow for assessing our dataset’s potential for travel time prediction:

Click to watch the recorded talk

Like the M³ prototype computation presented in part 1, our trajectory aggregation approach is implemented in Spark. The challenges are both the massive amounts of trajectory data and the fact that operations only produce correct results if applied to a complete and chronologically sorted set of location records.This is challenging because Spark core libraries (version 2.4.5 at the time) are mostly geared towards dealing with unsorted data. This means that, when using high-level Spark core functionality incorrectly, an aggregator needs to collect and sort the entire track in the main memory of a single processing node. Consequently, when dealing with large datasets, out-of-memory errors are frequently encountered.

To solve this challenge, our implementation is based on the Secondary Sort pattern and on Spark’s aggregator concept. Secondary Sort takes care to first group records by a key (e.g. the moving object id), and only in the second step, when iterating over the records of a group, the records are sorted (e.g. chronologically). The resulting iterator can be used by an aggregator that implements the logic required to build trajectories based on gaps and stops detected in the dataset.

If you want to dive deeper, here’s the full paper:

[1] Graser, A., Dragaschnig, M., Widhalm, P., Koller, H., & Brändle, N. (2020). Exploratory Trajectory Analysis for Massive Historical AIS Datasets. In: 21st IEEE International Conference on Mobile Data Management (MDM) 2020. doi:10.1109/MDM48529.2020.00059


This post is part of a series. Read more about movement data in GIS.

Movement data in GIS #30: synchronized trajectory animations with QGIS temporal controller

QGIS Temporal Controller is a powerful successor of TimeManager. Temporal Controller is a new core feature of the current development version and will be shipped with the 3.14 release. This post demonstrates two key advantages of this new temporal support:

  1. Expression support for defining start and end timestamps
  2. Integration into the PyQGIS API

These features come in very handy in many use cases. For example, they make it much easier to create animations from folders full of GPS tracks since the files can now be loaded and configured automatically:

Script & Temporal Controller in action (click for full resolution)

All tracks start at the same location but at different times. (Kudos for Andrew Fletcher for recordings these tracks and sharing them with me!) To create an animation that shows all tracks start simultaneously, we need to synchronize them. This synchronization can be achieved on-the-fly by subtracting the start time from all track timestamps using an expression:

directory = "E:/Google Drive/QGIS_Course/05_TimeManager/Example_Dayrides/"

def load_and_configure(filename):
    path = os.path.join(directory, filename)
    uri = 'file:///' + path + "?type=csv&escape=&useHeader=No&detectTypes=yes"
    uri = uri + "&crs=EPSG:4326&xField=field_3&yField=field_2"
    vlayer = QgsVectorLayer(uri, filename, "delimitedtext")
    QgsProject.instance().addMapLayer(vlayer)

    mode = QgsVectorLayerTemporalProperties.ModeFeatureDateTimeStartAndEndFromExpressions
    expression = """to_datetime(field_1) -
    make_interval(seconds:=minimum(epoch(to_datetime("field_1")))/1000)
    """

    tprops = vlayer.temporalProperties()
    tprops.setStartExpression(expression)
    tprops.setEndExpression(expression) # optional
    tprops.setMode(mode)
    tprops.setIsActive(True)

for filename in os.listdir(directory):
    if filename.endswith(".csv"):
        load_and_configure(filename)

The above script loads all CSV files from the given directory (field_1 is the timestamp, field_2 is y, and field_3 is x), enables sets the start and end expression as well as the corresponding temporal control mode and finally activates temporal rendering. The resulting config can be verified in the layer properties dialog:

To adapt this script to other datasets, it’s sufficient to change the file directory and revisit the layer uri definition as well as the field names referenced in the expression.


This post is part of a series. Read more about movement data in GIS.

Movement data in GIS #29: power your web apps with movement data using mobilitydb-sqlalchemy

This is a guest post by Bommakanti Krishna Chaitanya @chaitan94

Introduction

This post introduces mobilitydb-sqlalchemy, a tool I’m developing to make it easier for developers to use movement data in web applications. Many web developers use Object Relational Mappers such as SQLAlchemy to read/write Python objects from/to a database.

Mobilitydb-sqlalchemy integrates the moving objects database MobilityDB into SQLAlchemy and Flask. This is an important step towards dealing with trajectory data using appropriate spatiotemporal data structures rather than plain spatial points or polylines.

To make it even better, mobilitydb-sqlalchemy also supports MovingPandas. This makes it possible to write MovingPandas trajectory objects directly to MobilityDB.

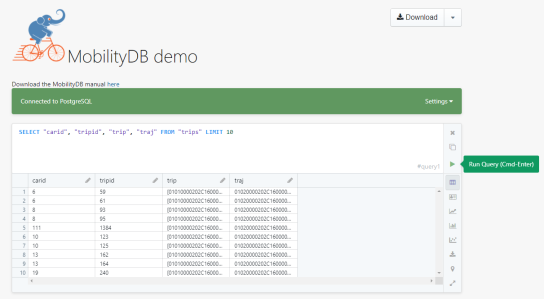
For this post, I have made a demo application which you can find live at https://mobilitydb-sqlalchemy-demo.adonmo.com/. The code for this demo app is open source and available on GitHub. Feel free to explore both the demo app and code!

In the following sections, I will explain the most important parts of this demo app, to show how to use mobilitydb-sqlalchemy in your own webapp. If you want to reproduce this demo, you can clone the demo repository and do a “docker-compose up –build” as it automatically sets up this docker image for you along with running the backend and frontend. Just follow the instructions in README.md for more details.

Declaring your models

For the demo, we used a very simple table – with just two columns – an id and a tgeompoint column for the trip data. Using mobilitydb-sqlalchemy this is as simple as defining any regular table:

from flask_sqlalchemy import SQLAlchemy
from mobilitydb_sqlalchemy import TGeomPoint

db = SQLAlchemy()

class Trips(db.Model):
   __tablename__ = "trips"
   trip_id = db.Column(db.Integer, primary_key=True)
   trip = db.Column(TGeomPoint)

Note: The library also allows you to use the Trajectory class from MovingPandas as well. More about this is explained later in this tutorial.

Populating data

When adding data to the table, mobilitydb-sqlalchemy expects data in the tgeompoint column to be a time indexed pandas dataframe, with two columns – one for the spatial data  called “geometry” with Shapely Point objects and one for the temporal data “t” as regular python datetime objects.

from datetime import datetime
from shapely.geometry import Point

# Prepare and insert the data
# Typically it won’t be hardcoded like this, but it might be coming from 
# other data sources like a different database or maybe csv files
df = pd.DataFrame(
   [
       {"geometry": Point(0, 0), "t": datetime(2012, 1, 1, 8, 0, 0),},
       {"geometry": Point(2, 0), "t": datetime(2012, 1, 1, 8, 10, 0),},
       {"geometry": Point(2, -1.9), "t": datetime(2012, 1, 1, 8, 15, 0),},
   ]
).set_index("t")

trip = Trips(trip_id=1, trip=df)
db.session.add(trip)
db.session.commit()

Writing queries

In the demo, you see two modes. Both modes were designed specifically to explain how functions defined within MobilityDB can be leveraged by our webapp.

1. All trips mode – In this mode, we extract all trip data, along with distance travelled within each trip, and the average speed in that trip, both computed by MobilityDB itself using the ‘length’, ‘speed’ and ‘twAvg’ functions. This example also shows that MobilityDB functions can be chained to form more complicated queries.

mobilitydb-sqlalchemy-demo-1

trips = db.session.query(
   Trips.trip_id,
   Trips.trip,
   func.length(Trips.trip),
   func.twAvg(func.speed(Trips.trip))
).all()

2. Spatial query mode – In this mode, we extract only selective trip data, filtered by a user-selected region of interest. We then make a query to MobilityDB to extract only the trips which pass through the specified region. We use MobilityDB’s ‘intersects’ function to achieve this filtering at the database level itself.
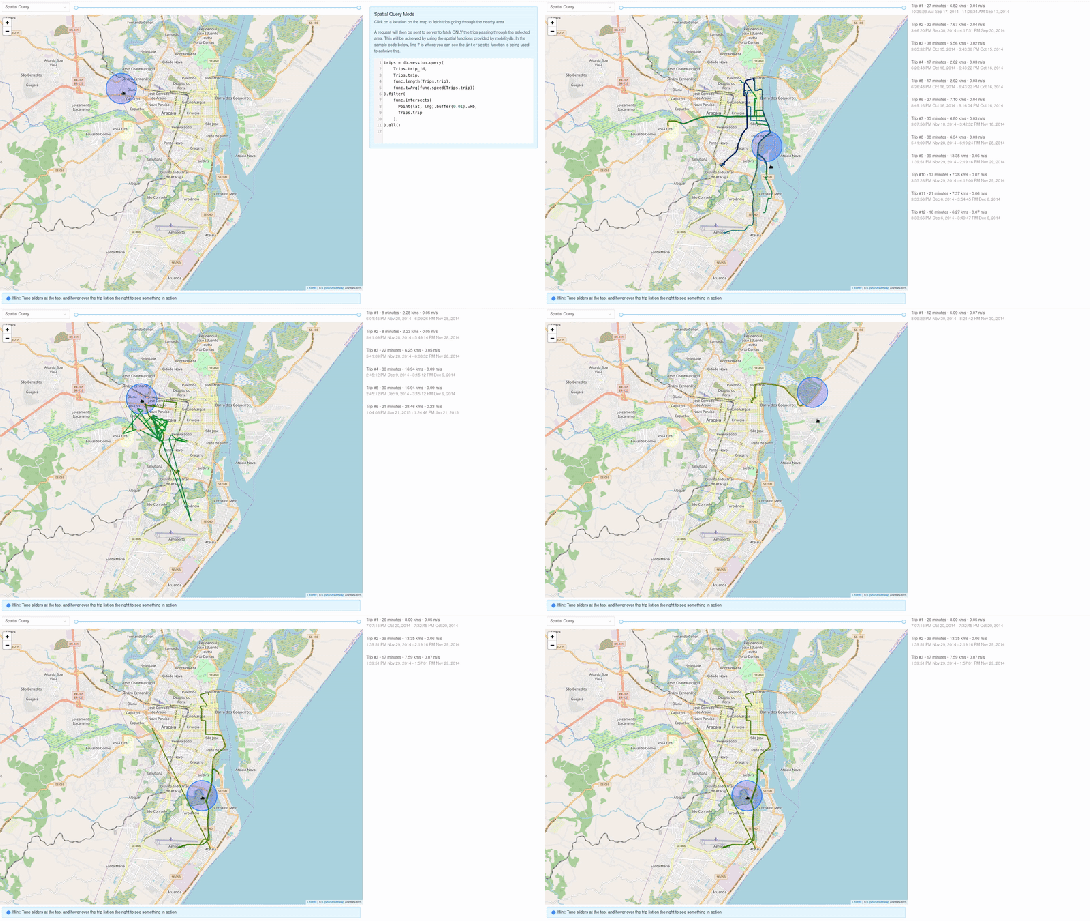
mobilitydb-sqlalchemy-demo-2

trips = db.session.query(
   Trips.trip_id,
   Trips.trip,
   func.length(Trips.trip),
   func.twAvg(func.speed(Trips.trip))
).filter(
   func.intersects(Point(lat, lng).buffer(0.01).wkb, Trips.trip),
).all()

Using MovingPandas Trajectory objects

Mobilitydb-sqlalchemy also provides first-class support for MovingPandas Trajectory objects, which can be installed as an optional dependency of this library. Using this Trajectory class instead of plain DataFrames allows us to make use of much richer functionality over trajectory data like analysis speed, interpolation, splitting and simplification of trajectory points, calculating bounding boxes, etc. To make use of this feature, you have set the use_movingpandas flag to True while declaring your model, as shown in the below code snippet.

class TripsWithMovingPandas(db.Model):
   __tablename__ = "trips"
   trip_id = db.Column(db.Integer, primary_key=True)
   trip = db.Column(TGeomPoint(use_movingpandas=True))

Now when you query over this table, you automatically get the data parsed into Trajectory objects without having to do anything else. This also works during insertion of data – you can directly assign your movingpandas Trajectory objects to the trip column. In the below code snippet we show how inserting and querying works with movingpandas mode.

from datetime import datetime
from shapely.geometry import Point

# Prepare and insert the data
# Typically it won’t be hardcoded like this, but it might be coming from 
# other data sources like a different database or maybe csv files
df = pd.DataFrame(
   [
       {"geometry": Point(0, 0), "t": datetime(2012, 1, 1, 8, 0, 0),},
       {"geometry": Point(2, 0), "t": datetime(2012, 1, 1, 8, 10, 0),},
       {"geometry": Point(2, -1.9), "t": datetime(2012, 1, 1, 8, 15, 0),},
   ]
).set_index("t")

geo_df = GeoDataFrame(df)
traj = mpd.Trajectory(geo_df, 1)

trip = Trips(trip_id=1, trip=traj)
db.session.add(trip)
db.session.commit()

# Querying over this table would automatically map the resulting tgeompoint 
# column to movingpandas’ Trajectory class
result = db.session.query(TripsWithMovingPandas).filter(
   TripsWithMovingPandas.trip_id == 1
).first()

print(result.trip.__class__)
# <class 'movingpandas.trajectory.Trajectory'>

Bonus: trajectory data serialization

Along with mobilitydb-sqlalchemy, recently I have also released trajectory data serialization/compression libraries based on Google’s Encoded Polyline Format Algorithm, for python and javascript called trajectory and trajectory.js respectively. These libraries let you send trajectory data in a compressed format, resulting in smaller payloads if sending your data through human-readable serialization formats like JSON. In some of the internal APIs we use at Adonmo, we have seen this reduce our response sizes by more than half (>50%) sometimes upto 90%.

Want to learn more about mobilitydb-sqlalchemy? Check out the quick start & documentation.


This post is part of a series. Read more about movement data in GIS.

Movement data in GIS #28: open geospatial tools for movement data exploration

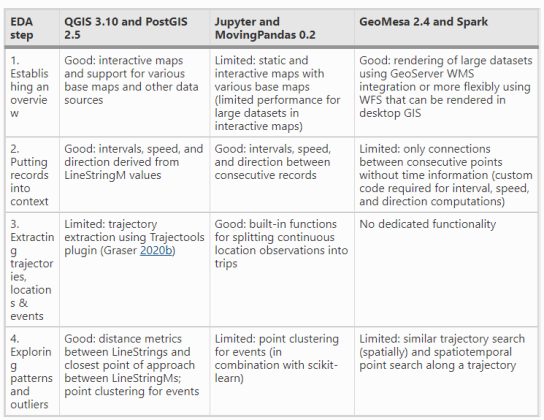
We recently published a new paper on “Open Geospatial Tools for Movement Data Exploration” (open access). If you liked Movement data in GIS #26: towards a template for exploring movement data, you will find even more information about the context, challenges, and recent developments in this paper.

It also presents three open source stacks for movement data exploration:

  1. QGIS + PostGIS: a combination that will be familiar to most open source GIS users
  2. Jupyter + MovingPandas: less common so far, but Jupyter notebooks are quickly gaining popularity (even in the proprietary GIS world)
  3. GeoMesa + Spark: for when datasets become too big to handle using other means

and discusses their capabilities and limitations:


This post is part of a series. Read more about movement data in GIS.

Movement data in GIS #27: extracting trip origin clusters from MovingPandas trajectories

This post is a follow-up to the draft template for exploring movement data I wrote about in my previous post. Specifically, I want to address step 4: Exploring patterns in trajectory and event data.

The patterns I want to explore in this post are clusters of trip origins. The case study presented here is an extension of the MovingPandas ship data analysis notebook.

The analysis consists of 4 steps:

  1. Splitting continuous GPS tracks into individual trips
  2. Extracting trip origins (start locations)
  3. Clustering trip origins
  4. Exploring clusters

Since I have already removed AIS records with a speed over ground (SOG) value of zero from the dataset, we can use the split_by_observation_gap() function to split the continuous observations into individual trips. Trips that are shorter than 100 meters are automatically discarded as irrelevant clutter:

traj_collection.min_length = 100
trips = traj_collection.split_by_observation_gap(timedelta(minutes=5))

The split operation results in 302 individual trips:

Passenger vessel trajectories are blue, high-speed craft green, tankers red, and cargo vessels orange. Other vessel trajectories are gray.

To extract trip origins, we can use the get_start_locations() function. The list of column names defines which columns are carried over from the trajectory’s GeoDataFrame to the origins GeoDataFrame:

 
origins = trips.get_start_locations(['SOG', 'ShipType']) 

The following density-based clustering step is based on a blog post by Geoff Boeing and uses scikit-learn’s DBSCAN implementation:

from sklearn.cluster import DBSCAN
from geopy.distance import great_circle
from shapely.geometry import MultiPoint

origins['lat'] = origins.geometry.y
origins['lon'] = origins.geometry.x
matrix = origins.as_matrix(columns=['lat', 'lon'])

kms_per_radian = 6371.0088
epsilon = 0.1 / kms_per_radian

db = DBSCAN(eps=epsilon, min_samples=1, algorithm='ball_tree', metric='haversine').fit(np.radians(matrix))
cluster_labels = db.labels_
num_clusters = len(set(cluster_labels))
clusters = pd.Series([matrix[cluster_labels == n] for n in range(num_clusters)])
print('Number of clusters: {}'.format(num_clusters))

Resulting in 69 clusters.

Finally, we can add the cluster labels to the origins GeoDataFrame and plot the result:

origins['cluster'] = cluster_labels

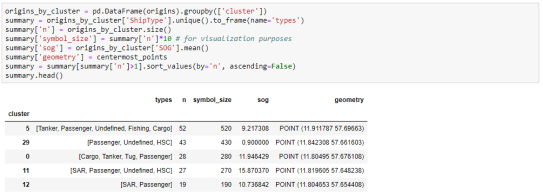
To analyze the clusters, we can compute summary statistics of the trip origins assigned to each cluster. For example, we compute a representative (center-most) point, count the number of trips, and compute the mean speed (SOG) value:

 
def get_centermost_point(cluster):
    centroid = (MultiPoint(cluster).centroid.x, MultiPoint(cluster).centroid.y)
    centermost_point = min(cluster, key=lambda point: great_circle(point, centroid).m)
    return Point(tuple(centermost_point)[1], tuple(centermost_point)[0])
centermost_points = clusters.map(get_centermost_point) 

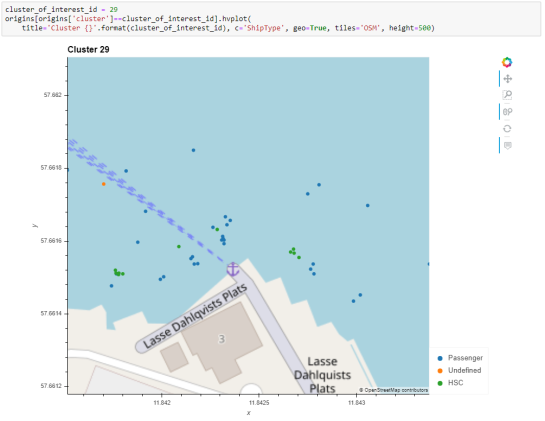
The largest cluster with a low mean speed (indicating a docking or anchoring location) is cluster 29 which contains 43 trips from passenger vessels, high-speed craft, an an undefined vessel:

To explore the overall cluster pattern, we can plot the clusters colored by speed and scaled by the number of trips:

Besides cluster 29, this visualization reveals multiple smaller origin clusters with low speeds that indicate different docking locations in the analysis area.

Cluster locations with high speeds on the other hand indicate locations where vessels enter the analysis area. In a next step, it might be interesting to compute flows between clusters to gain insights about connections and travel times.

It’s worth noting that AIS data contains additional information, such as vessel status, that could be used to extract docking or anchoring locations. However, the workflow presented here is more generally applicable to any movement data tracks that can be split into meaningful trips.

For the full interactive ship data analysis tutorial visit https://mybinder.org/v2/gh/anitagraser/movingpandas/binder-tag


This post is part of a series. Read more about movement data in GIS.

Movement data in GIS #26: towards a template for exploring movement data

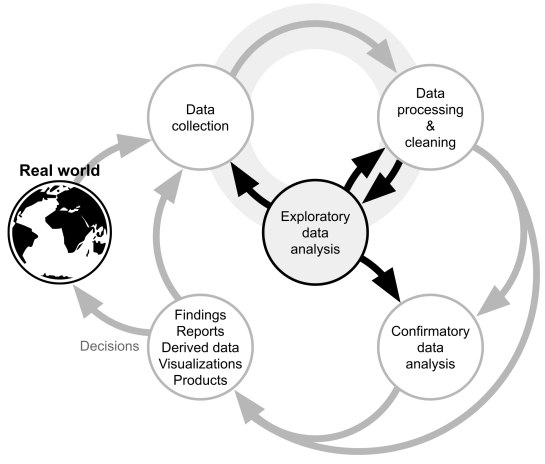
Exploring new datasets can be challenging. Addressing this challenge, there is a whole field called exploratory data analysis that focuses on exploring datasets, often with visual methods.

Concerning movement data in particular, there’s a comprehensive book on the visual analysis of movement by Andrienko et al. (2013) and a host of papers, such as the recent state of the art summary by Andrienko et al. (2017).

However, while the literature does provide concepts, methods, and example applications, these have not yet translated into readily available tools for analysts to use in their daily work. To fill this gap, I’m working on a template for movement data exploration implemented in Python using MovingPandas. The proposed workflow consists of five main steps:

  1. Establishing an overview by visualizing raw input data records
  2. Putting records in context by exploring information from consecutive movement data records (such as: time between records, speed, and direction)
  3. Extracting trajectories & events by dividing the raw continuous tracks into individual trajectories and/or events
  4. Exploring patterns in trajectory and event data by looking at groups of the trajectories or events
  5. Analyzing outliers by looking at potential outliers and how they may challenge preconceived assumptions about the dataset characteristics

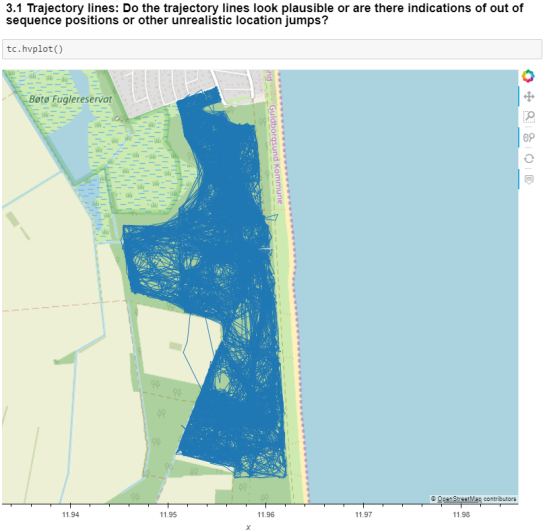
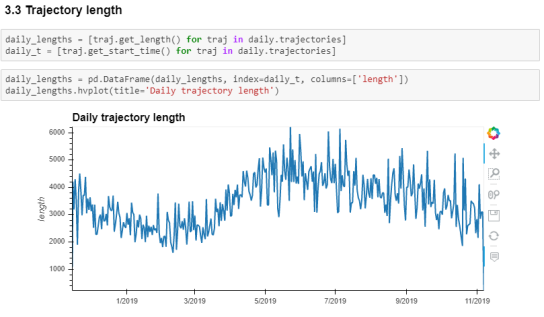
To ensure a reproducible workflow, I’m designing the template as a a Jupyter notebook. It combines spatial and non-spatial plots using the awesome hvPlot library:

This notebook is a work-in-progress and you can follow its development at http://exploration.movingpandas.org. Your feedback is most welcome!


References

  • Andrienko G, Andrienko N, Bak P, Keim D, Wrobel S (2013) Visual analytics of movement. Springer Science & Business Media.
  • Andrienko G, Andrienko N, Chen W, Maciejewski R, Zhao Y (2017) Visual Analytics of Mobility and Transportation: State of the Art and Further Research Directions. IEEE Transactions on Intelligent Transportation Systems 18(8):2232–2249, DOI 10.1109/TITS.2017.2683539

Movement data in GIS #25: moving object databases

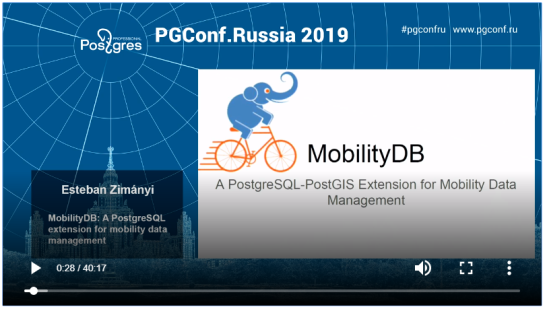
Recently there has been some buzz on Twitter about a new moving object database (MOD) called MobilityDB that builds on PostgreSQL and PostGIS (Zimányi et al. 2019). The MobilityDB Github repo has been published in February 2019 but according to the following presentation at PgConf.Russia 2019 it has been under development for a few years:

Of course, moving object databases have been around for quite a while. The two most commonly cited MODs are HermesDB (Pelekis et al. 2008) which comes as an extension for either PostgreSQL or Oracle and is developed at the University of Piraeus and SECONDO (de Almeida et al. 2006) which is a stand-alone database system developed at the Fernuniversität Hagen. However, both MODs remain at the research prototype level and have not achieved broad adoption.

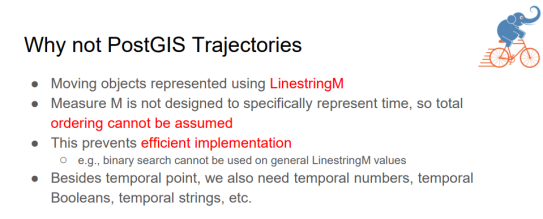
It will be interesting to see if MobilityDB will be able to achieve the goal they have set in the title of Zimányi et al. (2019) to become “a mainstream moving object database system”. It’s promising that they are building on PostGIS and using its mature spatial analysis functionality instead of reinventing the wheel. They also discuss why they decided that PostGIS trajectories (which I’ve written about in previous posts) are not the way to go:

However, the presentation does not go into detail whether there are any straightforward solutions to visualizing data stored in MobilityDB.

According to the Github readme, MobilityDB runs on Linux and needs PostGIS 2.5. They also provide an online demo as well as a Docker container with MobilityDB and all its dependencies. If you give it a try, I would love to hear about your experiences.

References

  • de Almeida, V. T., Guting, R. H., & Behr, T. (2006). Querying moving objects in secondo. In 7th International Conference on Mobile Data Management (MDM’06) (pp. 47-47). IEEE.
  • Pelekis, N., Frentzos, E., Giatrakos, N., & Theodoridis, Y. (2008). HERMES: aggregative LBS via a trajectory DB engine. In Proceedings of the 2008 ACM SIGMOD international conference on Management of data (pp. 1255-1258). ACM.
  • Zimányi, E., Sakr, M., Lesuisse, A., & Bakli, M. (2019). MobilityDB: A Mainstream Moving Object Database System. In Proceedings of the 16th International Symposium on Spatial and Temporal Databases (pp. 206-209). ACM.

This post is part of a series. Read more about movement data in GIS.

Movement data in GIS #24: MovingPandas hands-on tutorials

Last week, I had the pleasure to give a movement data analysis workshop at the OpenGeoHub summer school at the University of Münster in Germany. The workshop materials consist of three Jupyter notebooks that have been designed to also support self-study outside of a workshop setting. So you can try them out as well!

All materials are available on Github:

  • Tutorial 0 provides an introduction to the MovingPandas Trajectory class.
  • Tutorials 1 and 2 provide examples with real-world datasets covering one day of ship movement near Gothenburg and multiple years of gull migration, respectively.

Here’s a quick preview of the bird migration data analysis tutorial (click for full size):

Tutorial 2: Bird migration data analysis

You can run all three Jupyter notebooks online using MyBinder (no installations required).

Alternatively or if you want to dig deeper: installation instructions are available on movingpandas.org

The OpenGeoHub summer school this year had a strong focus on spatial analysis with R and GRASS (sometimes mixing those two together). It was great to meet @mdsumner (author of R trip) and @edzerpebesma (author of R trajectories) for what might have well been the ultimate movement data libraries geek fest. In the ultimate R / Python cross-over,  0_getting_started.Rmd

Both talks and workshops have been recorded. Here’s the introduction:

and this is the full workshop recording:


This post is part of a series. Read more about movement data in GIS.

Movement data in GIS #23: trajectories in context

Today’s post continues where “Why you should be using PostGIS trajectories” leaves off. It’s the result of a collaboration with Eva Westermeier. I had the pleasure to supervise her internship at AIT last year and also co-supervised her Master’s thesis [0] on the topic of enriching trajectories with information about their geographic context.

Context-aware analysis of movement data is crucial for different domains and applications, from transport to ecology. While there is a wealth of data, efficient and user-friendly contextual trajectory analysis is still hampered by a lack of appropriate conceptual approaches and practical methods. (Westermeier, 2018)

Part of the work was focused on evaluating different approaches to adding context information from vector datasets to trajectories in PostGIS. For example, adding land cover context to animal movement data or adding information on anchoring and harbor areas to vessel movement data.

Classic point-based model vs. line-based model

The obvious approach is to intersect the trajectory points with context data. This is the classic point data model of contextual trajectories. It’s straightforward to add context information in the point-based model but it also generates large numbers of repeating annotations. In contrast, the line data model using, for example, PostGIS trajectories (LinestringM) is more compact since trajectories can be split into segments at context borders. This creates one annotation per segment and the individual segments are convenient to analyze (as described in part #12).

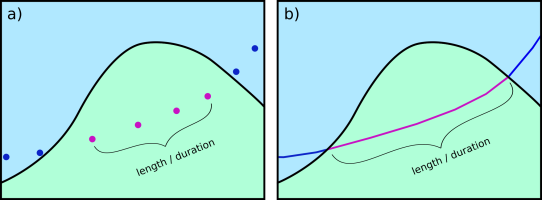
Spatio-temporal interpolation as provided by the line data model offers additional advantages for the analysis of annotated segments. Contextual segments start and end at the intersection of the trajectory linestring with context polygon borders. This means that there are no gaps like in the point-based model. Consequently, while the point-based model systematically underestimates segment length and duration, the line-based approach offers more meaningful segment length and duration measurements.

Schematic illustration of a subset of an annotated trajectory in two context classes, a) systematic underestimation of length or duration in the point data model, b) full length or duration between context polygon borders in the line data model (source: Westermeier (2018))

Another issue of the point data model is that brief context changes may be missed or represented by just one point location. This makes it impossible to compute the length or duration of the respective context segment. (Of course, depending on the application, it can be desirable to ignore brief context changes and make the annotation process robust towards irrelevant changes.)

Schematic illustration of context annotation for brief context changes, a) and b)
two variants for the point data model, c) gapless annotation in the line data model (source: Westermeier (2018) based on Buchin et al. (2014))

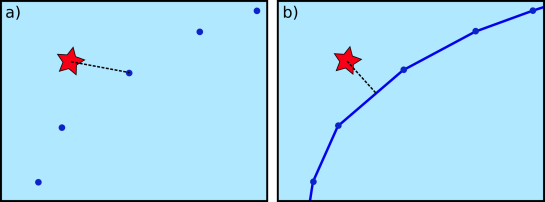
Beyond annotations, context can also be considered directly in an analysis, for example, when computing distances between trajectories and contextual point objects. In this case, the point-based approach systematically overestimates the distances.

Schematic illustration of distance measurement from a trajectory to an external
object, a) point data model, b) line data model (source: Westermeier (2018))

The above examples show that there are some good reasons to dump the classic point-based model. However, the line-based model is not without its own issues.

Issues

Computing the context annotations for trajectory segments is tricky. The main issue is that ST_Intersection drops the M values. This effectively destroys our trajectories! There are ways to deal with this issue – and the corresponding SQL queries are published in the thesis (p. 38-40) – but it’s a real bummer. Basically, ST_Intersection only provides geometric output. Therefore, we need to reconstruct the temporal information in order to create usable trajectory segments.

Finally, while the line-based model is well suited to add context from other vector data, it is less useful for context data from continuous rasters but that was beyond the scope of this work.

Conclusion

After the promising results of my initial investigations into PostGIS trajectories, I was optimistic that context annotations would be a straightforward add-on. The line-based approach has multiple advantages when it comes to analyzing contextual segments. Unfortunately, generating these contextual segments is much less convenient and also slower than I had hoped. Originally, I had planned to turn this work into a plugin for the Processing toolbox but the results of this work motivated me to look into other solutions. You’ve already seen some of the outcomes in part #20 “Trajectools v1 released!”.

References

[0] Westermeier, E.M. (2018). Contextual Trajectory Modeling and Analysis. Master Thesis, Interfaculty Department of Geoinformatics, University of Salzburg.


This post is part of a series. Read more about movement data in GIS.

Movement data in GIS #20: Trajectools v1 released!

In previous posts, I already wrote about Trajectools and some of the functionality it provides to QGIS Processing including:

There are also tools to compute heading and speed which I only talked about on Twitter.

Trajectools is now available from the QGIS plugin repository.

The plugin includes sample data from MarineCadastre downloads and the Geolife project.

Under the hood, Trajectools depends on GeoPandas!

If you are on Windows, here’s how to install GeoPandas for OSGeo4W:

  1. OSGeo4W installer: install python3-pip
  2. Environment variables: add GDAL_VERSION = 2.3.2 (or whichever version your OSGeo4W installation currently includes)
  3. OSGeo4W shell: call C:\OSGeo4W64\bin\py3_env.bat
  4. OSGeo4W shell: pip3 install geopandas (this will error at fiona)
  5. From https://www.lfd.uci.edu/~gohlke/pythonlibs/#fiona: download Fiona-1.7.13-cp37-cp37m-win_amd64.whl
  6. OSGeo4W shell: pip3 install path-to-download\Fiona-1.7.13-cp37-cp37m-win_amd64.whl
  7. OSGeo4W shell: pip3 install geopandas
  8. (optionally) From https://www.lfd.uci.edu/~gohlke/pythonlibs/#rtree: download Rtree-0.8.3-cp37-cp37m-win_amd64.whl and pip3 install it

If you want to use this functionality outside of QGIS, head over to my movingpandas project!

Movement data in GIS #19: splitting trajectories by date

Many current movement data sources provide more or less continuous streams of object locations. For example, the AIS system provides continuous locations of vessels (mostly ships). This continuous stream of locations – let’s call it track – starts when we first record the vessel and ends with the last record. This start and end does not necessarily coincide with the start or end of a vessel voyage from one port to another. The stream start and end do not have any particular meaning. Instead, if we want to see what’s going on, we need to split the track into meaningful segments. One such segmentation – albeit a simple one – is to split tracks by day. This segmentation assumes that day/night changes affect the movement of our observed object. For many types of objects – those who mostly stay still during the night – this will work reasonably well.

For example, the following screenshot shows raw data of one particular vessel in the Boston region. By default, QGIS provides a Points to Path to convert points to lines. This tool takes one “group by” and one “order by” field. Therefore, if we want one trajectory per ship per day, we’d first have to create a new field that combines ship ID and day so that we can use this combination as a “group by” field. Additionally, the resulting lines loose all temporal information.

To simplify this workflow, Trajectools now provides a new algorithm that creates day trajectories and outputs LinestringM features. Using the Day trajectories from point layer tool, we can immediately see that our vessel of interest has been active for three consecutive days: entering our observation area on Nov 5th, moving to Boston where it stayed over night, then moving south to Weymouth on the next day, and leaving on the 7th.

Since the resulting trajectories are LinestringM features with time information stored in the M value, we can also visualize the speed of movement (as discussed in part #2 of this series):

Movement data in GIS #21: new interactive notebook to get started with MovingPandas

MovingPandas is my attempt to provide a pure Python solution for trajectory data handling in GIS. MovingPandas provides trajectory classes and functions built on top of GeoPandas. 

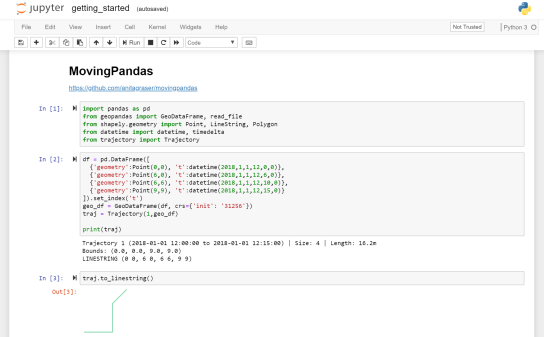
To lower the entry barrier to getting started with MovingPandas, there’s now an interactive iPython notebook hosted on MyBinder. This notebook provides all the necessary imports and demonstrates how to create a Trajectory object.

Launch MyBinder for MovingPandas to get started!

Movement data in GIS and the AI hype

This post looks into the current AI hype and how it relates to geoinformatics in general and movement data analysis in GIS in particular. This is not an exhaustive review but aims to highlight some of the development within these fields. There are a lot of references in this post, including some to previous work of mine, so you can dive deeper into this topic on your own.

I’m looking forward to reading your take on this topic in the comments!

Introduction to AI

The dream of artificial intelligence (AI) that can think like a human (or even outsmart one) reaches back to the 1950s (Fig. 1, Tandon 2016). Machine learning aims to enable AI. However, classic machine learning approaches that have been developed over the last decades (such as: decision trees, inductive logic programming, clustering, reinforcement learning, neural networks, and Bayesian networks) have failed to achieve the goal of a general AI that would rival humans. Indeed, even narrow AI (technology that can only perform specific tasks) was mostly out of reach (Copeland 2018).

However, recent increases in computing power (be it GPUs, TPUs or CPUs) and algorithmic advances, particularly those based on neural networks, have made this dream (or nightmare) come closer (Rao 2017) and are fueling the current AI hype. It should be noted that artificial neural networks (ANN) are not a new technology. In fact, they used to be not very popular because they require large amounts of input data and computational power. However, in 2012, Andrew Ng at Google managed to create large enough neural networks and train them with massive amounts of data, an approach now know as deep learning (Copeland 2018).

Fig. 1: The evolution of artificial intelligence, machine learning, and deep learning. (Image source: Tandon 2016)

Machine learning & GIS

GIScience or geoinformatics is not new to machine learning. The most well-known application is probably supervised image classification, as implemented in countless commercial and open tools. This approach requires labeled training and test data (Fig. 2) to learn a prediction model that can, for example, classify land cover in remote sensing imagery. Many classification algorithms have been introduced, ranging from maximum likelihood classification to clustering (Congedo 2016) and neural networks.

Fig. 2: With supervised machine learning, the algorithm learns from labeled data. (Image source: Salian 2018)

Like in other fields, neural networks have intrigued geographers and GIScientists for a long time. For example, Hewitson & Crane (1994) state that “Neural nets offer a fascinating new strategy for spatial analysis, and their application holds enormous potential for the geographic sciences.” Early uses of neural network in GIScience include, for example: spatial interaction modeling (Openshaw 1998) and hydrological modeling of rainfall runoff (Dawson & Wilby 2001). More recently, neural networks and deep learning have enabled object recognition in georeferenced images. Most prominently, the research team at Mapillary (2016-2019) works on object recognition in street-level imagery (including fusion with other spatial data sources). Even Generative adversarial networks (GANs) (Fig. 3) have found their application in GIScience: for example, Zhu et al. (2017) (at the Berkeley AI Research (BAIR) laboratory) demonstrate how GANs can generate road maps from aerial images and vice versa, and Zhu et al. (2019) generate artificial digital elevation models.

Fig. 3: In a GAN, the discriminator is shown images from both the generator and from the training dataset. The discriminator is tasked with determining which images are real, and which are fakes from the generator. (Image source: Salian 2018)

However, besides general excitement about new machine learning approaches, researchers working on spatial analysis (Openshaw & Turton 1996) caution that “conventional classifiers, as provided in statistical packages, completely ignore most of the challenges of spatial data classification and handle a few inappropriately from a geographical perspective”. For example, data transformation using principal component or factor scores is sensitive to non-normal data distribution common in geographic data and many methods ignore spatial autocorrelation completely (Openshaw & Turton 1996). And neural networks are no exception: Convolutional neural networks (CNNs) are generally regarded appropriate for any problem involving pixels or spatial representations. However, Liu et al. (2018) demonstrate that they fail even for the seemingly trivial coordinate transform problem, which requires learning a mapping between coordinates in (x, y) Cartesian space and coordinates in one-hot pixel space.

The integration of spatial data challenges into machine learning is an ongoing area of research, for example in geostatistics (Hengl & Heuvelink 2019).

Machine learning and movement data

More and more movement data of people, vehicles, goods, and animals is becoming available. Developments in intelligent transportation systems specifically have been sparked by the availability of cheap GPS receivers and many models have been built that leverage floating car data (FCD) to classify traffic situations (for example, using visual analysis (Graser et al. 2012)), predict traffic speeds (for example, using linear regression models (Graser et al. 2016)), or detect movement anomalies (for example, using Gaussian mixture models (Graser & Widhalm 2018)). Beyond transportation, Valletta et al. (2017) describe applications of machine learning in animal movement and behavior.

Of course deep learning is making its way into movement data analysis as well. For example, Wang et al. (2018) and Kudinov (2018) trained neural networks to predict travel times in a transport networks. In contrast to conventional travel time prediction models (based on street graphs with associated speeds or travel times), these are considerably more computationally intensive. Kudinov (2018) for example, used 300 million simulated trips (start and end location, start time, and trip duration) as input and “spent about eight months of running one of the GP100 cards 24-7 in a search for an efficient architecture, spatial and statistical distributions of the training set, good values for multiple hyperparameters”.  More recently, Zhang et al. (2019) (at Microsoft Research Asia) used deep learning to predict flows in spatio-temporal networks. It remains to be seen if deep learning will manage to out-perform classical machine learning approaches for predictions in the transportation sector.

What would a transportation AI look like? Would it be able to drive a car and follow data-driven route recommendations (e.g. from waze.com) or would it purposefully ignore them because other – more basic systems – blindly follow it? Logistics AI might build on these kind of systems while simultaneously optimizing large fleets of vehicles. Transport planning AI might replace transport planners by providing reliable mobility demand predictions as well as resulting traffic models for varying infrastructure and policy scenarios.

Conclusions

The opportunities for using ML in geoinformatics are extensive and have been continuously explored for a multitude of different research problems and applications (from land use classification to travel time prediction). Geoinformatics is largely playing catch-up with the quick development in machine learning (including deep learning) that promise new and previously unseen possibilities. At the same time, it is necessary that geoinformatics researchers are aware of the particularities of spatial data, for example, by developing models that take spatial autocorrelation into account. Future research in geoinformatics should incorporate learnings from geostatistics to ensure that resulting machine learning models incorporate the geographical perspective.

References

  • Congedo, L. (2016). Semi-Automatic Classification Plugin Documentation. DOI: http://dx.doi.org/10.13140/RG.2.2.29474.02242/1
  • Copeland, M. (2016) What’s the Difference Between Artificial Intelligence, Machine Learning, and Deep Learning? https://blogs.nvidia.com/blog/2016/07/29/whats-difference-artificial-intelligence-machine-learning-deep-learning-ai/
  • Dawson, C. W., & Wilby, R. L. (2001). Hydrological modelling using artificial neural networks. Progress in physical Geography, 25(1), 80-108.
  • Graser, A., Ponweiser, W., Dragaschnig, M., Brandle, N., & Widhalm, P. (2012). Assessing traffic performance using position density of sparse FCD. In Intelligent Transportation Systems (ITSC), 2012 15th International IEEE Conference on (pp. 1001-1005). IEEE.
  • Graser, A., Leodolter, M., Koller, H., & Brändle, N. (2016) Improving vehicle speed estimates using street network centrality. International Journal of Cartography. doi:10.1080/23729333.2016.1189298.
  • Graser, A., & Widhalm, P. (2018). Modelling Massive AIS Streams with Quad Trees and Gaussian Mixtures. In: Mansourian, A., Pilesjö, P., Harrie, L., & von Lammeren, R. (Eds.), 2018. Geospatial Technologies for All : short papers, posters and poster abstracts of the 21th AGILE Conference on Geographic Information Science. Lund University 12-15 June 2018, Lund, Sweden. ISBN 978-3-319-78208-9. Accessible through https://agile-online.org/index.php/conference/proceedings/proceedings-2018
  • Hengl, T. Heuvelink, G.B.M. (2019) Workshop on Machine learning as a framework for predictive soil mapping https://www.cvent.com/events/pedometrics-2019/custom-116-81b34052775a43fcb6616a3f6740accd.aspx?dvce=1
  • Hewitson, B., Crane, R. G. (Eds.) (1994) Neural Nets: Applications in Geography. Springer.
  • Kudinov, D. (2018) Predicting travel times with artificial neural network and historical routes. https://community.esri.com/community/gis/applications/arcgis-pro/blog/2018/03/27/predicting-travel-times-with-artificial-neural-network-and-historical-routes
  • Liu, R., Lehman, J., Molino, P., Such, F. P., Frank, E., Sergeev, A., & Yosinski, J. (2018). An intriguing failing of convolutional neural networks and the coordconv solution. In Advances in Neural Information Processing Systems (pp. 9605-9616).
  • Mapillary Research (2016-2019) publications listed on https://research.mapillary.com/
  • Openshaw, S., & Turton, I. (1996). A parallel Kohonen algorithm for the classification of large spatial datasets. Computers & Geosciences, 22(9), 1019-1026.
  • Openshaw, S. (1998). Neural network, genetic, and fuzzy logic models of spatial interaction. Environment and Planning A, 30(10), 1857-1872.
  • Rao, R. C.S. (2017) New Product breakthroughs with recent advances in deep learning and future business opportunities. https://mse238blog.stanford.edu/2017/07/ramdev10/new-product-breakthroughs-with-recent-advances-in-deep-learning-and-future-business-opportunities/
  • Salian, I. (2018) SuperVize Me: What’s the Difference Between Supervised, Unsupervised, Semi-Supervised and Reinforcement Learning? https://blogs.nvidia.com/blog/2018/08/02/supervised-unsupervised-learning/
  • Tandon, K. (2016) AI & Machine Learning: The evolution, differences and connections https://www.linkedin.com/pulse/ai-machine-learning-evolution-differences-connections-kapil-tandon/
  • Valletta, J. J., Torney, C., Kings, M., Thornton, A., & Madden, J. (2017). Applications of machine learning in animal behaviour studies. Animal Behaviour, 124, 203-220.
  • Wang, D., Zhang, J., Cao, W., Li, J., & Zheng, Y. (2018). When will you arrive? estimating travel time based on deep neural networks. In Thirty-Second AAAI Conference on Artificial Intelligence.
  • Zhang, J., Zheng, Y., Sun, J., & Qi, D. (2019). Flow Prediction in Spatio-Temporal Networks Based on Multitask Deep Learning. IEEE Transactions on Knowledge and Data Engineering.
  • Zhu, J. Y., Park, T., Isola, P., & Efros, A. A. (2017). Unpaired image-to-image translation using cycle-consistent adversarial networks. In Proceedings of the IEEE international conference on computer vision (pp. 2223-2232).
  • Zhu, D., Cheng, X., Zhang, F., Yao, X., Gao, Y., & Liu, Y. (2019). Spatial interpolation using conditional generative adversarial neural networks. International Journal of Geographical Information Science, 1-24.

This post is part of a series. Read more about movement data in GIS.

Movement data in GIS #18: creating evaluation data for trajectory predictions

We’ve seen a lot of explorative movement data analysis in the Movement data in GIS series so far. Beyond exploration, predictive analysis is another major topic in movement data analysis. One of the most obvious movement prediction use cases is trajectory prediction, i.e. trying to predict where a moving object will be in the future. The two main categories of trajectory prediction methods I see are those that try to predict the actual path that a moving object will take versus those that only try to predict the next destination.

Today, I want to focus on prediction methods that predict the path that a moving object is going to take. There are many different approaches from simple linear prediction to very sophisticated application-dependent methods. Regardless of the prediction method though, there is the question of how to evaluate the prediction results when these methods are applied to real-life data.

As long as we work with nice, densely, and regularly updated movement data, extracting evaluation samples is rather straightforward. To predict future movement, we need some information about past movement. Based on that past movement, we can then try to predict future positions. For example, given a trajectory that is twenty minutes long, we can extract a sample that provides five minutes of past movement, as well as the actually observed position five minutes into the future:

But what if the trajectory is irregularly updated? Do we interpolate the positions at the desired five minute timestamps? Do we try to shift the sample until – by chance – we find a section along the trajectory where the updates match our desired pattern? What if location timestamps include seconds or milliseconds and we therefore cannot find exact matches? Should we introduce a tolerance parameter that would allow us to match locations with approximately the same timestamp?

Depending on the duration of observation gaps in our trajectory, it might not be a good idea to simply interpolate locations since these interpolated locations could systematically bias our evaluation. Therefore, the safest approach may be to shift the sample pattern along the trajectory until a close match (within the specified tolerance) is found. This approach is now implemented in MovingPandas’ TrajectorySampler.

def test_sample_irregular_updates(self):
    df = pd.DataFrame([
        {'geometry':Point(0,0), 't':datetime(2018,1,1,12,0,1)},
        {'geometry':Point(0,3), 't':datetime(2018,1,1,12,3,2)},
        {'geometry':Point(0,6), 't':datetime(2018,1,1,12,6,1)},
        {'geometry':Point(0,9), 't':datetime(2018,1,1,12,9,2)},
        {'geometry':Point(0,10), 't':datetime(2018,1,1,12,10,2)},
        {'geometry':Point(0,14), 't':datetime(2018,1,1,12,14,3)},
        {'geometry':Point(0,19), 't':datetime(2018,1,1,12,19,4)},
        {'geometry':Point(0,20), 't':datetime(2018,1,1,12,20,0)}
        ]).set_index('t')
    geo_df = GeoDataFrame(df, crs={'init': '4326'})
    traj = Trajectory(1,geo_df)
    sampler = TrajectorySampler(traj, timedelta(seconds=5))
    past_timedelta = timedelta(minutes=5)
    future_timedelta = timedelta(minutes=5)
    sample = sampler.get_sample(past_timedelta, future_timedelta)
    result = sample.future_pos.wkt
    expected_result = "POINT (0 19)"
    self.assertEqual(result, expected_result)
    result = sample.past_traj.to_linestring().wkt
    expected_result = "LINESTRING (0 9, 0 10, 0 14)"
    self.assertEqual(result, expected_result)

The repository also includes a demo that illustrates how to split trajectories using a grid and finally extract samples:


Movement data in GIS #17: spatial analysis of GeoPandas trajectories

In Movement data in GIS #16, I presented a new way to deal with trajectory data using GeoPandas and how to load the trajectory GeoDataframes as a QGIS layer. Following up on this initial experiment, I’ve now implemented a first version of an algorithm that performs a spatial analysis on my GeoPandas trajectories.

The first spatial analysis algorithm I’ve implemented is Clip trajectories by extent. Implementing this algorithm revealed a couple of pitfalls:

  • To achieve correct results, we need to compute spatial intersections between linear trajectory segments and the extent. Therefore, we need to convert our point GeoDataframe to a line GeoDataframe.
  • Based on the spatial intersection, we need to take care of computing the corresponding timestamps of the events when trajectories enter or leave the extent.
  • A trajectory can intersect the extent multiple times. Therefore, we cannot simply use the global minimum and maximum timestamp of intersecting segments.
  • GeoPandas provides spatial intersection functionality but if the trajectory contains consecutive rows without location change, these will result in zero length lines and those cause an empty intersection result.

So far, the clip result only contains the trajectory id plus a suffix indicating the sequence of the intersection segments for a specific trajectory (because one trajectory can intersect the extent multiple times). The following screenshot shows one highlighted trajectory that intersects the extent three times and the resulting clipped trajectories:

This algorithm together with the basic trajectory from points algorithm is now available in a Processing algorithm provider plugin called Processing Trajectory.

Note: This plugin depends on GeoPandas.

Note for Windows users: GeoPandas is not a standard package that is available in OSGeo4W, so you’ll have to install it manually. (For the necessary steps, see this answer on gis.stackexchange.com)

The implemented tests show how to use the Trajectory class independently of QGIS. So far, I’m only testing the spatial properties though:

def test_two_intersections_with_same_polygon(self):
    polygon = Polygon([(5,-5),(7,-5),(7,12),(5,12),(5,-5)])
    data = [{'id':1, 'geometry':Point(0,0), 't':datetime(2018,1,1,12,0,0)},
        {'id':1, 'geometry':Point(6,0), 't':datetime(2018,1,1,12,10,0)},
        {'id':1, 'geometry':Point(10,0), 't':datetime(2018,1,1,12,15,0)},
        {'id':1, 'geometry':Point(10,10), 't':datetime(2018,1,1,12,30,0)},
        {'id':1, 'geometry':Point(0,10), 't':datetime(2018,1,1,13,0,0)}]
    df = pd.DataFrame(data).set_index('t')
    geo_df = GeoDataFrame(df, crs={'init': '31256'})
    traj = Trajectory(1, geo_df)
    intersections = traj.intersection(polygon)
    result = []
    for x in intersections:
        result.append(x.to_linestring())
    expected_result = [LineString([(5,0),(6,0),(7,0)]), LineString([(7,10),(5,10)])]
    self.assertEqual(result, expected_result) 

One issue with implementing the algorithms as QGIS Processing tools in this way is that the tools are independent of one another. That means that each tool has to repeat the expensive step of creating the trajectory objects in memory. I’m not sure this can be solved.

Movement data in GIS #16: towards pure Python trajectories using GeoPandas

Many of my previous posts in this series [1][2][3] have relied on PostGIS for trajectory data handling. While I love PostGIS, it feels like overkill to require a database to analyze smaller movement datasets. Wouldn’t it be great to have a pure Python solution?

If we look into moving object data literature, beyond the “trajectories are points with timestamps” perspective, which is common in GIS, we also encounter the “trajectories are time series with coordinates” perspective. I don’t know about you, but if I hear “time series” and Python, I think Pandas! In the Python Data Science Handbook, Jake VanderPlas writes:

Pandas was developed in the context of financial modeling, so as you might expect, it contains a fairly extensive set of tools for working with dates, times, and time-indexed data.

Of course, time series are one thing, but spatial data handling is another. Lucky for us, this is where GeoPandas comes in. GeoPandas has been around for a while and version 0.4 has been released in June 2018. So far, I haven’t found examples that use GeoPandas to manage movement data, so I’ve set out to give it a shot. My trajectory class uses a GeoDataFrame df for data storage. For visualization purposes, it can be converted to a LineString:

import pandas as pd 
from geopandas import GeoDataFrame
from shapely.geometry import Point, LineString

class Trajectory():
    def __init__(self, id, df, id_col):
        self.id = id
        self.df = df    
        self.id_col = id_col
        
    def __str__(self):
        return "Trajectory {1} ({2} to {3}) | Size: {0}".format(
            self.df.geometry.count(), self.id, self.get_start_time(), 
            self.get_end_time())
        
    def get_start_time(self):
        return self.df.index.min()
        
    def get_end_time(self):
        return self.df.index.max()
        
    def to_linestring(self):
        return self.make_line(self.df)
        
    def make_line(self, df):
        if df.size > 1:
            return df.groupby(self.id_col)['geometry'].apply(
                lambda x: LineString(x.tolist())).values[0]
        else:
            raise RuntimeError('Dataframe needs at least two points to make line!')

    def get_position_at(self, t):
        try:
            return self.df.loc[t]['geometry'][0]
        except:
            return self.df.iloc[self.df.index.drop_duplicates().get_loc(
                t, method='nearest')]['geometry']

Of course, this class can be used in stand-alone Python scripts, but it can also be used in QGIS. The following script takes data from a QGIS point layer, creates a GeoDataFrame, and finally generates trajectories. These trajectories can then be added to the map as a line layer.

All we need to do to ensure that our data is ordered by time is to set the GeoDataFrame’s index to the time field. From then on, Pandas takes care of the time series aspects and we can access the index as shown in the Trajectory.get_position_at() function above.

# Get data from a point layer
l = iface.activeLayer()
time_field_name = 't'
trajectory_id_field = 'trajectory_id' 
names = [field.name() for field in l.fields()]
data = []
for feature in l.getFeatures():
    my_dict = {}
    for i, a in enumerate(feature.attributes()):
        my_dict[names[i]] = a
    x = feature.geometry().asPoint().x()
    y = feature.geometry().asPoint().y()
    my_dict['geometry']=Point((x,y))
    data.append(my_dict)

# Create a GeoDataFrame
df = pd.DataFrame(data).set_index(time_field_name)
crs = {'init': l.crs().geographicCrsAuthId()} 
geo_df = GeoDataFrame(df, crs=crs)
print(geo_df)

# Test if spatial functions work
print(geo_df.dissolve([True]*len(geo_df)).centroid)

# Create a QGIS layer for trajectory lines
vl = QgsVectorLayer("LineString", "trajectories", "memory")
vl.setCrs(l.crs()) # doesn't stop popup :(
pr = vl.dataProvider()
pr.addAttributes([QgsField("id", QVariant.String)])
vl.updateFields() 

df_by_id = dict(tuple(geo_df.groupby(trajectory_id_field)))
trajectories = {}
for key, value in df_by_id.items():
    traj = Trajectory(key, value, trajectory_id_field)
    trajectories[key] = traj
    line = QgsGeometry.fromWkt(traj.to_linestring().wkt)
    f = QgsFeature()
    f.setGeometry(line)
    f.setAttributes([key])
    pr.addFeature(f) 
print(trajectories[1])

vl.updateExtents() 
QgsProject.instance().addMapLayer(vl)

The following screenshot shows this script applied to a sample of the Geolife datasets containing 100 trajectories with a total of 236,776 points. On my notebook, the runtime is approx. 20 seconds.

So far, GeoPandas has proven to be a convenient way to handle time series with coordinates. Trying to implement some trajectory analysis tools will show if it is indeed a promising data structure for trajectories.

Movement data in GIS #15: writing a PL/pgSQL stop detection function for PostGIS trajectories

Do you sometimes start writing an SQL query and around at line 50 you get the feeling that it might be getting out of hand? If so, it might be useful to start breaking it down into smaller chunks and wrap those up into custom functions. Never done that? Don’t despair! There’s an excellent PL/pgSQL tutorial on postgresqltutorial.com to get you started.

To get an idea of the basic structure of a PL/pgSQL function and to proof that PostGIS datatypes work just fine in this context, here’s a basic function that takes a trajectory geometry and outputs its duration, i.e. the difference between its last and first timestamp:

CREATE OR REPLACE FUNCTION AG_Duration(traj geometry) 
RETURNS numeric LANGUAGE 'plpgsql'
AS $BODY$ 
BEGIN
RETURN ST_M(ST_EndPoint(traj))-ST_M(ST_StartPoint(traj));
END; $BODY$;

My end goal for this exercise was to implement a function that takes a trajectory and outputs the stops along this trajectory. Commonly, a stop is defined as a long stay within an area with a small radius. This leads us to the following definition:

CREATE OR REPLACE FUNCTION AG_DetectStops(
   traj geometry, 
   max_size numeric, 
   min_duration numeric)
RETURNS TABLE(sequence integer, geom geometry) 
-- implementation follows here!

Note how this function uses RETURNS TABLE to enable it to return all the stops that it finds. To add a line to the output table, we need to assign values to the sequence and geom variables and then use RETURN NEXT.

Another reason to use PL/pgSQL is that it enables us to write loops. And loops I wanted for my stop detection function! Specifically, I wanted to go through all the points in the trajectory:

FOR pt IN SELECT (ST_DumpPoints(traj)).geom LOOP
-- here comes the magic!
END LOOP;

Eventually the function should go through the trajectory and identify all segments that stay within an area with max_size diameter for at least min_duration time. To test for the area size, we can use:

IF ST_MaxDistance(segment,pt) <= max_size THEN is_stop := true; 

Putting everything together, my current implementation looks like this:

CREATE OR REPLACE FUNCTION AG_DetectStops(
   traj geometry,
   max_size numeric,
   min_duration numeric)
RETURNS TABLE(sequence integer, geom geometry) 
LANGUAGE 'plpgsql'
AS $BODY$
DECLARE 
   pt geometry;
   segment geometry;
   is_stop boolean;
   previously_stopped boolean;
   stop_sequence integer;
   p1 geometry;
BEGIN
segment := NULL;
sequence := 0;
is_stop := false;
previously_stopped := false;
p1 := NULL;
FOR pt IN SELECT (ST_DumpPoints(traj)).geom LOOP
   IF segment IS NULL AND p1 IS NULL THEN 
      p1 := pt; 
   ELSIF segment IS NULL THEN 
      segment := ST_MakeLine(p1,pt); 
      p1 := NULL;
      IF ST_Length(segment) <= max_size THEN is_stop := true; END IF; ELSE segment := ST_AddPoint(segment,pt); -- if we're in a stop, we want to grow the segment, otherwise we remove points to the specified min_duration IF NOT is_stop THEN WHILE ST_NPoints(segment) > 2 AND AG_Duration(ST_RemovePoint(segment,0)) >= min_duration LOOP
            segment := ST_RemovePoint(segment,0); 
         END LOOP;
      END IF;
      -- a stop is identified if the segment stays within a circle of diameter = max_size
      IF ST_Length(segment) <= max_size THEN is_stop := true; ELSIF ST_Distance(ST_StartPoint(segment),pt) > max_size THEN is_stop := false;
      ELSIF ST_MaxDistance(segment,pt) <= max_size THEN is_stop := true; ELSE is_stop := false; END IF; -- if we found the end of a stop, we need to check if it lasted long enough IF NOT is_stop AND previously_stopped THEN IF ST_M(ST_PointN(segment,ST_NPoints(segment)-1))-ST_M(ST_StartPoint(segment)) >= min_duration THEN
            geom := ST_RemovePoint(segment,ST_NPoints(segment)-1); 
            RETURN NEXT;
            sequence := sequence + 1;
            segment := NULL;
            p1 := pt;
         END IF;
      END IF;
   END IF;
   previously_stopped := is_stop;
END LOOP;
IF previously_stopped AND AG_Duration(segment) >= min_duration THEN 
   geom := segment; 
   RETURN NEXT; 
END IF;
END; $BODY$;

While this function is not really short, it’s so much more readable than my previous attempts of doing this in pure SQL. Some of the lines for determining is_stop are not strictly necessary but they do speed up processing.

Performance still isn’t quite where I’d like it to be. I suspect that all the adding and removing points from linestring geometries is not ideal. In general, it’s quicker to find shorter stops in smaller areas than longer stop in bigger areas.

Let’s test! 

Looking for a testing framework for PL/pgSQL, I found plpgunit on Github. While I did not end up using it, I did use its examples for inspiration to write a couple of tests, e.g.

CREATE OR REPLACE FUNCTION test.stop_at_beginning() RETURNS void LANGUAGE 'plpgsql'
AS $BODY$
DECLARE t0 integer; n0 integer;
BEGIN
WITH temp AS ( SELECT AG_DetectStops(
   ST_GeometryFromText('LinestringM(0 0 0, 0 0 1, 0.1 0.1 2, 2 2 3)'),
   1,1) stop 
)
SELECT ST_M(ST_StartPoint((stop).geom)), 
       ST_NPoints((stop).geom) FROM temp INTO t0, n0;	
IF t0 = 0 AND n0 = 3
   THEN RAISE INFO 'PASSED - Stop at the beginning of the trajectory';
   ELSE RAISE INFO 'FAILED - Stop at the beginning of the trajectory';
END IF;
END; $BODY$;

Basically, each test is yet another PL/pgSQL function that doesn’t return anything (i.e. returns void) but outputs messages about the status of the test. Here I made heavy use of the PERFORM statement which executes the provided function but discards the results:


Update: The source code for this function is now available on https://github.com/anitagraser/postgis-spatiotemporal

Movement data in GIS #14: updates from GI_Forum 2018

Last week, I traveled to Salzburg to attend the 30th AGIT conference and co-located English-speaking GI_Forum. Like in previous year, there were a lot of mobility and transportation research related presentations. Here are my personal highlights:

This year’s keynotes touched on a wide range of issues, from Sandeep Singhal (Google Cloud Storage) who – when I asked about the big table queries he showed – stated that they are not using a spatial index but are rather brute-forcing their way through massive data sets, to Laxmi Ramasubramanian @nycplanner (Hunter College City University of New York) who cautioned against tech arrogance and tendency to ignore expertise from other fields such as urban planning:

One issue that Laxmi particularly highlighted was the fact that many local communities are fighting excessive traffic caused by apps like Waze that suggest shortcuts through residential neighborhoods. Just because we can do something with (mobility) data, doesn’t necessarily mean that we should!

Not limited to mobility but very focused on open source, Jochen Albrecht (Hunter College City University of New York) invited the audience to join his quest for a spatial decision support system based on FOSS only at bit.ly/FiltersAndWeights and https://github.com/geojochen/fosssdss

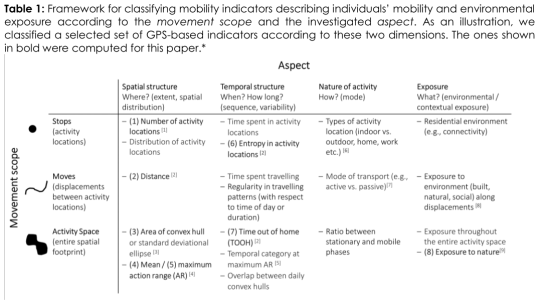
The session Spatial Perspectives on Healthy Mobility featured multiple interesting contributions, particularly by Michelle P. Fillekes who presented a framework of mobility indicators to assess daily mobility of study participants. It considers both spatial and temporal aspects of movement, as well as the movement context:

Figure from Michelle Pasquale Fillekes, Eleftheria Giannouli, Wiebren Zijlstra, Robert Weibel. Towards a Framework for Assessing Daily Mobility using GPS Data. DOI: 10.1553/giscience2018_01_s177 (under cc-by-nd)

It was also good to see that topics we’ve been working on in the past (popularity routing in this case) continue to be relevant and have been picked up in the German-speaking part of the conference:

Of course, I also presented some new work of my own, specifically my research into PostGIS trajectory datatypes which I’ve partially covered in a previous post on this blog and which is now published in Graser, A. (2018) Evaluating Spatio-temporal Data Models for Trajectories in PostGIS Databases. GI_Forum ‒ Journal of Geographic Information Science, 1-2018, 16-33. DOI: 10.1553/giscience2018_01_s16.

My introduction to GeoMesa talk failed to turn up any fellow Austrian GeoMesa users. So I’ll keep on looking and spreading the word. The most common question – and certainly no easy one at that – is how to determine the point where it becomes worth it to advance from regular databases to big data systems. It’s not just about the size of the data but also about how it is intended to be used. And of course, if you are one of those db admin whizzes who manages a distributed PostGIS setup in their sleep, you might be able to push the boundaries pretty far. On the other hand, if you already have some experience with the Hadoop ecosystem, getting started with tools like GeoMesa shouldn’t be too huge a step either. But that’s a topic for another day!

Since AGIT&GI_Forum are quite a big event with over 1,000 participants, it was not limited to movement data topics. You can find the first installment of English papers in GI_Forum 2018, Volume 1. As I understand it, there will be a second volume with more papers later this year.


This post is part of a series. Read more about movement data in GIS.

Movement data in GIS #13: Timestamp labels for trajectories

In Movement data in GIS #2: visualization I mentioned that it should be possible to label trajectory segments without having to break the original trajectory feature. While it’s not a straightforward process, it is indeed possible to create timestamp labels at desired intervals:

The main point here is that we cannot use regular labels because there would be only one label for the whole trajectory feature. Instead, we are using a marker line with a font marker:

By default, font markers only display one character from a given font but by using expressions we can make it display longer text, including datetime strings:

If you want to have a label at every node of the trajectory, the expression looks like this:

format_date( 
   to_datetime('1970-01-01T00:00:00Z')+to_interval(
      m(start_point(geometry_n(
         segments_to_lines( $geometry ),
         @geometry_part_num)
      ))||' seconds'
   ),
   'HH:mm:ss'
)

You probably remember those parts of the expression that extract the m value from previous posts. Note that – compared to 2016 – it is now necessary to add the segments_to_lines() function.

The m value (which stores time as seconds since Unix epoch) is then converted to datetime and finally formatted to only show time. Of course you can edit the datetime format string to also include the date.

If we only want a label every 30 seconds, we can add a case statement around that:

CASE WHEN 
m(start_point(geometry_n(
   segments_to_lines( $geometry ),
   @geometry_part_num)
)) % 30 = 0
THEN
format_date( 
   to_datetime('1970-01-01T00:00:00Z')+to_interval(
      m(start_point(geometry_n(
         segments_to_lines( $geometry ),
         @geometry_part_num)
      ))||' seconds'
   ),
   'HH:mm:ss'
)
END

This works well if the trajectory sampling interval is fairly regular. This is not always the case and that means that the above case statement wouldn’t find many nodes with a timestamp that ends in :30 or :00. In such a case, we could resort to labeling nodes based on their order in the linestring:

CASE WHEN 
 @geometry_part_num  % 30 = 0
THEN
...

Thanks a lot to @JuergenEFischer for providing a solution for converting seconds since Unix epoch to datetime without a custom function!

Note that expressions using @geometry_part_num currently suffer from the following issue: Combination of segments_to_lines($geometry) and @geometry_part_num gives wrong segment numbers


This post is part of a series. Read more about movement data in GIS.

Movement data in GIS #12: why you should be using PostGIS trajectories

In short: both writing trajectory queries as well as executing them is considerably faster using PostGIS trajectories (as LinestringM) rather than the commonly used point-based approach.

Here are a couple of examples to give you an impression of the differences.

Spoiler alert! Trajectory queries are up to 500 times faster than comparable point-based queries.

A quick look at indexing

In both cases, we have indexed the tracker id, geometry, and time columns to speed up query processing.

The trajectory table has 3 indexes

  • gist (time_range)
  • gist (track gist_geometry_ops_nd)
  • btree (tracker)

The point-based table has 4 indexes

  • gist (pt)
  • btree (trajectory_id)
  • btree (tracker)
  • btree (t)

Length

First, let’s see how to determine trajectory length for all observed moving objects (identified by a tracker id).

Using the point-based approach, we first need to ensure that the points are in the correct temporal order, create the lines, and finally sum up their length:

WITH ordered AS (
 SELECT trajectory_id, tracker, t, pt
 FROM geolife.trajectory_pt
 ORDER BY t
), tmp AS (
 SELECT trajectory_id, tracker, st_makeline(pt) traj
 FROM ordered 
 GROUP BY trajectory_id, tracker
)
SELECT tracker, round(sum(ST_Length(traj::geography)))
FROM tmp
GROUP BY tracker 
ORDER BY tracker

With trajectories, we can go right to computing lengths:

SELECT tracker, round(sum(ST_Length(track::geography)))
FROM geolife.trajectory_ext
GROUP BY tracker
ORDER BY tracker

On my test system, the trajectory query run time is 22.7 sec instead of 43.0 sec for the point-based approach:

Duration

Compared to trajectory length, duration is less complicated in the point-based approach:

WITH tmp AS (
 SELECT trajectory_id, tracker, min(t) start_time, max(t) end_time
 FROM geolife.trajectory_pt
 GROUP BY trajectory_id, tracker
)
SELECT tracker, sum(end_time - start_time)
FROM tmp
GROUP BY tracker
ORDER BY tracker

Still, the trajectory query is less complex and much faster at 31 ms instead of 6.0 sec:

SELECT tracker, sum(upper(time_range) - lower(time_range))
FROM geolife.trajectory_ext
GROUP BY tracker
ORDER BY tracker

Temporal filter

Extracting trajectories that occurred during a certain time frame is another common use case:

WITH tmp AS (
 SELECT trajectory_id, tracker, min(t) start_time, max(t) end_time
 FROM geolife.trajectory_pt
 GROUP BY trajectory_id, tracker
)
SELECT trajectory_id, tracker, start_time, end_time
FROM tmp
WHERE end_time > '2008-11-26 11:00'
AND start_time < '2008-11-26 15:00'
ORDER BY tracker

This point-based query takes 6.0 sec while the shorter trajectory query finishes in 12 ms:

SELECT id, tracker, time_range
FROM geolife.trajectory_ext
WHERE time_range && '[2008-11-26 11:00+1,2008-11-26 15:00+01]'::tstzrange

or equally fast (12 ms) by making use of the n-dimensional index:

WHERE track &&&	ST_Collect(
 ST_MakePointM(-180, -90, extract(epoch from '2008-11-26 11:00'::timestamptz)),
 ST_MakePointM(180, 90, extract(epoch from '2008-11-26 15:00'::timestamptz))
)

Spatial filter

Finally, of course, let’s have a look at spatial filters, for example, trajectories that start in a certain area:

WITH my AS ( 
 SELECT ST_Buffer(ST_SetSRID(ST_MakePoint(116.31894,39.97472),4326),0.0005) areaA
), tmp AS (
 SELECT trajectory_id, tracker, min(t) t 
 FROM geolife.trajectory_pt
 GROUP BY trajectory_id, tracker
)
SELECT distinct traj.tracker, traj.trajectory_id 
FROM tmp
JOIN geolife.trajectory_pt traj
ON tmp.trajectory_id = traj.trajectory_id AND traj.t = tmp.t
JOIN my
ON ST_Within(traj.pt, my.areaA)

This point-based query takes 6.0 sec while the shorter trajectory query finishes in 488 ms:

WITH my AS ( 
 SELECT ST_Buffer(ST_SetSRID(ST_MakePoint(116.31894, 39.97472),4326),0.0005) areaA
)
SELECT id, tracker, ST_AsText(track)
FROM geolife.trajectory_ext
JOIN my
ON areaA && track
AND ST_Within(ST_StartPoint(track), areaA)

For more generic “does this trajectory intersect another geometry”, the points can also be aggregated to a linestring on the fly but that takes 21.9 sec:

I’ll be presenting more work on PostGIS trajectories at GI_Forum in Salzburg in July. In the talk, I’ll also have a look at the custom PG-Trajectory datatype. Here’s the full open-access paper:

Graser, A. (2018) Evaluating Spatio-temporal Data Models for Trajectories in PostGIS Databases. GI_Forum ‒ Journal of Geographic Information Science, 1-2018, 16-33. DOI: 10.1553/giscience2018_01_s16.

You can find my fork of the PG-Trajectory project – including all necessary fixes – on Bitbucket.


This post is part of a series. Read more about movement data in GIS.

Back to Top

Sustaining Members