Small multiples for OD flow maps using virtual layers
In my previous posts, I discussed classic flow maps that use arrows of different width to encode flows between regions. This post presents an alternative take on visualizing flows, without any arrows. This style is inspired by Go with the Flow by Robert Radburn and Visualisation of origins, destinations and flows with OD maps by J. Wood et al.
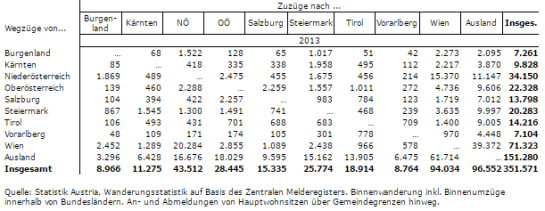
The starting point of this visualization is a classic OD matrix.
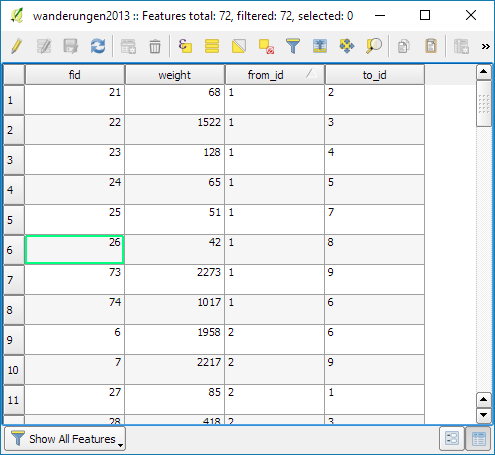
For my previous flow maps, I already converted this data into a more GIS-friendly format: a Geopackage with lines and information about the origin, destination and strength of the flow:
In addition, I grabbed state polygons from Natural Earth Data.
At this point, we have 72 flow features and 9 state polygon features. An ordinary join in the layer properties won’t do the trick. We’d still be stuck with only 9 polygons.
Virtual layers to the rescue!
The QGIS virtual layers feature (Layer menu | Add Layer | Add/Edit Virtual Layer) provides database capabilities without us having to actually set up a database … *win!*
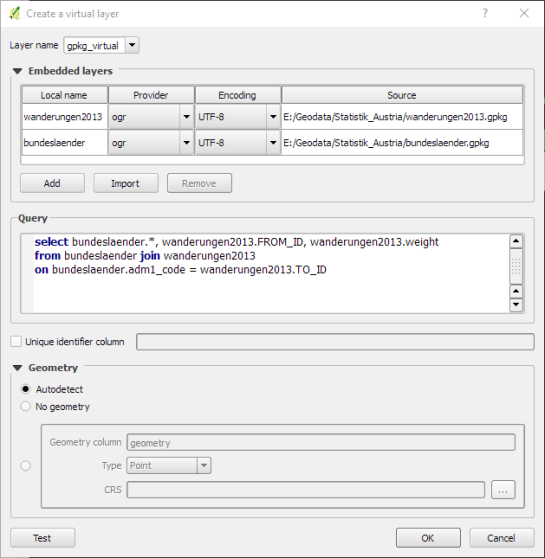
Using a classic SQL query, we can join state polygons and migration flows into a new virtual layer:
The resulting virtual layer contains 72 polygon features. There are 8 copies of each state.
Now that the data is ready, we can start designing the visualization in the Print Composer.
This is probably the most manual step in this whole process: We need 9 map items, one for each mini map in the small multiples visualization. Create one and configure it to your liking, then copy and paste to create 8 more copies.
I’ve decided to arrange the map items in a way that resembles the actual geographic location of the state that is represented by the respective map, from the state of Vorarlberg (a proud QGIS sponsor by the way) in the south-west to Lower Austria in the north-east.
To configure which map item will represent the flows from which origin state, we set the map item ID to the corresponding state ID. As you can see, the map items are numbered from 1 to 9:

Once all map items are set up, we can use the map item IDs to filter the features in each map. This can be implemented using a rule based renderer:
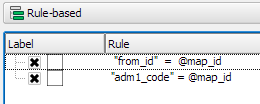
The first rule will ensure that the each map only shows flows originating from a specific state and the second rule will select the state itself.
We configure the symbol of the first rule to visualize the flow strength. The color represents the number number of people moving to the respective district. I’ve decided to use a smooth gradient instead of predefined classes for the polygon fill colors. The following expression maps the feature’s weight value to a shade on the Viridis color ramp:
ramp_color( 'Viridis',
  scale_linear("weight",0,2000,0,1)
)
You can use any color ramp you like. If you want to use the Viridis color ramp, save the following code into an .xml file and import it using the Style Manager. (This color ramp has been provided by Richard Styron on rocksandwater.net.)
<!DOCTYPE qgis_style>
<qgis_style version="0">
  <symbols/>
    <colorramp type="gradient" name="Viridis">
      <prop k="color1" v="68,1,84,255"/>
      <prop k="color2" v="253,231,36,255"/>
      <prop k="stops" v="0.04;71,15,98,255:0.08;72,29,111,255:0.12;71,42,121,255:0.16;69,54,129,255:0.20;65,66,134,255:0.23;60,77,138,255:0.27;55,88,140,255:0.31;50,98,141,255:0.35;46,108,142,255:0.39;42,118,142,255:0.43;38,127,142,255:0.47;35,137,141,255:0.51;31,146,140,255:0.55;30,155,137,255:0.59;32,165,133,255:0.62;40,174,127,255:0.66;53,183,120,255:0.70;69,191,111,255:0.74;89,199,100,255:0.78;112,206,86,255:0.82;136,213,71,255:0.86;162,218,55,255:0.90;189,222,38,255:0.94;215,226,25,255:0.98;241,229,28,255"/>
    </colorramp>
  </colorramps>
</qgis_style>
If we go back to the Print Composer and update the map item previews, we see it all come together:

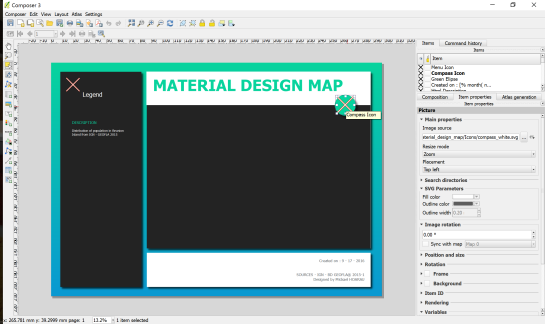
Finally, we set title, legend, explanatory texts, and background color:
I think it is amazing that we are able to design a visualization like this without having to create any intermediate files or having to write custom code. Whenever a value is edited in the original migration dataset, the change is immediately reflected in the small multiples.


