Movement data in GIS #29: power your web apps with movement data using mobilitydb-sqlalchemy
This is a guest post by Bommakanti Krishna Chaitanya @chaitan94
Introduction
This post introduces mobilitydb-sqlalchemy, a tool I’m developing to make it easier for developers to use movement data in web applications. Many web developers use Object Relational Mappers such as SQLAlchemy to read/write Python objects from/to a database.
Mobilitydb-sqlalchemy integrates the moving objects database MobilityDB into SQLAlchemy and Flask. This is an important step towards dealing with trajectory data using appropriate spatiotemporal data structures rather than plain spatial points or polylines.
To make it even better, mobilitydb-sqlalchemy also supports MovingPandas. This makes it possible to write MovingPandas trajectory objects directly to MobilityDB.
For this post, I have made a demo application which you can find live at https://mobilitydb-sqlalchemy-demo.adonmo.com/. The code for this demo app is open source and available on GitHub. Feel free to explore both the demo app and code!
In the following sections, I will explain the most important parts of this demo app, to show how to use mobilitydb-sqlalchemy in your own webapp. If you want to reproduce this demo, you can clone the demo repository and do a “docker-compose up –build” as it automatically sets up this docker image for you along with running the backend and frontend. Just follow the instructions in README.md for more details.
Declaring your models
For the demo, we used a very simple table – with just two columns – an id and a tgeompoint column for the trip data. Using mobilitydb-sqlalchemy this is as simple as defining any regular table:
from flask_sqlalchemy import SQLAlchemy
from mobilitydb_sqlalchemy import TGeomPoint

db = SQLAlchemy()

class Trips(db.Model):
   __tablename__ = "trips"
   trip_id = db.Column(db.Integer, primary_key=True)
   trip = db.Column(TGeomPoint)
Note: The library also allows you to use the Trajectory class from MovingPandas as well. More about this is explained later in this tutorial.
Populating data
When adding data to the table, mobilitydb-sqlalchemy expects data in the tgeompoint column to be a time indexed pandas dataframe, with two columns – one for the spatial data called “geometry” with Shapely Point objects and one for the temporal data “t” as regular python datetime objects.
from datetime import datetime
from shapely.geometry import Point

# Prepare and insert the data
# Typically it won’t be hardcoded like this, but it might be coming from
# other data sources like a different database or maybe csv files
df = pd.DataFrame(
   [
       {"geometry": Point(0, 0), "t": datetime(2012, 1, 1, 8, 0, 0),},
       {"geometry": Point(2, 0), "t": datetime(2012, 1, 1, 8, 10, 0),},
       {"geometry": Point(2, -1.9), "t": datetime(2012, 1, 1, 8, 15, 0),},
   ]
).set_index("t")

trip = Trips(trip_id=1, trip=df)
db.session.add(trip)
db.session.commit()
Writing queries
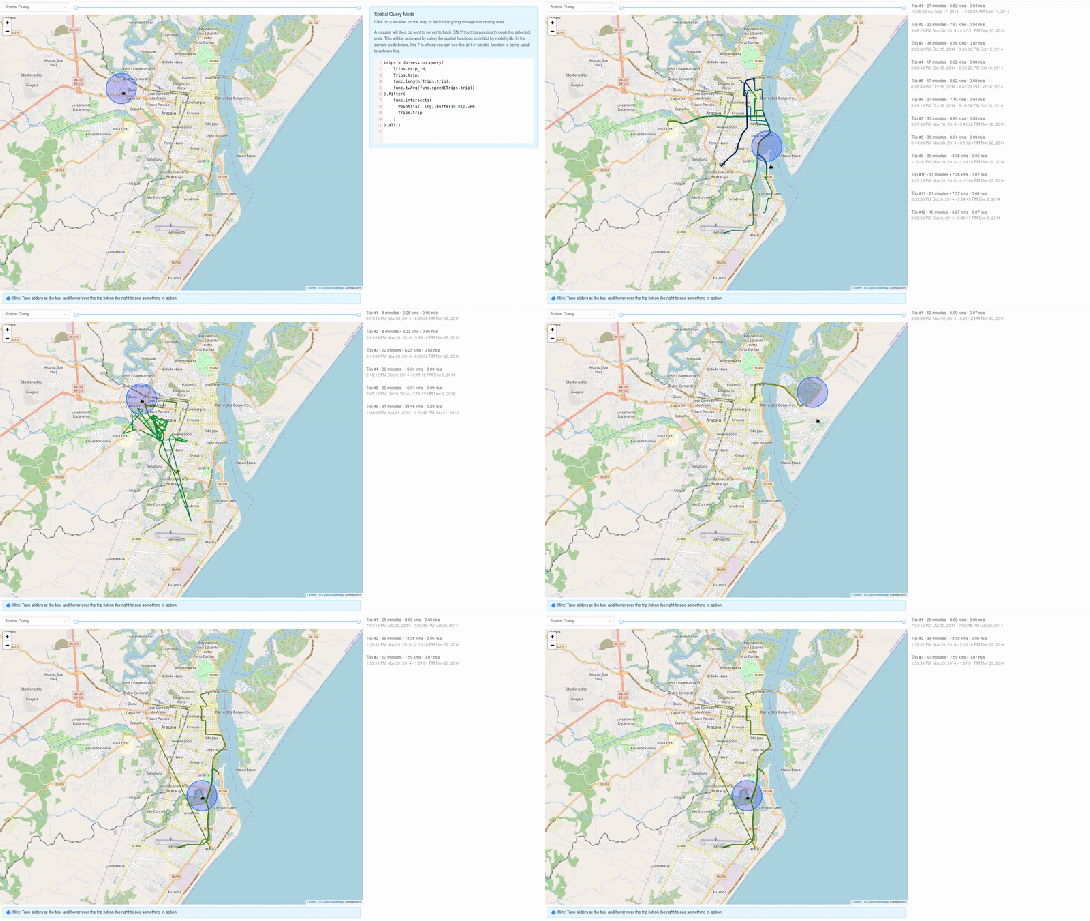
In the demo, you see two modes. Both modes were designed specifically to explain how functions defined within MobilityDB can be leveraged by our webapp.
1. All trips mode – In this mode, we extract all trip data, along with distance travelled within each trip, and the average speed in that trip, both computed by MobilityDB itself using the ‘length’, ‘speed’ and ‘twAvg’ functions. This example also shows that MobilityDB functions can be chained to form more complicated queries.

trips = db.session.query(
   Trips.trip_id,
   Trips.trip,
   func.length(Trips.trip),
   func.twAvg(func.speed(Trips.trip))
).all()
2. Spatial query mode – In this mode, we extract only selective trip data, filtered by a user-selected region of interest. We then make a query to MobilityDB to extract only the trips which pass through the specified region. We use MobilityDB’s ‘intersects’ function to achieve this filtering at the database level itself.
trips = db.session.query(
   Trips.trip_id,
   Trips.trip,
   func.length(Trips.trip),
   func.twAvg(func.speed(Trips.trip))
).filter(
   func.intersects(Point(lat, lng).buffer(0.01).wkb, Trips.trip),
).all()
Using MovingPandas Trajectory objects
Mobilitydb-sqlalchemy also provides first-class support for MovingPandas Trajectory objects, which can be installed as an optional dependency of this library. Using this Trajectory class instead of plain DataFrames allows us to make use of much richer functionality over trajectory data like analysis speed, interpolation, splitting and simplification of trajectory points, calculating bounding boxes, etc. To make use of this feature, you have set the use_movingpandas flag to True while declaring your model, as shown in the below code snippet.
class TripsWithMovingPandas(db.Model):
   __tablename__ = "trips"
   trip_id = db.Column(db.Integer, primary_key=True)
   trip = db.Column(TGeomPoint(use_movingpandas=True))
Now when you query over this table, you automatically get the data parsed into Trajectory objects without having to do anything else. This also works during insertion of data – you can directly assign your movingpandas Trajectory objects to the trip column. In the below code snippet we show how inserting and querying works with movingpandas mode.
from datetime import datetime
from shapely.geometry import Point

# Prepare and insert the data
# Typically it won’t be hardcoded like this, but it might be coming from
# other data sources like a different database or maybe csv files
df = pd.DataFrame(
   [
       {"geometry": Point(0, 0), "t": datetime(2012, 1, 1, 8, 0, 0),},
       {"geometry": Point(2, 0), "t": datetime(2012, 1, 1, 8, 10, 0),},
       {"geometry": Point(2, -1.9), "t": datetime(2012, 1, 1, 8, 15, 0),},
   ]
).set_index("t")

geo_df = GeoDataFrame(df)
traj = mpd.Trajectory(geo_df, 1)

trip = Trips(trip_id=1, trip=traj)
db.session.add(trip)
db.session.commit()

# Querying over this table would automatically map the resulting tgeompoint
# column to movingpandas’ Trajectory class
result = db.session.query(TripsWithMovingPandas).filter(
   TripsWithMovingPandas.trip_id == 1
).first()

print(result.trip.__class__)
# <class 'movingpandas.trajectory.Trajectory'>
Bonus: trajectory data serialization
Along with mobilitydb-sqlalchemy, recently I have also released trajectory data serialization/compression libraries based on Google’s Encoded Polyline Format Algorithm, for python and javascript called trajectory and trajectory.js respectively. These libraries let you send trajectory data in a compressed format, resulting in smaller payloads if sending your data through human-readable serialization formats like JSON. In some of the internal APIs we use at Adonmo, we have seen this reduce our response sizes by more than half (>50%) sometimes upto 90%.
Want to learn more about mobilitydb-sqlalchemy? Check out the quick start & documentation.
This post is part of a series. Read more about movement data in GIS.


