Related Plugins and Tags

QGIS Planet

QGIS CAD Tools Manual

CAD Tools is a powerful plugin for QGIS that is intended to improve your digitizing workflow. While it has a lot to offer, the tools are not very self-explanatory – especially for people who are not used to the CAD way of doing things.

Luckily, there is a great learning resource out there. Stefan Ziegler explains the tools and shows their use in a series of screen casts that are easy to follow and reproduce. Enjoy!


Time Manager 0.3 Released

We are pleased to announce the release of Time Manager version 0.3. New features include:

  • Saving – Time Manager settings are now being saved to the project file.
  • Image series export – animations can be exported as image series.
  • Help files – The plugin now comes with a user guide / help file.
  • Looping animations – When “looping” is enabled, the animation will start over from the beginning instead of stopping when it reaches the end.

Time Manager user guide

Time Manager is available through Geofrogger Repository. Give it a try!


Table Joins – A New Feature in QGIS 1.7

Table joins have been on our wish list for quite a while. After all, it is much nicer to add a join than to go through the process of creating a new shapefile with joined attribute table using “Join by Attributes”.

The time has come!

Users of QGIS trunk may have already noticed the new “Joins” tab in Layer Properties:

"Joins" tab and "Add vector join" dialog in QGIS 1.7

The join results in an extended attribute table. If there is no matching row in the joined table, the attributes will be set to NULL.


Drive Time Isochrones – An Example Using Finnish Airports

Site analyses can benefit greatly from using “drive-time” isochrones to define the study area. Drive time isochrones are often significantly different from simple buffer areas which disregard natural barriers such as rivers or slow roads.

Of course, creating drive time isochrones requires more input data and more compute-intensive algorithms than a simple buffer analysis. It is necessary to create a routable network graph with adequate weights to be used by the routing algorithm.

One of the most popular routing  applications in the open source world is pgRouting for PostGIS enabled databases. I’ve already shown how to create drive time isochrones for one network node based on pgRouting and QGIS.  Today, I’ll show how to create drive time isochrones for a set of points – in this case all airports in Finland.

The first step is to find the closest network node to every airport:

ALTER TABLE airport
   ADD COLUMN nearest_node integer;

CREATE TABLE temp AS
   SELECT a.gid, b.id, min(a.dist)
   FROM
     (SELECT airport.gid,
             min(distance(airport.the_geom, node.the_geom)) AS dist
      FROM airport, node
      GROUP BY airport.gid) AS a,
     (SELECT airport.gid, node.id,
             distance(airport.the_geom, node.the_geom) AS dist
      FROM airport, node) AS b
   WHERE a.dist = b. dist
         AND a.gid = b.gid
   GROUP BY a.gid, b.id;

UPDATE airport
SET nearest_node =
   (SELECT id
    FROM temp
    WHERE temp.gid = airport.gid);

Then, we can calculate drive times between network nodes and “airport nodes”. I am still looking for the most efficient way to perform this calculation. The trivial solution I used for this example was to calculate all drive time values separately for each airport node (as described in “Creating Catchment Areas with pgRouting and QGIS”). Afterwards, I combined the values to find the minimum drive time for each network node:

CREATE table catchment_airport_final AS
SELECT id, the_geom, min (cost) AS cost
FROM catchment_airport
GROUP By id, the_geom;

The resulting point layer was imported into QGIS. Using TIN interpolation (from Interpolation plugin), you can calculate a continuous cost surface. And Contour function (from GDALTools) finally yields drive time isochrones.

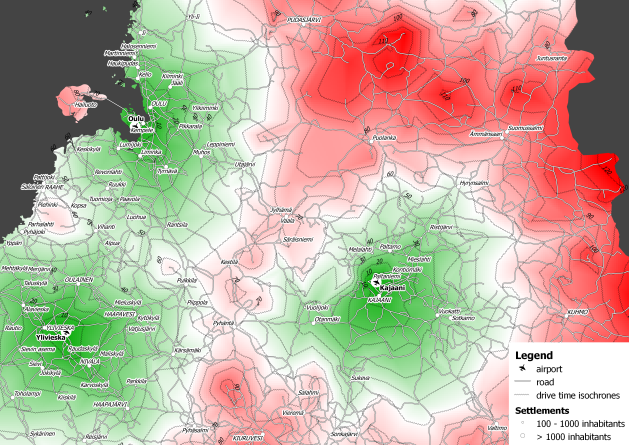
Drive time isochrones around airports in northern Finland

Based on this analysis, it is possible to determine how many inhabitants live within one hour driving distance from an airport or how many people have to drive longer than e.g. ninety minutes to reach any airport.


Creating Catchment Areas with pgRouting and QGIS

Based on the network created in my last post, I’ll now describe how to calculate the catchment area of a network node.

We need both network and node table. The cost attribute in my network table is called traveltime. (I used different speed values based on road category to calculate traveltime for road segments.) The result will be a new table containing all nodes and an additional cost attribute. And this is the query that calculates the catchment area around node #5657:

create table catchment_5657 as
select
    id,
    the_geom,
    (select sum(cost) from (
	   SELECT * FROM shortest_path('
	   SELECT gid AS id,
		  start_id::int4 AS source,
		  end_id::int4 AS target,
		  traveltime::float8 AS cost
	   FROM network',
	   5657,
	   id,
	   false,
	   false)) as foo ) as cost
from node

Then, I loaded the point table into QGIS and calculated a TIN based on the cost attribute. With “Contour” from GdalTools, you can visualize equal-cost areas even better:

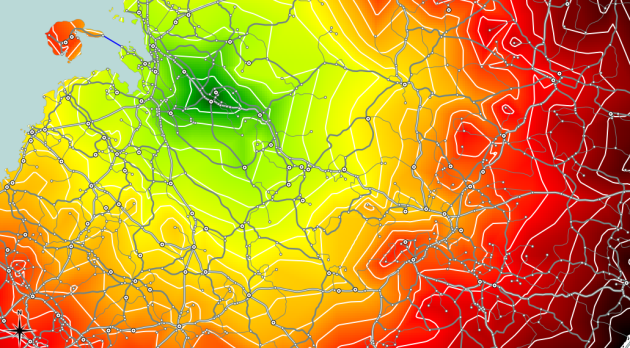
Catchment area around node #5657 with contour lines

Between contour lines, there is a difference of 10 minutes travel time.


A Beginner’s Guide to pgRouting

The aim of this post is to describe the steps necessary to calculate routes with pgRouting. In the end, we’ll visualize the results in QGIS.

This guide assumes that you have the following installed and running:

  • Postgres with PostGIS and pgAdmin
  • QGIS with PostGIS Manager and RT Sql Layer plugins

Installing pgRouting

pgRouting can be downloaded from www.pgrouting.org.

Building from source is covered by pgRouting documentation. If you’re using Windows, download the binaries and copy the .dlls into PostGIS’ lib folder, e.g. C:\Program Files (x86)\PostgreSQL\8.4\lib.

Start pgAdmin and create a new database based on your PostGIS template. (I called mine ‘routing_template’.) Open a Query dialog, load and execute the three .sql files located in your pgRouting download (routing_core.sql, routing_core_wrappers.sql, routing_topology.sql). Congratulations, you now have a pgRouting-enabled database.

Creating a routable road network

The following description is based on the free road network published by National Land Survey of Finland (NLS). All you get is one Shapefile containing line geometries, a road type attribute and further attributes unrelated to routing.

pgRouting requires each road entry to have a start and an end node id. We’ll create those now:

First step is to load roads.shp into PostGIS. This is easy using PostGIS Manager – Data – Load Data from Shapefile.

Next, we create start and end point geometries. I used a view:

CREATE OR REPLACE VIEW road_ext AS
   SELECT *, startpoint(the_geom), endpoint(the_geom)
   FROM road;

Now, we create a table containing all the unique network nodes (start and end points) and we’ll also give them an id:

CREATE TABLE node AS
   SELECT row_number() OVER (ORDER BY foo.p)::integer AS id,
          foo.p AS the_geom
   FROM (
      SELECT DISTINCT road_ext.startpoint AS p FROM road_ext
      UNION
      SELECT DISTINCT road_ext.endpoint AS p FROM road_ext
   ) foo
   GROUP BY foo.p;

Finally, we can combine our road_ext view and node table to create the routable network table:

CREATE TABLE network AS
   SELECT a.*, b.id as start_id, c.id as end_id
   FROM road_ext AS a
      JOIN node AS b ON a.startpoint = b.the_geom
      JOIN node AS c ON a.endpoint = c.the_geom

(This can take a while.)

I recommend adding a spatial index to the resulting table.

Calculating shortest routes

Let’s try pgRouting’s Shortest Path Dijkstra method. The following query returns the route from node #1 to node #5110:

SELECT * FROM shortest_path('
   SELECT gid AS id,
          start_id::int4 AS source,
          end_id::int4 AS target,
          shape_leng::float8 AS cost
   FROM network',
1,
5110,
false,
false)

Final step: Visualization

With RT Sql Layer plugin, we can visualize the results of a query. The results will be loaded as a new layer. The query has to contain both geometry and a unique id. Therefore, we’ll join the results of the previous query with the network table containing the necessary geometries.

SELECT *
   FROM network
   JOIN
   (SELECT * FROM shortest_path('
      SELECT gid AS id,
          start_id::int4 AS source,
          end_id::int4 AS target,
          shape_leng::float8 AS cost
      FROM network',
      1,
      5110,
      false,
      false)) AS route
   ON
   network.gid = route.edge_id

In my case, this is how the result looks like:
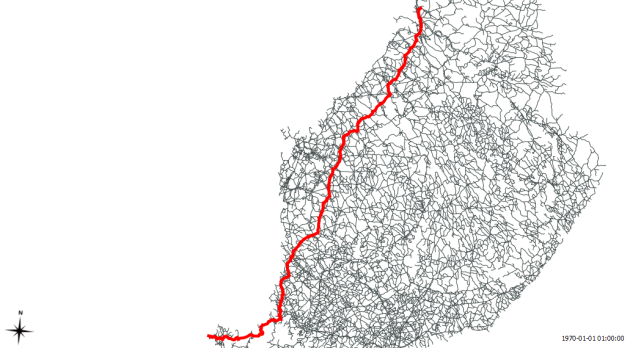
Route from node #1 to node #5110


Smaller Toolbar Icons for QGIS

Do you have a small resolution screen and want to use QGIS? Then you know the problem of toolbars using up precious screen estate.

In QGIS 1.7

You find the option to make icons smaller (16×16) or bigger (32×32) in the options dialog:

Options dialog with icon size option

If you are running a version of QGIS < 1.7

You can change the size of toolbar icons to any value you like – smaller or bigger than by default. And this is how it’s done (in Python console):

from PyQt4.QtGui import QToolBar
from PyQt4.QtCore import QSize

toolbars = qgis.utils.iface.mainWindow().findChildren(QToolBar)
for toolbar in toolbars:
    toolbar.setIconSize(QSize(16,16))

All toolbar icons will be scaled down to 16×16 pixels.

Kudos to Webrian on forum.qgis.org for this tip and to Nathan for pointing out how to access all toolbars.


How to Add a Legend to Your PyQGIS Application

In his post “Layer list widget for PyQGIS applications”, German Carrillo describes how to add a legend to your own PyQGIS application. You get to download the source code for the legend widget to include into your project.


QGIS with WPS Plugin in Action

The following video by soerengebbert shows the latest developments in OS WPS applications: PyWPS (using wps-grass-bridge to integrate GRASS modules as WPS processes), GRASS 7, and QGIS using the qwps plugin by Horst Düster (all latest svn versions).


How to Sort a Shapefile by Attributes

If you ever need to sort the entries in a shapefile by one of its attributes, you might be happy to learn that somebody already did all the work for you and wrote a plugin for QGIS that can perform such sorting tasks: MMQGIS Sort plugin by Michael Minn

MMQGIS Sort plugin


A New QGIS & GRASS Case Study

QGIS and GRASS in Local Government Bushfire Hazard Mapping – A Case Study.


Calculating Shortest Path in QGIS Using RoadGraph Plugin

Today, Alexander Bruy announced a new QGIS plugin called RoadGraph. It is a C++ plugin that calculates the shortest path between two points on any polyline layer (e.g. Openstreetmap shapefiles).

More information can be found at GIS-Lab.

Binary files are available for Windows and Linux:

Read on: “Travelling through Brazil with Quantum GIS”


GIS on GitHub

To make it easier to contribute to QGIS, the team has created a clone of the Subversion repository on GitHub. Using GitHub makes it easy to submit enhancements and bug fixes for inclusion in the Subversion repository. Gary Sherman describes the process in his post “Contributing to QGIS Using Git”.

Another of Gary’s projects is available via GitHub too: GeoApt Spatial Data Browser. It’s a data browser written in Python using QGIS bindings. It allows navigating a tree structure and previewing raster and vector datasets and associated metadata. Another nice feature: It supports drag & drop to e.g. QGIS! The project homepage can be found at: geoapt.com.


QGIS Commit History Visualization

Nathan has created an amazing video about 8 years of QGIS development using Gource. Each cluster of files is a directory and the branches show the folder hierarchy:


To find out how he did it, read “Generating a Gource source commit history visualization for QGIS (Quantum GIS)”


Back to Top

Sustaining Members