Analyzing regional income differences
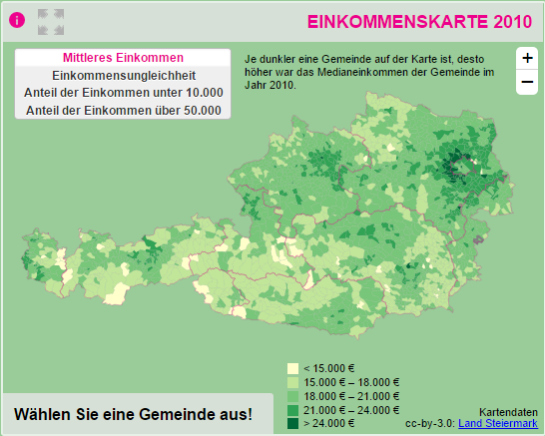
On my quest to create test data for spatial statistics, I’ve discovered income data for Austria per municipality on a news paper website:
For further analysis, I decided to limit the area to Vienna and Lower Austria. Since the income data included GKZ “Gemeindekennzahl” IDs, it was possible to join them to municipalities extracted from OpenStreetMap using QuickOSM for QGIS. GRASS v.clean was used to clean the vector topology to the point where PySAL was able to compute spatial weights.
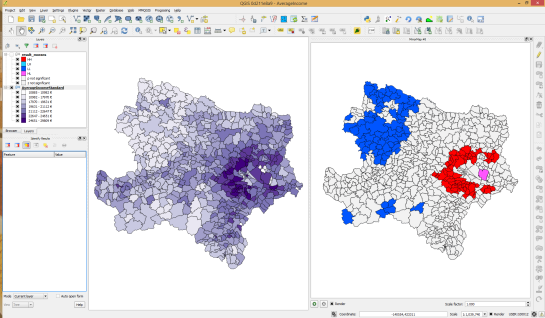
Using PySAL, I then computed income clusters: blue regions represent low clusters while red regions represent high clusters …

Municipality border data (c) OpenStreetMap and contributors
Income data source: Statistik Austria via derStandard
The results show a statistically significant cluster of low income in the north west, in the area called Waldviertel, as well as a cluster of high income containing many of the municipalities surrounding Vienna, an area often referred to as the “Speckgürtel” (“bacon belt”).


