Related Plugins and Tags

QGIS Planet

Infrastructure Coverage based on Open Data

This is something I have been wanting to do for a long time: map which areas of Vienna have fast access to a certain kind of infrastructure. Now, I finally found time and data to perform this analysis. Data used is OSM road data (Cloudmade shapefile) for Austria and metro station coordinates for Vienna by Max Kossatz and Robert Harm.

Before importing the OSM roads into PostGIS, I cut out my area of interest and created a clean topology using GRASS v.clean.break. Once loaded into the database, assign_vertex_id() function does the rest and the network is ready for routing and distance calculations.
For the metro stations, I calculated the nearest network node using George MacKerron’s Nearest Neighbor function.

Catchments were calculated using driving_distance() function. It returns distance to a given metro station for all network nodes (up to a maximum distance). The result can be interpolated to show e.g. which areas are at most 1 km away from any metro station.

1 km catchments around metro stations in Vienna

Close-up look at the 1 km catchment zone border

Once set up, performing this analysis is reasonably fast. Instead of metro stations, any other infrastructure coverage can be analyzed easily. I could imagine this being really useful when looking for a new flat: “Find me an area close to work, a metro station and a highschool.”

The next great thing would be to have all data for calculation of transit travel times too. Yes, I’m looking at you Wiener Linien!


Catchment Areas with pgRouting driving_distance()

In a previous post, I’ve described how to create catchment areas with pgRouting shortest_path() function. The solution described there calculates costs from the starting node (aka vertex) to all other nodes in the network. Depending on the network size, this can take a long time. Especially, if you are only interested in relatively small catchment areas (e.g. 50 km around a node in a network covering 10,000 km) there is a lot of unnecessary calculation going on. This is where you might want to use driving_distance() instead.

Driving_distance() offers a parameter for maximum distance/cost and will stop calculations when the costs exceed this limit. But let’s start at the beginning: installing the necessary functions.

Installation

If you have followed my guide to installing pgRouting, you already have some routing functions installed – but not driving_distance(). Weirdly, the necessary SQL scripts are not shipped with the .zip file available on pgRouting’s download page. You need:

routing_dd.sql
routing_dd_wrappers.sql

Both are available through the project repository at Github. Get them and execute them in your pgRouting-enabled database. Now, you should be ready.

Calculating driving distances

To calculate driving distances, we need a query very similar to shortest_path():

CREATE OR REPLACE FUNCTION driving_distance(
sql text,
source_id integer,
distance float8,
directed boolean,
has_reverse_cost boolean)
RETURNS SETOF path_result

The only new value is “distance”. That’s the maximum distance/cost you want to be contained in the result set. “distance” has to be specified in the same units as the cost attribute (which is specified in the “sql” text parameter).

Note: In my opinion, the name “(driving) distance” is misleading. While you can use distance as a cost attribute, you’re not limited to distances. You can use any cost attribute you like, e.g. travel time, fuel consumption, co2 emissions, …

The actual query for a catchment area of 100 km around node # 2000 looks like this:

SELECT * FROM driving_distance('
      SELECT gid AS id,
          start_id::int4 AS source,
          end_id::int4 AS target,
          shape_leng::float8 AS cost
      FROM network',
      2000,
      100000,
      false,
      false)

Interpreting the result

These are the first lines of the result set:

vertex_id;edge_id;cost
294;7262;97400.433506144
297;7236;98012.620979231
335;1095;96849.456306244
347;7263;93617.693852324
364;7098;93573.849081386
366;2551;92702.443434779
378;7263;91994.328368081

The cost attribute contains the total cost of travel from the starting node to the vertex_id node.
We will only be using vertex_id and cost. The use of edge_id is a mystery to me.

Visualizing the result

The easiest way to visualize driving_distance() results is using RT Sql Layer plugin. We need to join the results of driving_distance() with the table containing node geometries:

SELECT *
   FROM node
   JOIN
   (SELECT * FROM driving_distance('
      SELECT gid AS id,
          start_id::int4 AS source,
          end_id::int4 AS target,
          shape_leng::float8 AS cost
      FROM network',
      2000,
      100000,
      false,
      false)) AS route
   ON
   node.id = route.vertex_id

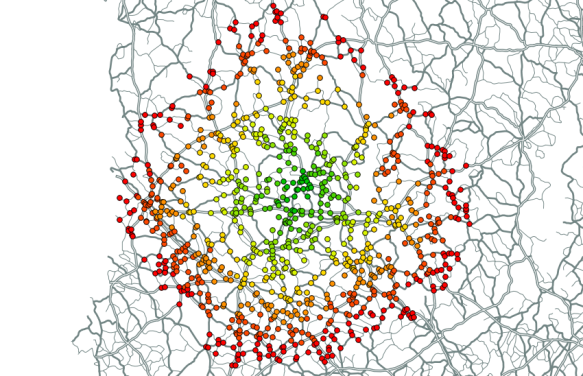
If you color the nodes based on the cost attribute, it will look something like this:

result of pgRouting driving_distance() visualized in QGIS


PostGIS ST_Collect vs. ST_Union

This post covers the topic of creating MULTI* geometries or GEOMETRYCOLLECTIONs in PostGIS using ST_Collect or ST_Union.

Often it doesn’t matter if you use ST_Collect or ST_Union. Both will return MULTI* geometries or – if different geometry types or multi geometries are mixed – GEOMETRYCOLLECTIONS.

Why you might want to use ST_Collect instead of ST_Union

ST_Collect is much faster than ST_Union [1]. That’s already a good argument. It’s faster because it does not dissolve boundaries or check for overlapping regions. It simply combines geometries into MULTI*s or GEOMETRYCOLLECTIONs.

This leads to reason two for why you might prefer ST_Collect: Dissolving boundaries and overlapping regions – like ST_Union does – can lead to undesired effects. For example, combining three LINESTRING geometries that partially overlap, results in a MULTILINESTRING consisting of more than three lines. The input lines are split where they overlap each other or themselves.

Analysis and visualization based on the resulting geometries might lead to incorrect conclusions if the user is not aware of the processes performed by the union command.

[1] http://postgis.refractions.net/documentation/manual-svn/ST_Collect.html


Selecting a Random Sample From PostgreSQL

Do you need a random sample of features in a Postgres table? Here is an example of how to select 1,000 random features from a table:

SELECT * FROM myTable
WHERE attribute = 'myValue'
ORDER BY random()
LIMIT 1000;

Drive Time Isochrones – An Example Using Finnish Airports

Site analyses can benefit greatly from using “drive-time” isochrones to define the study area. Drive time isochrones are often significantly different from simple buffer areas which disregard natural barriers such as rivers or slow roads.

Of course, creating drive time isochrones requires more input data and more compute-intensive algorithms than a simple buffer analysis. It is necessary to create a routable network graph with adequate weights to be used by the routing algorithm.

One of the most popular routing  applications in the open source world is pgRouting for PostGIS enabled databases. I’ve already shown how to create drive time isochrones for one network node based on pgRouting and QGIS.  Today, I’ll show how to create drive time isochrones for a set of points – in this case all airports in Finland.

The first step is to find the closest network node to every airport:

ALTER TABLE airport
   ADD COLUMN nearest_node integer;

CREATE TABLE temp AS
   SELECT a.gid, b.id, min(a.dist)
   FROM
     (SELECT airport.gid,
             min(distance(airport.the_geom, node.the_geom)) AS dist
      FROM airport, node
      GROUP BY airport.gid) AS a,
     (SELECT airport.gid, node.id,
             distance(airport.the_geom, node.the_geom) AS dist
      FROM airport, node) AS b
   WHERE a.dist = b. dist
         AND a.gid = b.gid
   GROUP BY a.gid, b.id;

UPDATE airport
SET nearest_node =
   (SELECT id
    FROM temp
    WHERE temp.gid = airport.gid);

Then, we can calculate drive times between network nodes and “airport nodes”. I am still looking for the most efficient way to perform this calculation. The trivial solution I used for this example was to calculate all drive time values separately for each airport node (as described in “Creating Catchment Areas with pgRouting and QGIS”). Afterwards, I combined the values to find the minimum drive time for each network node:

CREATE table catchment_airport_final AS
SELECT id, the_geom, min (cost) AS cost
FROM catchment_airport
GROUP By id, the_geom;

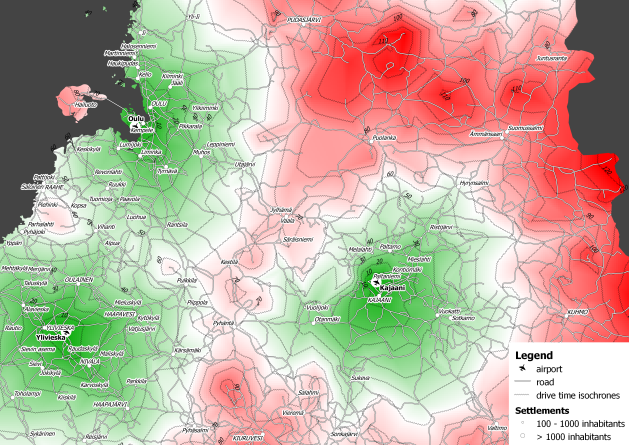
The resulting point layer was imported into QGIS. Using TIN interpolation (from Interpolation plugin), you can calculate a continuous cost surface. And Contour function (from GDALTools) finally yields drive time isochrones.

Drive time isochrones around airports in northern Finland

Based on this analysis, it is possible to determine how many inhabitants live within one hour driving distance from an airport or how many people have to drive longer than e.g. ninety minutes to reach any airport.


Creating Catchment Areas with pgRouting and QGIS

Based on the network created in my last post, I’ll now describe how to calculate the catchment area of a network node.

We need both network and node table. The cost attribute in my network table is called traveltime. (I used different speed values based on road category to calculate traveltime for road segments.) The result will be a new table containing all nodes and an additional cost attribute. And this is the query that calculates the catchment area around node #5657:

create table catchment_5657 as
select
    id,
    the_geom,
    (select sum(cost) from (
	   SELECT * FROM shortest_path('
	   SELECT gid AS id,
		  start_id::int4 AS source,
		  end_id::int4 AS target,
		  traveltime::float8 AS cost
	   FROM network',
	   5657,
	   id,
	   false,
	   false)) as foo ) as cost
from node

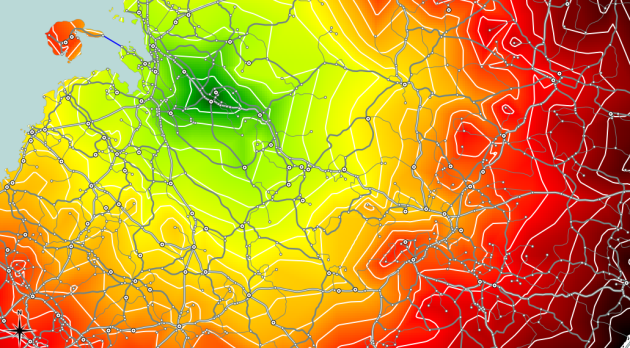
Then, I loaded the point table into QGIS and calculated a TIN based on the cost attribute. With “Contour” from GdalTools, you can visualize equal-cost areas even better:

Catchment area around node #5657 with contour lines

Between contour lines, there is a difference of 10 minutes travel time.


A Beginner’s Guide to pgRouting

The aim of this post is to describe the steps necessary to calculate routes with pgRouting. In the end, we’ll visualize the results in QGIS.

This guide assumes that you have the following installed and running:

  • Postgres with PostGIS and pgAdmin
  • QGIS with PostGIS Manager and RT Sql Layer plugins

Installing pgRouting

pgRouting can be downloaded from www.pgrouting.org.

Building from source is covered by pgRouting documentation. If you’re using Windows, download the binaries and copy the .dlls into PostGIS’ lib folder, e.g. C:\Program Files (x86)\PostgreSQL\8.4\lib.

Start pgAdmin and create a new database based on your PostGIS template. (I called mine ‘routing_template’.) Open a Query dialog, load and execute the three .sql files located in your pgRouting download (routing_core.sql, routing_core_wrappers.sql, routing_topology.sql). Congratulations, you now have a pgRouting-enabled database.

Creating a routable road network

The following description is based on the free road network published by National Land Survey of Finland (NLS). All you get is one Shapefile containing line geometries, a road type attribute and further attributes unrelated to routing.

pgRouting requires each road entry to have a start and an end node id. We’ll create those now:

First step is to load roads.shp into PostGIS. This is easy using PostGIS Manager – Data – Load Data from Shapefile.

Next, we create start and end point geometries. I used a view:

CREATE OR REPLACE VIEW road_ext AS
   SELECT *, startpoint(the_geom), endpoint(the_geom)
   FROM road;

Now, we create a table containing all the unique network nodes (start and end points) and we’ll also give them an id:

CREATE TABLE node AS
   SELECT row_number() OVER (ORDER BY foo.p)::integer AS id,
          foo.p AS the_geom
   FROM (
      SELECT DISTINCT road_ext.startpoint AS p FROM road_ext
      UNION
      SELECT DISTINCT road_ext.endpoint AS p FROM road_ext
   ) foo
   GROUP BY foo.p;

Finally, we can combine our road_ext view and node table to create the routable network table:

CREATE TABLE network AS
   SELECT a.*, b.id as start_id, c.id as end_id
   FROM road_ext AS a
      JOIN node AS b ON a.startpoint = b.the_geom
      JOIN node AS c ON a.endpoint = c.the_geom

(This can take a while.)

I recommend adding a spatial index to the resulting table.

Calculating shortest routes

Let’s try pgRouting’s Shortest Path Dijkstra method. The following query returns the route from node #1 to node #5110:

SELECT * FROM shortest_path('
   SELECT gid AS id,
          start_id::int4 AS source,
          end_id::int4 AS target,
          shape_leng::float8 AS cost
   FROM network',
1,
5110,
false,
false)

Final step: Visualization

With RT Sql Layer plugin, we can visualize the results of a query. The results will be loaded as a new layer. The query has to contain both geometry and a unique id. Therefore, we’ll join the results of the previous query with the network table containing the necessary geometries.

SELECT *
   FROM network
   JOIN
   (SELECT * FROM shortest_path('
      SELECT gid AS id,
          start_id::int4 AS source,
          end_id::int4 AS target,
          shape_leng::float8 AS cost
      FROM network',
      1,
      5110,
      false,
      false)) AS route
   ON
   network.gid = route.edge_id

In my case, this is how the result looks like:
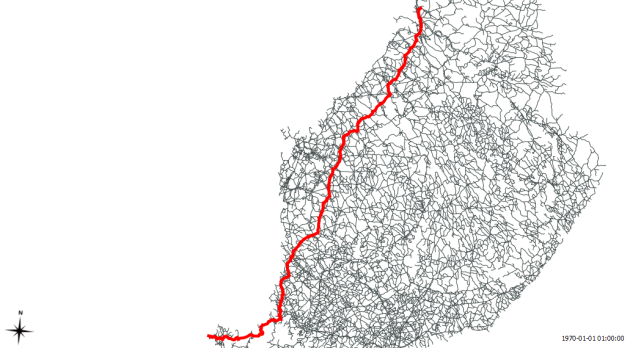
Route from node #1 to node #5110


Routing Multiple Vehicles with pgRouting DARP Function

pgRouting has become even more powerful: A DARP (Dial-a-Ride-Problem) solver is now available in the “darp branch” of the pgRouting repository.

The Dial-a-Ride Problem (DARP) solver tries to minimize transportation cost while satisfying customer service level constraints (time windows violation, waiting and travelling times) and fleet constraints (number of cars and capacity, as well as depot location).

Documentation can be found at www.pgrouting.org/docs.


PostGIS Tuning

Besides many other interesting topics, Opengeo’s PostGIS tutorial discusses “Tuning PostgreSQL for Spatial”.

The following values are recommended for production environments:

  • shared_buffers: 75 % of database memory (500 MB)
  • work_mem: 16 MB
  • maintenance_work_mem: 128 MB
  • wal_buffers: 1 MB
  • checkpoint_segments: 6
  • random_page_cost: 2.0
  • seq_page_cost: 1.0

All of these configuration parameters can edited in the database configuration file, C:\Documents and Settings\%USER\.opengeo\pgdata\%USER. This is a regular text file and can be edited using Notepad or any other text editor. An easier way of editing this configuration is by using the built-in “Backend Configuration Editor”. In pgAdmin, go to File > Open postgresql.conf…. It will ask for the location of the file, and navigate to C:\Documents and Settings\%USER\.opengeo\pgdata\%USER.

The changes will not take effect until the server is restarted.


Back to Top

Sustaining Members