Related Plugins and Tags

QGIS Planet

Software quality in QGIS

According to the definition of software quality given by french Wikipedia

An overall assessment of quality takes into account external factors, directly observable by the user, as well as internal factors, observable by engineers during code reviews or maintenance work.

I have chosen in this article to only talk about the latter. The quality of software and more precisely QGIS is therefore not limited to what is described here. There is still much to say about:

  • Taking user feedback into account,
  • the documentation writing process,
  • translation management,
  • interoperability through the implementation of standards,
  • the extensibility using API,
  • the reversibility and resilience of the open source model…

These are subjects that we care a lot and deserve their own article.

I will focus here on the following issue: QGIS is free software and allows anyone with the necessary skills to modify the software. But how can we ensure that the multiple proposals for modifications to the software contribute to its improvement and do not harm its future maintenance?

Self-discipline

All developers contributing to QGIS code doesn’t belong to the same organization. They don’t all live in the same country, don’t necessarily have the same culture and don’t necessarily share the same interests or ambitions for the software. However, they share the awareness of modifying a common good and the desire to take care of it.

This awareness transcends professional awareness, the developer not only has a responsibility towards his employer, but also towards the entire community of users and contributors to the software.

This self-discipline is the foundation of the quality of the contributions of software like QGIS.

However, to err is human and it is essential to carry out checks for each modification proposal.

Automatic checks

With each modification proposal (called Pull Request or Merge Request), the QGIS GitHub platform automatically launches a set of automatic checks.

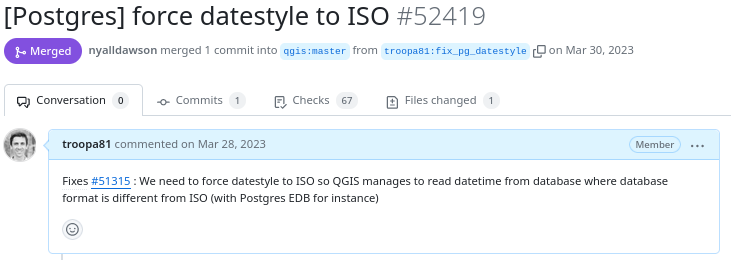
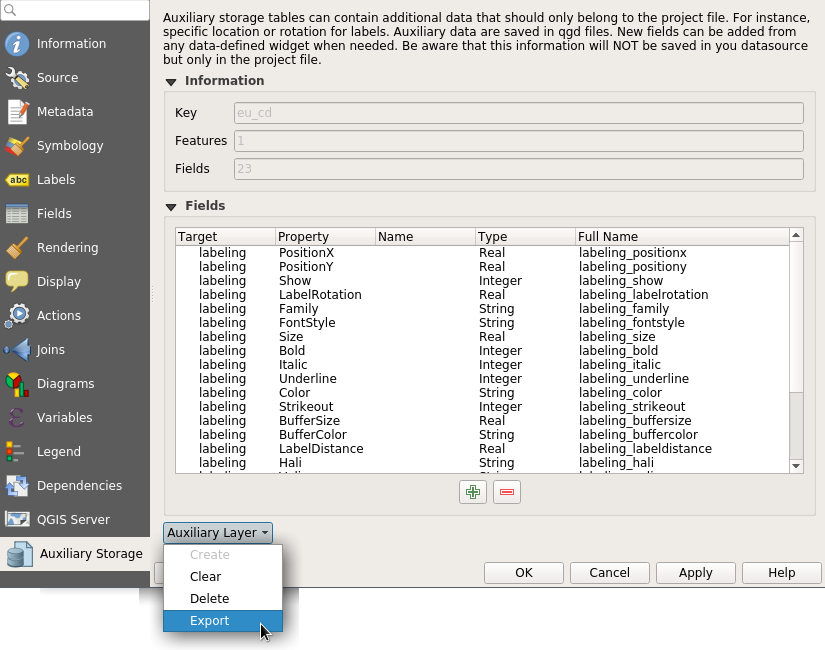
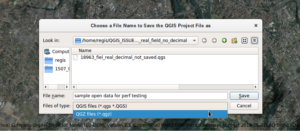
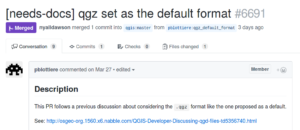
Example of proposed modification

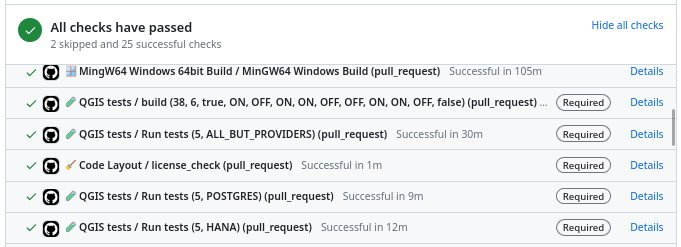
Result of automatic checks on a modification proposal

The first of these checks is to build QGIS on the different systems on which it is distributed (Linux, Windows, MacOS) by integrating the proposed modification. It is inconceivable to integrate a modification that would prevent the application from being built on one of these systems.

The tests

The first problem posed by a proposed modification is the following “How can we be sure that what is going to be introduced does not break what already exists?”

To validate this assertion, we rely on automatic tests. This is a set of micro-programs called tests, which only purpose is to validate that part of the application behaves as expected. For example, there is a test which validates that when the user adds an entry in a data layer, then this entry is then present in the data layer. If a modification were to break this behavior, then the test would fail and the proposal would be rejected (or more likely corrected).

This makes it possible in particular to avoid regressions (they are very often called non-regression tests) and also to qualify the expected behavior.

There are approximately 1.3 Million lines of code for the QGIS application and 420K lines of test code, a ratio of 1 to 3. The presence of tests is mandatory for adding functionality, therefore the quantity of test code increases with the quantity of application code.

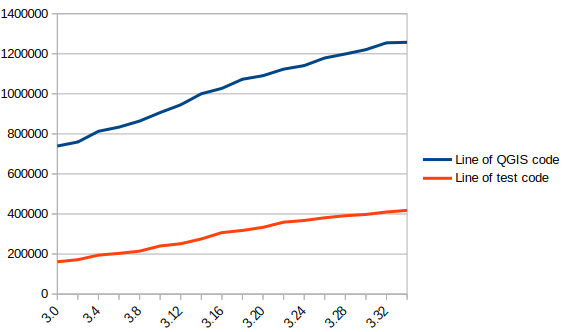
In blue the number of lines of code in QGIS, in red the number of lines of tests

There are currently over 900 groups of automatic tests in QGIS, most of which run in less than 2 seconds, for a total execution time of around 30 minutes.

We also see that certain parts of the QGIS code – the most recent – are better covered by the tests than other older ones. Developers are gradually working to improve this situation to reduce technical debt.

Code checks

Analogous to using a spell checker when writing a document, we carry out a set of quality checks on the source code. We check, for example, that the proposed modification does not contain misspelled words or “banned” words, that the API documentation has been correctly written or that the modified code respects certain formal rules of the programming language.

We recently had the opportunity to add a check based on the clang-tidy tool. The latter relies on the Clang compiler. It is capable of detecting programming errors by carrying out a static analysis of the code.

Clang-tidy is, for example, capable of detecting “narrowing conversions”.

Example of detecting “narrowing conversions”

In the example above, Clang-tidy detects that there has been a “narrowing conversion” and that the value of the port used in the network proxy configuration “may” be corrupted. In this case, this problem was reported on the QGIS issues platform and had to be corrected.

At that time, clang-tidy was not in place. Its use would have made it possible to avoid this anomaly and all the steps which led to its correction (exhaustive description of the issue, multiple exchanges to be able to reproduce it, investigation, correction, review of the modification), meaning a significant amount of human time which could thus have been avoided.

Peer review

A proposed modification that would validate all of the automatic checks described above would not necessarily be integrated into the QGIS code automatically. In fact, its code may be poorly designed or the modification poorly thought out. The relevance of the functionality may be doubtful, or duplicated with another. The integration of the modification would therefore potentially cause a burden for the people in charge of the corrective or evolutionary maintenance of the software.

It is therefore essential to include a human review in the process of accepting a modification.

This is more of a rereading of the substance of the proposal than of the form. For the latter, we favor the automatic checks described above in order to simplify the review process.

Therefore, human proofreading takes time, and this effort is growing with the quantity of modifications proposed in the QGIS code. The question of its funding arises, and discussions are in progress. The QGIS.org association notably dedicates a significant part of its budget to fund code reviews.

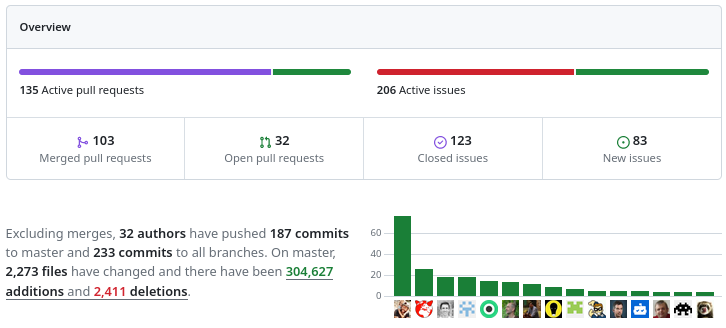
More than 100 modification proposals were reviewed and integrated during the month of December 2023. More than 30 different people contributed. More than 2000 files have been modified.

Therefore the wait for a proofreading can sometimes be long. It is also often the moment when disagreements are expressed. It is therefore a phase which can prove frustrating for contributors, but it is an important and rich moment in the community life of a free project.

To be continued !

As a core QGIS developer, and as a pure player OpenSource company, we believe it is fundamental to be involved in each step of the contribution process.

We are investing in the review process, improving automatic checks, and in the QGIS quality process in general. And we will continue to invest in these topics in order to help make QGIS a long-lasting and stable software.

If you would like to contribute or simply learn more about QGIS, do not hesitate to contact us at [email protected] and consult our QGIS support proposal.

QField 3.0 release : field mapping app, based on QGIS

We are very happy and enthusiasts at Oslandia to forward the QField 3.0 release announcement, the new major update of this mobile GIS application based on QGIS.

Oslandia is a strategic partner of OPENGIS.ch, the company at the heart of QField development, as well as the QFieldCloud associated SaaS offering. We join OPENGIS.ch to announce all the new features of QField 3.0.

Get QField 3.0 now !

QField 3.0 screenshots


Shipped with many new features and built with the latest generation of Qt’s cross-platform framework, this new chapter marks an important milestone for the most powerful open-source field GIS solution.

Main highlights

Upon launching this new version of QField, users will be greeted by a revamped recent projects list featuring shiny map canvas thumbnails. While this is one of the most obvious UI improvements, countless interface tweaks and harmonization have occurred. From the refreshed dark theme to the further polishing of countless widgets, QField has never looked and felt better.

The top search bar has a new functionality that allows users to look for features within the currently active vector layer by matching any of its attributes against a given search term. Users can also refine their searches by specifying a specific attribute. The new functionality can be triggered by typing the ‘f’ prefix in the search bar followed by a string or number to retrieve a list of matching features. When expanding it, a new list of functionalities appears to help users discover all of the tools available within the search bar.

QField’s tracking has also received some love. A new erroneous distance safeguard setting has been added, which, when enabled, will dictate the tracker not to add a new vertex if the distance between it and the previously added vertex is greater than a user-specified value. This aims at preventing “spikes” of poor position readings during a tracking session. QField is now also capable of resuming a tracking session after being stopped. When resuming, tracking will reuse the last feature used when first starting, allowing sessions interrupted by battery loss or momentary pause to be continued on a single line or polygon geometry.

On the feature form front, QField has gained support for feature form text widgets, a new read-only type introduced in QGIS 3.30, which allows users to create expression-based text labels within complex feature form configurations. In addition, relationship-related form widgets now allow for zooming to children/parent features within the form itself.

To enhance digitizing work in the field, QField now makes it possible to turn snapping on and off through a new snapping button on top of the map canvas when in digitizing mode. When a project has enabled advanced snapping, the dashboard’s legend item now showcases snapping badges, allowing users to toggle snapping for individual vector layers.

In addition, digitizing lines and polygons by using the volume up/down hardware keys on devices such as smartphones is now possible. This can come in handy when digitizing data in harsh conditions where gloves can make it harder to use a touch screen.

While we had to play favorites in describing some of the new functionalities in QField, we’ve barely touched the surface of this feature-packed release. Other major additions include support for Near-Field Communication (NFC) text tag reading and a new geometry editor’s eraser tool to delete part of lines and polygons as you would with a pencil sketch using an eraser.

Thanks to Deutsches Archäologisches Institut, Groupements forestiers Québec, Amsa, and Kanton Luzern for sponsoring these enhancements.

Quality of life improvements

Starting with this new version, the scale bar overlay will now respect projects’ distance measurement units, allowing for scale bars in imperial and nautical units.

QField now offers a rendering quality setting which, at the cost of a slightly reduced visual quality, results in faster rendering speeds and lower memory usage. This can be a lifesaver for older devices having difficulty handling large projects and helps save battery life.

Vector tile layer support has been improved with the automated download of missing fonts and the possibility of toggling label visibility. This pair of changes makes this resolution-independent layer type much more appealing.

On iOS, layouts are now printed by QField as PDF documents instead of images. While this was the case for other platforms, it only became possible on iOS recently after work done by one of our ninjas in QGIS itself.

Many thanks to DB Fahrwgdienste for sponsoring stabilization efforts and fixes during this development cycle.

Qt 6, the latest generation of the cross-platform framework powering QField

Last but not least, QField 3.0 is now built against Qt 6. This is a significant technological milestone for the project as this means we can fully leverage the latest technological innovations into this cross-platform framework that has been powering QField since day one.

On top of the new possibilities, QField benefited from years of fixes and improvements, including better integration with Android and iOS platforms. In addition, the positioning framework in Qt 6 has been improved with awareness of the newer GNSS constellations that have emerged over the last decade.

Forest-themed release names

Forests are critical in climate regulation, biodiversity preservation, and economic sustainability. Beginning with QField 3.0 “Amazonia” and throughout the 3.X’s life cycle, we will choose forest names to underscore the importance of and advocate for global forest conservation.

Software with service

OPENGIS.ch and Oslandia provides the full range of services around QField and QGIS : training, consulting, adaptation, specific development and core development, maintenance and assistance. Do not hesitate to contact us and detail your needs, we will be happy to collaborate : [email protected]

As always, we hope you enjoy this new release. Happy field mapping!

Strategic partnership agreement between Oslandia and OpenGIS.ch on QField

Who are we?

🤔 For those unfamiliar with Oslandia, OpenGIS.ch, or even QGIS, let’s refresh your memory:

👉 Oslandia is a French company specializing in open-source Geographic Information Systems (GIS). Since our establishment in 2009, we have been providing consulting, development, and training services in GIS, with reknown expertise. Oslandia is a dedicated open-source player and the largest contributor to the QGIS solution in France.

👉 As for OPENGIS.ch, they are a Swiss company specializing in the development of open-source GIS software. Founded in 2011, OPENGIS.ch is the largest Swiss contributor to QGIS. OPENGIS.ch is the creator of QField, the most widely used open-source mobile GIS solution for geomatics professionals.

OPENGIS.ch also offers QFieldCloud as a SaaS or on-premise solution for collaborative field project management.

😲 Some may still be unfamiliar with #QGIS ?

It is a free and open-source Geographic Information System that allows creating, editing, visualizing, analyzing, and publicating geospatial data. QGIS is a cross-platform software that can be used on desktops, servers, as a web application, or as a development library.

QGIS is open-source software developed by multiple contributors worldwide. It is an official project of the OpenSource Geospatial Foundation (OSGeo) and is supported by the QGIS.org association. See https://qgis.org

A Partnership?

🎉 Today, we are delighted to announce our strategic partnership aimed at strengthening and promoting QField, the mobile application companion of QGIS Desktop.

🌟 This partnership between Oslandia and OPENGIS.ch is a significant step for QField and open-source mobile GIS solutions. It will consolidate the platform, providing users worldwide with simplified access to effective tools for collecting, managing, and analyzing geospatial data in the field.

📱 QField, developed by OPENGIS.ch, is an advanced open-source mobile application that enables GIS professionals to work efficiently in the field, using interactive maps, collecting real-time data, and managing complex geospatial projects on Android, iOS, or Windows mobile devices.

↔ QField is cross-platform, based on the QGIS engine, facilitating seamless project sharing between desktop, mobile, and web applications.

🕸 QFieldCloud (https://qfield.cloud), the collaborative web platform for QField project management, will also benefit from this partnership and will be enhanced to complement the range of tools within the QGIS platform.

Reactions

❤ At Oslandia, we are thrilled to collaborate with OPENGIS.ch on QGIS technologies. Oslandia shares with OPENGIS.ch a common vision of open-source software development: a strong involvement in development communities, work in respect with the ecosystem, an highly skilled expertise, and a commitment to industrial-quality, robust, and sustainable software development.

👩‍💻 With this partnership, we aim to offer our clients the highest expertise across all software components of the QGIS platform, from data capture to dissemination.

🤝 On the OpenGIS.ch side, Marco Bernasocchi adds:

The partnership with Oslandia represents a crucial step in our mission to provide leading mobile GIS tools with a genuine OpenSource credo. The complementarity of our skills will accelerate the development of QField and QFieldCloud and meet the growing needs of our users.

Commitment to open source

🙏 Both companies are committed to continue supporting and improving QField and QFieldCloud as open-source projects, ensuring universal access to this high-quality mobile GIS solution without vendor dependencies.

Ready for field mapping ?

🌏 And now, are you ready for the field?

So, download QField (https://qfield.org/get), create projects in QGIS, and share them on QFieldCloud!

✉ If you need training, support, maintenance, deployment, or specific feature development on these platforms, don’t hesitate to contact us. You will have access to the best experts available: [email protected].


Store and visualize your raster in the Cloud with COG and QGIS

We have recently been working for the French Space Agency ( CNES ) who needed to store and visualize satellite rasters in a cloud platform. They want to access the image raw data, with no transformation, in order to fullfill deep analysis like instrument calibration. Using classic cartographic server standard like WMS or TMS is not an option because those services transform datasets in already rendered tiles.

We chose to use a quite recent format managed by GDAL, the COG (Cloud Optimize Geotiff) and target OVH cloud platform for it provides OpenStack, a open source cloud computing platform.

How it works

A COG file is a GEOTiff file which inner structure is tiled, meaning that the whole picture is divided in fixed size tile (256 x 256 pixels for instance) so you can efficiently retrieve parts of the raster. In addition to the HTTP/1.1 standard feature range request, it is possible to get specific tiles of an image through the network without downloading the entire raster.

We used a service provided by OpenStack, called Object Storage to serve the COG imagery. Object storage allows to store and retrieve file as objects using HTTP GET/POST requests.

Why not WCS ?

Web Coverage Service standard could have been an option. A WCS server can serve raw data according to a given geographic extent. It’s completely possible to deploy a container or a VPS (Virtual Private Server) running a WCS Server in a cloud plateform. The main advantages of the COG solution over WCS Server is that you don’t have to deal with the burden of deploying a server, like giving it ressources, configuring load balancing, handle updates, etc…

The beauty of COG solution is its simplicity. It is only HTTP requests, and everything else (rendering for instance) is done on the client side.

Step by step

Here are the different steps you’d have to go through if you’re willing to navigate in a big raster image directly from the cloud.

First, let’s generate a COG file

gdal_translate inputfile.tif cogfile.tif -co TILED=YES -co COPY_SRC_OVERVIEWS=YES -co COMPRESS=DEFLATE

Install your openstack-client, it can be achieved easily with Python pip install command line

$ pip install python-openstackclient

Next, configure your openstack client in order to generate an athentification token. To do so you need to download your project specific openrc file to setup your environment)

$ source myproject-openrc.sh
Please enter your OpenStack Password for project myproject as user myuser:
**********
$ openstack token issue                                 
+------------+-----------------------------------------------------------------------------------------------------------------------------------------------------------------------------------------+
| Field      | Value                                                                                                                                                                                   |
+------------+-----------------------------------------------------------------------------------------------------------------------------------------------------------------------------------------+
| expires    | 2020-07-21T08:15:12+0000                                                                                                                                                                |
| id         | xxxx_my_token_xxxx
| project_id | 97e2e750f1904b41b76f80a50dabde0a                                                                                                                                                        |
| user_id    | 18f7ccaf1a2d4344a4e35f0d84eb065e                                                                                                                                                        |
+------------+-----------------------------------------------------------------------------------------------------------------------------------------------------------------------------------------+

You are now good to push you COG file to the cloud instance

openstack object create MyContainer cogfile.tif --name cogfile.tif

Before starting QGIS, 2 environment variables need to be set.  (replace xxxx_my_token_xxxx with the token you’d just come to generate)

$ export SWIFT_AUTH_TOKEN=xxxx_my_token_xxxx
$ export SWIFT_STORAGE_URL=https://storage.sbg.cloud.ovh.net/v1/AUTH_$OS_PROJECT_ID

It can also be done directly from the QGIS Python console by setting those variable using the os.environ.

Finally, add a cloud raster data source in in QGIS

You can now navigating into your image directly reading it from the cloud

© CNES 2018, Distribution Airbus DS

Performances

While panning in the map, QGIS will download only few tiles from the image in order to cover the view extent. The display latency that you could see in the video depends essentially on:

  • The number of band of your image
  • The pixel size
  • Your internet connection (mine, the one use for the video, is not an awesome one)

Note that the white flickering that you could see when you move in the map and the raster is refreshed should be removed in next version of QGIS according to this QEP.

What’s next ?

Thanks so much to the GDAL and QGIS contributors for adding such a nice feature ! It brings lots of possibilities for organizations that have to deal with great number of big raster and just want to explore part of it.

We are already thinking about further improvments (ease authentification, better integration with processing…), so if you’re willing to fund them or just want to know more about QGIS, feel free to contact us at [email protected]. And please have a look at our support offering for QGIS.

Publication de l’extension COVADIS RAPEA pour QWAT et QGEP

QWAT est une application open source de gestion des réseaux d’eau potable émanant des collectivités de Pully, le SIGE à Vevey, Morges et Lausanne.
QGEP est son homologue dédiée à la gestion des eaux usées et pluviales, initiée par le groupe utilisateur QGIS Suisse.

L’échange de données entre institutions est une pierre angulaire des politiques de l’eau. Ces échanges se basent sur des formats d’échanges standardisés. Ainsi les Cantons de Fribourg (format aquaFRI) ou de Vaud (format SIRE) conditionnent certaines subventions publiques à la transmission des données selon des formats pré-définis et permettent à ces échelons administratifs d’avoir une vision globale des réseaux humides.

Dans le cadre d’une expérimentation des outils QWAT (eau potable) et QGEP (eaux usées), Charentes Eaux a souhaité mettre en œuvre des extensions dédiées au standard d’échange de données sur les réseaux d’eau Français, le Géostandard Réseaux d’adduction d’eau potable et d’assainissement (RAEPA) défini par la Commission de validation des données pour l’information spatialisée (COVADIS).

Oslandia a été mandaté pour mettre en œuvre des instances de QWAT et QGEP, réaliser les extensions RAEPA pour chacun de ces outils, et aider Charente Eaux à charger les données des collectivités membres de ce syndicat mixte.

https://charente-eaux.fr/le-syndicat/qui-sommes-nous/

Le travail a été publié pour QWAT sous forme d’une extension standardisée dans le dépôt l’organisation QWAT https://github.com/qwat/extension_fr_raepa/

Pour QGEP, il n’existe pas encore de fonctionnalité pour gérer d’extension, le dépôt https://gitlab.com/Oslandia/qgep_extension_raepa/ contient donc les définitions de données et de vues à rajouter manuellement au modèle de données.

La compatibilité des modèles de données a été évaluée et le choix a été fait de ne faire que des vues dédiées à l’export de données. Il est techniquement possible de faire des vues éditables pour permettre le chargement de données via ces vues depuis des fichiers suivant le gabarit de données RAEPA. Le niveau de simplification et d’agrégation des listes de valeurs rend ce travail peu générique dans l’état actuel du géostandard (v1.1), il est donc plus pertinent à ce stade de réaliser des scripts de chargement sans passer par ce pivot dans le cas de Charente-Eaux

Who is behind QGIS at Oslandia ?

You are using QGIS and look for support services to improve your experience and solve problems ? Oslandia is here to help you with our full QGIS editor service range ! Discover our team members below.

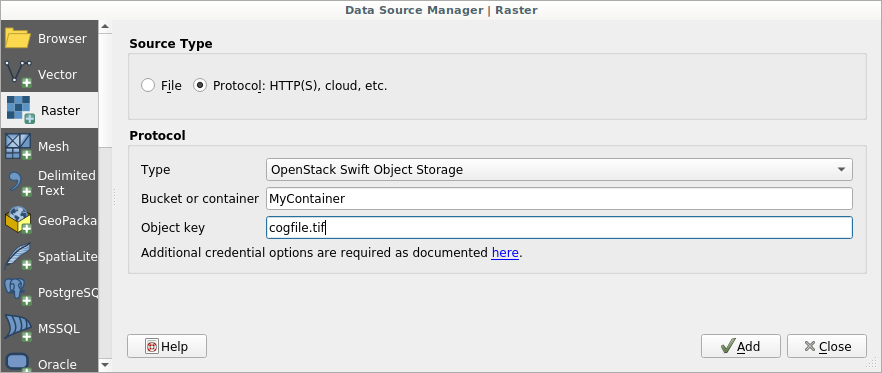
You will probably interact first with our pre-sales engineer Bertrand Parpoil. He leads Geographical Information System projects for 15 years for large corporations, public administrations or hi-tech SME. Bertrand will listen to your needs and explore your use cases, to offer you the best set of services.

Régis Haubourg also takes part in the first steps of projects to analyze your usages and improve them. GIS Expert, he knows QGIS by heart and will make the most of its capabilities. As QGIS Community Manager at Oslandia, he is very active in the QGIS community of developers and contributors. He is president of the Francophone OSGeo local chapter ( OSGeo-fr ), QGIS voting member, organizes the French QGIS day conference in Montpellier, and participates to QGIS community meetings. Before joining Oslandia, he led the migration to QGIS and PostGIS at the Adour-Garonne Water Agency, and now guides our clients with their GIS migrations to OpenSource solutions. Régis is also a great asset when working on water, hydrology and other specific thematic subjects.

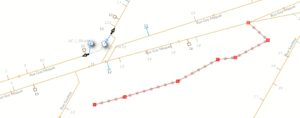
Loïc Bartoletti develops QGIS, specializing in features corresponding to his fields of interests : network management, topography, urbanism, architecture… We find him contributing to advanced vector editing in QGIS, writing Python plugins, namely for DICT management. Pushing CAD and migrations from CAD tools to GIS and QGIS is one of his major goals. He will develop your custom applications, combining technical expertise and functional competences. When bored, Loïc packages software on FreeBSD.

Vincent Mora is senior developer in Python and C++, as well as PostGIS expert. He has a strong experience in numerical simulation. He likes coupling GIS (PostGIS, QGIS) with 3D numerical computing for risk management or production optimization. Vincent is an official QGIS committer and can directly integrate your needs into the core of the software. He is also GDAL committer and optimizes low-level layers of your applications. Among numerous activities, Vincent serves as lead developer of the development team for Hydra Software, a tool dedicated to unified hydraulics and hydrology modelling and simulation based on QGIS.

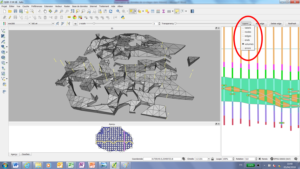
Hugo Mercier is an officiel QGIS committer too for several years. He regularly talks in international conferences on PostGIS, QGIS and other OpenSource GIS softwares. He will implement your needs with new QGIS features, develop innovative plugins ( like QGeoloGIS ) and design and build your new custom applications, solving all kind of technological challenges.

Paul Blottière completes our QGIS committers : very active on core development, Paul has refactored the QGIS server component to bring it to an industry-grade quality level. He also designed and implemented the infrastructure allowing to guarantee QGIS server performances. He dedicated himself to QGIS server OGC certification, especially for WMS (1.3). Thanks to this work QGIS is now a reference OGC implementation.

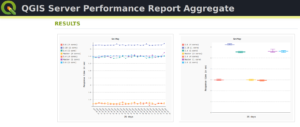
Julien Cabièces recently joined Oslandia, and quickly dived into QGIS : he contributes to the core of this Desktop GIS, on the server component, as well as applications linked to numerical simulation. Coming from a satellite imagery company with industrial applications, he uses his flexibility to answer all your needs. He brings quality and professionalism to your projects, minimizing risks for large production deployments.

You may also meet Vincent Picavet. Oslandia’s founder is a QGIS.org voting member, and is involved in the project’s evolution and the organization of the community.

Aside from these core contributors, all other Oslandia members also master QGIS integrate this tool into their day-to-day projects.

Bertrand, Régis, Loïc, Vincent (x2), Hugo, Paul et Julien are in tune with you and will be happy to work together for your migrations, application development, and all your desires to contribute to the QGIS ecosystem. Do not hesitate to contact us !

QGIS Snapping improvements

A few months ago, we proposed to the QGIS grant program to make improvements to the snap cache in QGIS. The community vote selected our project which was funded by QGIS.org. Developments are now mostly finished.

In short, snapping is crucial for editing geospatial features. It is the only way to ensuring they are topologically related, ie, connected vertices have exactly the same coordinates even if manual digitizing on screen is imprecise by nature.  Snapping correctly supposes QGIS have in memory an indexed cache of the geometries to snap to. And maintainting this cache when data is modified, sometimes by another user or database logic, can be a real challenge. This it exactly what this work adresses.

The proposal was divided into two different tasks:

  • Manage circular dependencies
  • Relax the snap cache index build

Manage cicular data dependencies

Data dependencies

Data dependency is an existing feature that allows you to configure QGIS to reload layers (and their snapping cache) when a layer is modified.

It is useful when you store your data in a database and you set up triggers to maintain consistency between the different tables of your data model.

For instance, say you have topological informations containing lines and nodes. Nodes are part of lines and lines go through nodes. Then, you move a node in QGIS, and save your modifications to the database. In order to keep the data consistent, a trigger updates the geometry of the line going through the modified node.

Node 2 is modified, Line 1 is updated accordingly

QGIS, as a database client, has no information that the line layer currently displayed in the canvas needs to be refreshed after the trigger. Although the map canvas will be up to date, because QGIS fetches data for display without any caching system, the snapping cache is not and you’ll end up with ghost snapping highlights issues.

Snapping highlights (light red) differ from real line (orange)

Defining a dependency between nodes and lines layers tells QGIS that it has to refresh the line layer when a node is modified.

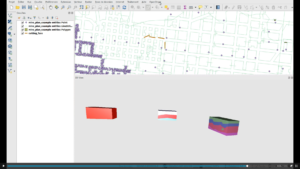
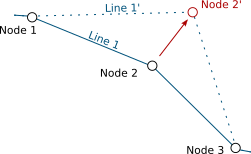
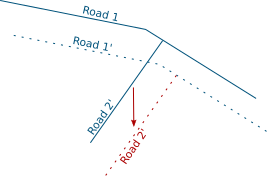
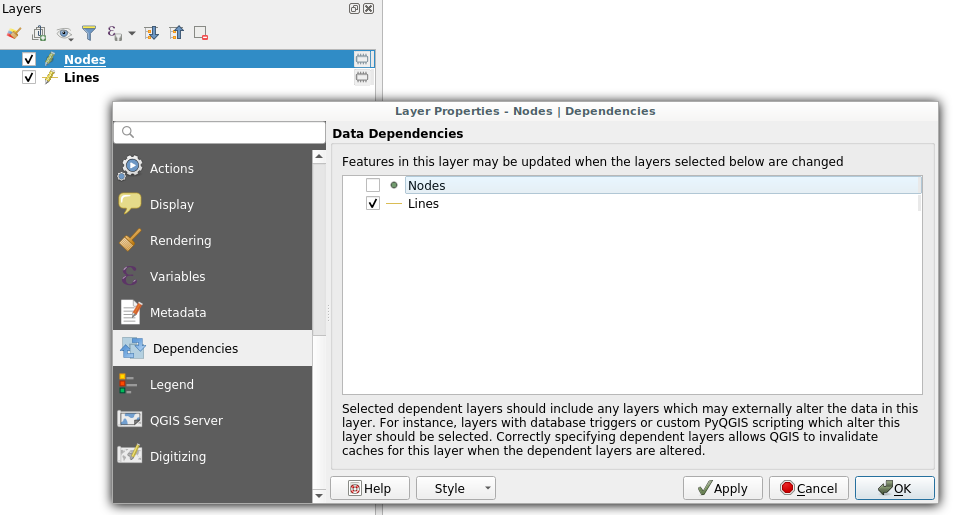
Dependencies configuration: Lines layer will be refreshed whenever Nodes layer is modified

It also have to work the other way, modifying a line should update the nodes to ensure they still are on the line.

Circular data dependencies

So here we are, lines depend on nodes which depend on lines which depend on nodes which…

That’s what circular dependencies is about. This specific behavior was previously forbidden and needed a special way to deal with it. Thanks to this recent development, it is now possible.

It’s also possible to add the layer itself as one of its own dependencies. It helps dealing with specific cases where one feature modification could lead to a modification of another feature in the same layer (to keep consistency on road networks for instance).

Road 2 is modified, Road 1 is updated accordingly

This feature is available in the next QGIS LTR version 3.10.

Relax the snapping cache index build

If you work in QGIS with huge projects displaying a lot of vector data, and you enable snapping while editing these data, you probably already met this dialog:

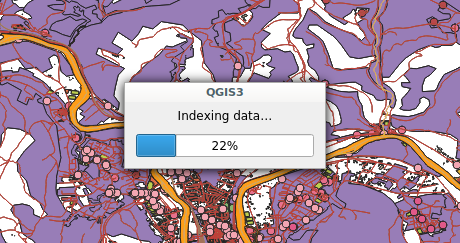
Snap indexing dialog

This dialog informs you that data are currently being indexed so you can snap on them while you will edit feature geometry. And for big projects, this dialog can last for a really long time. Let’s work on speeding it up!

What’s a snap index?

Let’s say you want to move a line and snap it onto another one. While you drag your line with the mouse, QGIS will look for an existing geometry beneath the mouse cursor (with a certain pixel tolerance) every time you move your mouse. Without spatial index, QGIS will have to go through every geometry in your layer to check if the given geometry is beneath the cursor position. This would be very ineffective.

In order to prevent this, QGIS keeps an index where vector data are stored in a way that it can quickly find out what geometry is beneath the mouse cursor. The building of this data structure takes time and that is what the progress dialog is about.

Firstly: Parallelize snap index build

If you want to be able to snap on all layers in your project, then QGIS will have to build one snap index for each layer. This operation was made sequentially meaning that if you have for instance 20 layers and the index building last approximatively 3 seconds for each, then the whole index building will last 1 minute. We made modifications to QGIS so that index building could be done in parallel. As a result, the total index building time could theoretically be 3 seconds!

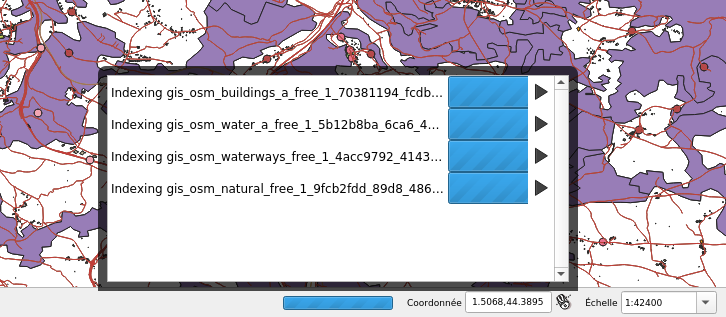
4 layers snap index being built in parallel

However, parallel operations are limited by the number of CPU cores of your machine, meaning that if you have 4 cores (core i7 for instance) then the total time will be up to 4 times faster than when the building is sequential (and last 15 seconds in our example).

Secondly: relax the snap build

For big projects, parallelizing index building is not enough and still takes too much time. Futhermore, to reduce snap index building, an existing optimisation was to build the spatial index for a specific area of interest (determined according to the displayed area and layer size). As a consequence, when you’ve done waiting for an index currently building and you move the map or zoom in/out, you could possibly trigger another snap index building and wait again.

So, the idea was to avoid waiting at all. Snap index is now built whenever it needs to (when you first enable snapping, when you move or zoom) but the user doesn’t have to wait for the build to be over and can continue what it was doing (creating feature, moving…). Snapping highlights will be missing when the index is currently being built and will appear gradually as soon as they finished. That’s what we call the relaxing mode.

No waiting dialog, snapping highlights appears as soon as snap index is ready

This feature has been merged into current QGIS master and will be present in future QGIS 3.12 release. We keep working on this feature in order to make it more stable and efficient.

What’s next

We’ll continue to improve this feature in the coming days, if you have the chance to test it and encounter issues please let us know on the QGIS tracker. If you think about a missing feature or just want to know more about QGIS, feel free to contact us at [email protected]. And please have a look at our support offering for QGIS.

Many thanks to QGIS grant program for funding these new features. Thanks also to all the people involved in reviewing the code and helping to better understand the existing mechanism.


(Fr) Rechercher une adresse avec QGIS

Sorry, this entry is only available in French.

QGIS Versioning now supports foreign keys!

QGIS-versioning is a QGIS and PostGIS plugin dedicated to data versioning and history management. It supports :

  • Keeping full table history with all modifications
  • Transparent access to current data
  • Versioning tables with branches
  • Work offline
  • Work on a data subset
  • Conflict management with a GUI

QGIS versioning conflict management

In a previous blog article we detailed how QGIS versioning can manage data history, branches, and work offline with PostGIS-stored data and QGIS. We recently added foreign key support to QGIS versioning so you can now historize any complex database schema.

This QGIS plugin is available in the official QGIS plugin repository, and you can fork it on GitHub too !

Foreign key support

TL;DR

When a user decides to historize its PostgreSQL database with QGIS-versioning, the plugin alters the existing database schema and adds new fields in order to track down the different versions of a single table row. Every access to these versioned tables are subsequently made through updatable views in order to automatically fill in the new versioning fields.

Up to now, it was not possible to deal with primary keys and foreign keys : the original tables had to be constraints-free.  This limitation has been lifted thanks to this contribution.

To make it simple, the solution is to remove all constraints from the original database and transform them into a set of SQL check triggers installed on the working copy databases (SQLite or PostgreSQL). As verifications are made on the client side, it’s impossible to propagate invalid modifications on your base server when you “commit” updates.

Behind the curtains

When you choose to historize an existing database, a few fields are added to the existing table. Among these fields, versioning_ididentifies  one specific version of a row. For one existing row, there are several versions of this row, each with a different versioning_id but with the same original primary key field. As a consequence, that field cannot satisfy the unique constraint, so it cannot be a key, therefore no foreign key neither.

We therefore have to drop the primary key and foreign key constraints when historizing the table. Before removing them, constraints definitions are stored in a dedicated table so that these constraints can be checked later.

When the user checks out a specific table on a specific branch, QGIS-versioning uses that constraint table to build constraint checking triggers in the working copy. The way constraints are built depends on the checkout type (you can checkout in a SQLite file, in the master PostgreSQL database or in another PostgreSQL database).

What do we check ?

That’s where the fun begins ! The first thing we have to check is key uniqueness or foreign key referencing an existing key on insert or update. Remember that there are no primary key and foreign key anymore, we dropped them when activating historization. We keep the term for better understanding.

You also have to deal with deleting or updating a referenced row and the different ways of propagating the modification : cascade, set default, set null, or simply failure, as explained in PostgreSQL Foreign keys documentation .

Nevermind all that, this problem has been solved for you and everything is done automatically in QGIS-versioning. Before you ask, yes foreign keys spanning on multiple fields are also supported.

What’s new in QGIS ?

You will get a new message you probably already know about, when you try to make an invalid modification committing your changes to the master database

Error when foreign key constraint is violated

Partial checkout

One existing Qgis-versioning feature is partial checkout. It allows a user to select a subset of data to checkout in its working copy. It avoids downloading gigabytes of data you do not care about. You can, for instance, checkout features within a given spatial extent.

So far, so good. But if you have only a part of your data, you cannot ensure that modifying a data field as primary key will keep uniqueness. In this particular case, QGIS-versioning will trigger errors on commit, pointing out the invalid rows you have to modify so the unique constraint remains valid.

Error when committing non unique key after a partial checkout

Tests

There is a lot to check when you intend to replace the existing constraint system with your own constraint system based on triggers. In order to ensure QGIS-Versioning stability and reliability, we put some special effort on building a test set that cover all use cases and possible exceptions.

What’s next

There is now no known limitations on using QGIS-versioning on any of your database. If you think about a missing feature or just want to know more about QGIS and QGIS-versioning, feel free to contact us at [email protected]. And please have a look at our support offering for QGIS.

Many thanks to eHealth Africa who helped us develop these new features. eHealth Africa is a non-governmental organization based in Nigeria. Their mission is to build stronger health systems through the design and implementation of data-driven solutions.

QGIS 3 and performance analysis

Context

Since last year we (the QGIS communtity) have been using QGIS-Server-PerfSuite to run performance tests on a daily basis. This way, we’re able to monitor and avoid regressions according to some test scenarios for several QGIS Server releases (currently 2.18, 3.4, 3.6 and master branches). However, there are still many questions about performance from a general point of view:

  • What is the performance of QGIS Server compared to QGIS Desktop?
  • What are the implications of feature simplification for polygons and lines?
  • Does the symbology have a strong impact on performance and in which proportion?

Of course, it’s a broad and complex topic because of the numerous possibilities offered by the rendering engine of QGIS. In this article we’ll look at typical use cases with geometries coming from a PostgreSQL database.

Methodology

The first way to monitor performance is to measure the rendering time. To do so, the Map canvas refreshis activated in the Settings of QGIS Desktop. In this way we can get the rendering time from within the Rendering tab of log messages in QGIS Desktop, as well as from log messages written by QGIS Server.

The rendering time retrieved with this method allows to get the total amount of time spent in rendering for each layer (see the source code).

But in the case of QGIS Server another interesting measure is the total time spent for a specific request, which may be read from log messages too. There are indeed more operations achieved for a single WMS request than a simple rendering in QGIS Desktop:

The rendering time extracted from QGIS Desktop corresponds to the core rendering time displayed in the sequence diagram above. Moreover, to be perfectly comparable, the rendering engine must be configured in the same way in both cases. In this way, and thanks to PyQGIS API, we can retrieve the necessary information from the Python console in QGIS Desktop, like the extent or the canvas size, in order to configure the GetMap WMS request with the appropriate WIDTH,, HEIGHT , and BBOX parameters.

Another way to examine the performance is to use a profiler in order to inspect stack traces. These traces may be represented as a FlameGraph. In this case, debug symbols are necessary, meaning that the rendering time is not representative anymore. Indeed, QGIS has to be compiled in Debug mode.

Polygons

For these tests we use the same dataset as that for the daily performance tests, which is a layer of polygons with 282,776 features.

Feature simplification deactivated

Let’s first have a look at the rendering time and the FlameGraph when the simplification is deactivated. In QGIS Desktop, the mean rendering time is 2591 ms. Using to the PyQGIS API we are able to get the extent and the size of the map to render the map again but using a GetMap WMS request this time.

In this case, the rendering time is 2469 ms and the total request time is 2540 ms. For the record, the first GetMap request is ignored because in this case, the whole QGIS project is read and cached, meaning that the total request time is much higher. But according to those results, the rendering time for QGIS Desktop and QGIS Server are utterly similar, which makes sense considering that the same rendering engine is used, but it is still very reassuring :).

Now, let’s take a look to the FlameGraph to detect where most of the time is spent.


Undoubtedly the FlameGraph’s are similar in both cases, meaning that if we want to improve the performance of QGIS Server we need to improve the performance of the core rendering engine, also used in QGIS Desktop. In our case the main method is QgsMapRendererParallelJob::renderLayerStatic where most of the time is spent in:

Methods Desktop % Server %
QgsExpressionContext::setFeature 6.39 6.82
QgsFeatureIterator::nextFeature 28.77 28.41
QgsFeatureRenderer::renderFeature 29.01 27.05

Basically, it may be simplified like:

Clearly, the rendering takes about 30% of the total amount of time. In this case geometry simplification could potentially help.

Feature simplification activated

Geometry simplification, available for both polygons and lines layers, may be activated and configured through layer’s Properties in the Rendering tab. Several parameters may be set:

  • Simplification may be deactivated
  • Threshold for a more drastic simplification
  • Algorithm
  • Provider simplification
  • Scale

Once the simplification activated, we varied the threshold as well as the algorithm in order to detect performance jumps:

The following conclusions can be drawn:

  • The Visvalingam algorithm should be avoided because it begins to be efficient with a high threshold, meaning a significant lack of precision in geometries
  • The ideal threshold for Snap To Grid and Distance algorithms seems to be 1.05. Indeed, considering that it’s a very low threshold, the precision of geometries is still pretty good for a major improvement in rendering time though

For now, these tests have been run on the full extent of the layer. However, we still have a Maximum scale parameter to test, so we’ve decreased the scale of the layer:

And in this case, results are pretty interesting too:

Several conclusions can be drawn:

  • Visvalingam algorithm should be avoided at low scale too
  • Snap To Grid seems counter-productive at low scale
  • Distance algorithm seems to be a good option

Lines

For these tests we also use the same dataset as that for daily performance tests, which is a layer of lines with 125,782 features.

Feature simplification activated

In the same way as for polygons we have tested the effect of the geometric simplification on the rendering time, as well as algorithms and thresholds:

In this case we have exactly the same conclusion as for polygons: the Distance algorithm should be preferred with a threshold of 1.05.

For QGIS Server the mean rendering time is about 1180 ms with geometry simplification compared to 1108 ms for QGIS Desktop, which is totally consistent. And looking at the FlameGraph we note that once again most of the time is spent in accessing the PostgreSQL database (about 30%) and rendering features (about 40%).


Symbology

Another parameter which has an obvious impact on performance is the symbology used to draw the layers. Some features are known to be time consuming, but we’ve felt that a a thorough study was necessary to verify it.


Firstly, we’ve studied the influence of the width as well as the Single Symbol type on the rendering time.

Some points are noteworthy:

Simple Line is clearly the less time consuming

– Beyond the default 0.26 line width, rendering time begins to raise consequently with a clear jump in performance


Another interesting feature is the Draw effects option, allowing to add some fancy effects (shadow, glow, …).

However, this feature is known to be particularly CPU consuming. Actually, rendering all the 125,782 lines took so long that we had to to change to a lower scale, with just some a few dozen lines. Results are unequivocal:


The last thing we wanted to test for symbology is the effect of the Categorized classification. Here are the results for some classifications with geometry simplification activated:

  • No classification: 1108 ms
  • A simple classification using the column “classification” (8 symbols): 1148 ms
  • A classification based on a stupid expression “classification x 3″ (8 symbols): 1261 ms
  • A classification based on string comparison “toponyme like ‘Ruisseau*'” (2 symbols): 1380 ms
  • A classification with a specific width line for each category (8 symbols): 1850 ms

Considering that a simple classification does not add an excessive extra-cost, it seems that the classification process itself is not very time consuming. However, as soon as an expression is used, we can observe a slight jump in performance.

Labeling

Another important part to study regarding performance is labeling and the underlying positioning. For this test we decreased the scale and varied the Placement parameter without tuning anything.

Clearly, the parallel labeling is much more time consuming than the other placements. However, as previously stated, we used the default parameters for each positioning, meaning that the number of labels really drawn on the map differs from a placement to another.

Points

The last kind of geometries we have to study is points. Similarly to polygons and lines, we used the same dataset as that of performance tests, that is a layer with 435588 points.

In the case of points geometries geometry simplification is of course not available. So we are going to focus on symbology and the impact of marker size.

Obviously Font Marker must be used carefully because of the underlying jump in performance, as well as SVG Symbols. Moreover, contrary to Simple Marker, an increase of the size implies a drastic augmentation in time rendering.

General conclusion

Based on this factual study, several conclusions can be drawn.

Globally, FlameGraph for QGIS Desktop and QGIS Server are completely similar as well as rendering time.

It means that if we want to improve the performance of QGIS Server, we have to work on the desktop configuration and the rendering engine of the QGIS core library.

Extracting generic conclusions from our tests is very difficult, because it clearly depends on the underlying data. But let’s try to suggest some recommendations :).

Firstly, geometry simplification seems pretty efficient with lines and polygons as soon as the algorithm is chosen cautiously, and as long as your features include many vertices. It seems that the Distance algorithm with a 1.05 threshold is a good choice, with both high and low scale. However, it’s not a magic solution!

Secondly, a special care is needed with regards to symbology. Indeed, in some cases, a clear jump in performance is notable. For example, fancy effects and Font Marker SVG Symbol have to be used with caution if you’re picky on rendering time.

Thirdly, we have to be aware of the extra cost caused by labeling, especially the Parallel  placement for line geometries. On this subject, a not very well-known parameter allows to drastically reduce labeling time: the PAL candidates option. Actually, we may decrease the labeling time by reducing the number of candidates. For an explicit use case, you can take a look at the daily reports.

In any case, improving server performance in a substantial way means improving the QGIS core library directly.

Especially, we noticed thanks to FlameGraph that most of the time is spent in drawing features and managing the data from the PostgreSQL database. By the way, a legitimate question is: “How much time do we spend on waiting for the database?”. To be continued 😉

If you hit performance issues on your specific configuration or want to improve QGIS awesomeness, we provide a unique QGIS support offer at http://qgis.oslandia.com/ thanks to our team of specialists!

Funding for selective masking in QGIS is now complete!

Few months ago, Oslandia launched QGIS lab’s , a place to advertise our new ideas for QGIS, but also a place to help you find co funders to make dreams become reality.

The first initiative is about label selective masking, a feature that will allow us to achieve even more professional rendering for our maps.

Selective masking


Thanks to the commitment of the Swiss QGIS user group and local authorities, this work is now funded !

We now can start working hard to deliver you this great feature for QGIS 3.10

Thanks again to our funders

A last word, this is not a classical crowd funding initiative, but a classical contract for each funder.

No more reason not to contribute to free and open source software!

Visualization of borehole logs with QGIS

At Oslandia, we have been working on a component based on the QGIS API for the visualization of well and borehole logs.

This component is aiming at displaying data collected vertically along wells dug underground. It mainly focuses on data organized in series of contiguous samples, and is generic enough to be used for both vertical (where the Y axis corresponds to a depth underground) and horizontal data (where the X axis corresponds to time for example). One of the main concerns was to ensure good display performances with an important volume of sample points (usually hundred of thousands sample points).

We have already been working on plot components in the past, but for specific QGIS plugins (both for timeseries and stratigraphic logs) and thought we will put these past experiences to good use by creating a more generic library.

We decided to represent sample points as geometry features in order to be able to reuse the rich symbology engine of QGIS. This allows users to represent their data whatever they like without having to rewrite an entire symbology engine. We also benefit from all the performance optimizations that have been added and polished over the years (on-the-fly geometry simplification for example).

Albeit written in Python, we achieved good display performances. The key trick was to avoid copy of data between the sample points read by QGIS and the Python graphing component. It is achieved thanks to the fact that the PyQGIS API has some functions that respect the buffer protocol.

You can have a look at the following video to see this component integrated in an existing plugin.

Visualization of borehole logs withing QGIS

It is distributed as usual under an open source license and the code repository can be found on GitHub.

Do not hesitate to contact us ( [email protected] ) if you are interested in any enhancements around this component.

QGIS Server 3 : OGC Certification work for WFS 1.1.0

QGIS Server is an open source OGC data server which uses QGIS engine as backend. It becomes really awesome because a simple desktop qgis project file can be rendered as web services with exactly the same rendering, and without any mapfile or xml coding by hand.

QGIS Server provides a way to serve OGC web services like WMS, WCS, WFS and WMTS resources from a QGIS project, but can also extend services like GetPrint which takes advantage of QGIS’s map composer power to generate high quality PDF outputs.

Since the 3.0.2 version, QGIS Server is certified as an official OGC reference implementation for WMS 1.3.0 and reports are generated in a daily continuous integration to avoid regressions.


Thus, the next step was naturally to take a look at the WFS 1.1.0 thanks to the support of the QGIS Grant Program

Side note, this Grant program is made possible thanks to your direct sponsoring and micro-donations to QGIS.org.

TEAM Engine test suite for WFS 1.1.0

We use a tool provided by the OGC Compliance Program to run dedicated tests on the server : Teamengine (Test, Evaluation, And Measurement Engine).

Test suites are available through a web interface. However, for the needs of continuous integration, these tests have to be run without user interaction. In the case of WMS 1.3.0, nothing more easy than using the REST API:

$ curl "http://localhost:8081/teamengine/rest/suites/wms/1.20/run?queryable=queryable&basic=basic&capabilities-url=http://172.17.0.2/qgisserver?REQUEST=GetCapabilities%26SERVICE=WMS%26VERSION=1.3.0%26MAP=/data/teamengine_wms_130.qgs


However, the WFS 1.1.0 test suite does not provide a REST API and makes the situation less straightforward. We switched to using TEAM Engine directly from command line:

$ cd te_base
$ ./bin/unix/test.sh -source=wfs/1.1.0/ctl/main.ctl -form=params.xml

The params.xml file allows to configure underlying tests. In this particular case, the GetCapabilities URL of the QGIS Server to test is given.  Results are available thanks to the viewlog.sh shell script:

$ ./bin/unix/viewlog.sh -logdir=te_base/users/root/ -session=s0001
Test wfs:wfs-main type Mandatory (s0001) Failed (InheritedFailure)
   Test wfs:readiness-tests type Mandatory (s0001/d68e38807_1) Failed (InheritedFailure)
      Test ctl:SchematronValidatingParser type Mandatory (s0001/d68e38807_1/d68e588_1) Failed
      Test wfs:basic-main type Mandatory (s0001/d68e38807_1/d68e636_1) Failed (InheritedFailure)
         Test wfs:run-GetCapabilities-basic-cc-GET type Mandatory (s0001/d68e38807_1/d68e636_1/d68e28810_1) Failed (InheritedFailure)
            Test wfs:wfs-1.1.0-Basic-GetCapabilities-tc1 type Mandatory (s0001/d68e38807_1/d68e636_1/d68e28810_1/d68e1095_1) Passed
               Test ctl:assert-xpath type Mandatory (s0001/d68e38807_1/d68e636_1/d68e28810_1/d68e1095_1/d68e1234_1) Passed
            Test wfs:wfs-1.1.0-Basic-GetCapabilities-tc2 type Mandatory (s0001/d68e38807_1/d68e636_1/d68e28810_1/d68e1100_1) Passed
               Test ctl:assert-xpath type Mandatory (s0001/d68e38807_1/d68e636_1/d68e28810_1/d68e1100_1/d68e1305_1) Passed
            Test wfs:wfs-1.1.0-Basic-GetCapabilities-tc3 type Mandatory (s0001/d68e38807_1/d68e636_1/d68e28810_1/d68e1105_1) Passed
               Test ctl:assert-xpath type Mandatory (s0001/d68e38807_1/d68e636_1/d68e28810_1/d68e1105_1/d68e1558_1) Passed
               Test ctl:assert-xpath type Mandatory (s0001/d68e38807_1/d68e636_1/d68e28810_1/d68e1105_1/d68e1582_1) Passed
               Test ctl:assert-xpath type Mandatory (s0001/d68e38807_1/d68e636_1/d68e28810_1/d68e1105_1/d68e1606_1) Passed
...
...

Finally, a Python script has been written to read these logs and generate HTML report easily readable. Thanks to our QGIS-Server-CertifSuite, providing the continuous integration infrastructure with Docker images, these reports are also generated daily.

Bugfix and Conclusion

First results were clear: a lot of work is necessary to have a QGIS Server certified for WFS 1.1.0!

We started fixing the issues one by one:

And now we have a much better support than 6 months ago

However, some work still need to be done to finally obtain the OGC certification for WFS 1.1.0. To be continued!

Please contact us if you want QGIS server to become a reference implementation for all OGC service !

“QGZ” – A new default project file format for QGIS

Last year we had the opportunity to implement ‘.QGZ’ as  anew variant of  the QGIS 3 project file format.

This is simply a zipped container for the QGS xml file. We took benefit of that container to store the auxiliary storage database into it – only if users choose that optional format though.

In classical mode, the auxiliary database is saved as a .qgd file  along the xml file.

qgd auxiliary storage file


qgz file format saving

When choosing the zipped container, the qgd file falls into the qgz, and this becomes totally transparent for end users. No more issues, you can’t delete it or forget to copy it when sharing project files!

The great news today is that for qgis 3.2, qgz will be the default format!

This will offers many possibilities like embbeding:

  • Resources like fonts, SVG, color ramps, and all styling informations
  • A unified container for off-line editing embedding data into a gpkg format
  • plugins, scripts, processing algorithms and modelers

If you are interested in going further this, please contact us!

Docker images for QGIS

With support from Orange we’ve created Docker images for QGIS. All the material for building and running these images is open-source and freely available on GitHub: https://github.com/Oslandia/docker-qgis.

The docker-qgis repository includes two Docker images: qgis-build and qgis-exec.

The qgis-build image includes all the libraries and tools necessary for building QGIS from source. Building QGIS requires installing a lot of dependencies, so it might not be easy depending on the Operating System you use. The qgis-build image makes it easy and repeatable. The result of a QGIS build is Debian Stretch packages that can be used for building the qgis-exec image, as explained below.

The qgis-exec image includes a runtime environment for QGIS Server. The image makes it easy to deploy and run QGIS Server. It is meant to be be generic and usable in various contexts, and in production. There are two ways to build the qgis-exec image. It can be built from the official QGIS 3 Debian packages (http://qgis.org/debian/), or from local QGIS Debian Stretch packages that were built using the qgis-build image.

We encourage you to go test and use our images! We haven’t pushed the images to the Docker Hub yet, but this is in the plans.

Feel free to contact us on GitHub or by email for any question or request!

QGIS 3.0 has been released

We are very pleased to convey the announcement of the  QGIS 3.0 major release called “Girona”.

The whole QGIS community has been working hard on so many changes for the last two years. This version is a major step in the evolution of QGIS. There are a lot of features, and many changes to the underlying code.

At Oslandia, we pushed some great new features, a lot of bugfixes and made our best to help in synchronizing efforts with the community.

Please note that the installers and binaries are still currently being built for all platforms, Ubuntu and Windows are already there,  and Mac packages are still building.

The ChangeLog and the documentation are still being worked on so please start testing that brand new version and let’s make it stronger and stronger together. The more contributors, the better!

While QGIS 3.0 represent a lot of work, note that this version is not a “Long Term Release” and may not be as stable as required for production work.

We would like to thank all the contributors who helped making QGIS 3 a reality.

Oslandia contributors should acknowledged too : Hugo Mercier, Paul Blottière, Régis Haubourg, Vincent Mora and Loïc Bartoletti.

We also want to thank some those who supported directly important features of QGIS3 :

Orange

The QWAT / QGEP organization

The French Ministry for an Ecological and Inclusive Transition

ESG

and also Grenoble Alpes Métropole

QGIS 3 compiling on Windows

As the Oslandia team work exclusively on GNU/Linux, the exercise of compiling QGIS 3 on Windows 8 is not an everyday’s task :). So we decided to share our experience, we bet that will help some of you.

Cygwin

The first step is to download Cygwin and to install it in the directory C:\cygwin (instead of the default C:\cygwin64). During the installation, select the lynx package:


Once installed, you have to click on the Cygwin64 Terminal icon newly created on your desktop:

Then, we’re able to install dependencies and download some other installers:

[pastacode lang=”bash” manual=”%24%20cd%20%2Fcygdrive%2Fc%2FUsers%2Fhenri%2FDownloads%0A%24%20lynx%20-source%20rawgit.com%2Ftranscode-open%2Fapt-cyg%2Fmaster%2Fapt-cyg%20%3E%20apt-cyg%0A%24%20install%20apt-cyg%20%2Fbin%0A%24%20apt-cyg%20install%20wget%20git%20flex%20bison%0A%24%20wget%20http%3A%2F%2Fdownload.microsoft.com%2Fdownload%2FD%2F2%2F3%2FD23F4D0F-BA2D-4600-8725-6CCECEA05196%2Fvs_community_ENU.exe%0A%24%20chmod%20u%2Bx%20vs_community_ENU.exe%0A%24%20wget%20https%3A%2F%2Fcmake.org%2Ffiles%2Fv3.7%2Fcmake-3.7.2-win64-x64.msi%0A%24%20wget%20http%3A%2F%2Fdownload.osgeo.org%2Fosgeo4w%2Fosgeo4w-setup-x86_64.exe%0A%24%20chmod%20u%2Bx%20osgeo4w-setup-x86_64.exe” message=”” highlight=”” provider=”manual”/]

CMake

The next step is to install CMake. To do that, double clic on the file cmake-3.7.2-win64-x64.msi previously downloaded with wget. You should choose the next options during the installation:


Visual Studio

Then, we have to install Visual Studio and C++ tools. Double click on the vs_community_ENU.exe file and select the Custom installation. On the next page, you have to select Visual C++ chekbox:


OSGeo4W

In order to compile QGIS, some dependencies provided by the OSGeo4W installer are required. Double click on osgeo4w-setup-x86_64.exe and select the Advanced Install mode. Then, select the next packages:

  •  expat
  • fcgi
  • gdal
  • grass
  • gsl-devel
  • iconv
  • libzip-devel
  • libspatialindex-devel
  • pyqt5
  • python3-devel
  • python3-qscintilla
  • python3-nose2
  • python3-future
  • python3-pyyaml
  • python3-mock
  • python3-six
  • qca-qt5-devel
  • qca-qt5-libs
  • qscintilla-qt5
  • qt5-devel
  • qt5-libs-debug
  • qtwebkit-qt5-devel
  • qtwebkit-qt5-libs-debug
  • qwt-devel-qt5
  • sip-qt5
  • spatialite
  • oci
  • qtkeychain

QGIS

To start this last step, we have to create a file C:\OSGeo4W\OSGeo4W-dev.bat containing something like:

[pastacode lang=”bash” manual=”%40echo%20off%20%0Aset%20OSGEO4W_ROOT%3DC%3A%5COSGeo4W64%0Acall%20%22%25OSGEO4W_ROOT%25%5Cbin%5Co4w_env.bat%22%20%0Acall%20%22%25OSGEO4W_ROOT%25%5Cbin%5Cqt5_env.bat%22%20%0Acall%20%22%25OSGEO4W_ROOT%25%5Cbin%5Cpy3_env.bat%22%20%0Aset%20VS140COMNTOOLS%3D%25PROGRAMFILES(x86)%25%5CMicrosoft%20Visual%20Studio%2014.0%5CCommon7%5CTools%5C%20%0Acall%20%22%25PROGRAMFILES(x86)%25%5CMicrosoft%20Visual%20Studio%2014.0%5CVC%5Cvcvarsall.bat%22%20amd64%20%0Aset%20INCLUDE%3D%25INCLUDE%25%3B%25PROGRAMFILES(x86)%25%5CMicrosoft%20SDKs%5CWindows%5Cv7.1A%5Cinclude%20%0Aset%20LIB%3D%25LIB%25%3B%25PROGRAMFILES(x86)%25%5CMicrosoft%20SDKs%5CWindows%5Cv7.1A%5Clib%20%0Apath%20%25PATH%25%3B%25PROGRAMFILES%25%5CCMake%5Cbin%3Bc%3A%5Ccygwin%5Cbin%20%0A%40set%20GRASS_PREFIX%3D%22%25OSGEO4W_ROOT%25%5Capps%5Cgrass%5Cgrass-7.2.1%20%0A%40set%20INCLUDE%3D%25INCLUDE%25%3B%25OSGEO4W_ROOT%25%5Cinclude%20%0A%40set%20LIB%3D%25LIB%25%3B%25OSGEO4W_ROOT%25%5Clib%3B%25OSGEO4W_ROOT%25%5Clib%20%0A%0A%40cmd%20″ message=”” highlight=”” provider=”manual”/]

According to your environment, some variables should probably be adapted. Then in the Cygwin terminal:

[pastacode lang=”bash” manual=”%24%20cd%20C%3A%5C%0A%24%20git%20clone%20git%3A%2F%2Fgithub.com%2Fqgis%2FQGIS.git%0A%24%20.%2FOSGeo4W-dev.bat%0A%3E%20cd%20QGIS%2Fms-windows%2Fosgeo4w” message=”” highlight=”” provider=”manual”/]

In this directory, you have to edit the file package-nightly.cmd to replace:

[pastacode lang=”bash” manual=”cmake%20-G%20Ninja%20%5E” message=”” highlight=”” provider=”manual”/]

by:

[pastacode lang=”bash” manual=”cmake%20-G%20%22Visual%20Studio%2014%202015%20Win64%22%20%5E” message=”” highlight=”” provider=”manual”/]

Moreover, we had to update the environment variable SETUAPI_LIBRARY according to the current position of the Windows Kits file SetupAPI.Lib:

[pastacode lang=”bash” manual=”set%20SETUPAPI_LIBRARY%3DC%3A%5CProgram%20Files%20(x86)%5CWindows%20Kits%5C8.1%5CLib%5Cwinv6.3%5Cum%5Cx64%5CSetupAPI.Lib” message=”” highlight=”” provider=”manual”/]

And finally, we just have to compile with the next command:

[pastacode lang=”markup” manual=”%3E%20package-nightly.cmd%202.99.0%201%20qgis-dev%20x86_64″ message=”” highlight=”” provider=”manual”/]

Victory!

And see you soon for the generation of OSGEO4W packages 😉

Source

https://github.com/qgis/QGIS/blob/ab859c9bdf8a529df9805ff54e7250921a74d877/doc/msvc.t2t


Auxiliary Storage support in QGIS 3

For those who know how powerful QGIS can be using data defined widgets and expressions almost anywhere in styling and labeling settings, it remains today quite complex to store custom data.

For instance, moving a simple label using the label toolbar is not straightforward, that wonderful toolbar remains desperately greyed-out for manual labeling tweaks

…unless you do the following:

  • Set your vector layer editable (yes, it’s not possible with readonly data)
  • Add two columns in your data
  • Link the X property position to a column and the Y position to another


the Move Label map tool becomes available and ready to be used (while your layer is editable). Then, if you move a label, the underlying data is modified to store the position. But what happened if you want to fully use the Change Label map tool (color, size, style, and so on)?


Well… You just have to add a new column for each property you want to manage. No need to tell you that it’s not very convenient to use or even impossible when your data administrator has set your data in readonly mode…

A plugin, made some years ago named EasyCustomLabeling was made to address that issue. But it kept being full of caveats, like a dependency to another plugin (Memory layer saver) for persistence, or a full copy of the layer to label inside a memory layer which indeed led to loose synchronisation with the source layer.

Two years ago, the French Agence de l’eau Adour Garonne (a water basin agency) and the Ministry in charge of Ecology asked Oslandia to think out QGIS Enhancement proposals to port that plugin into QGIS core, among a few other things like labeling connectors or curved labels enhancements.

Those QEPs were accepted and we could work on the real implementation, so here we are, Auxiliary storage has now landed in master!

How

The aim of auxiliary storage is to propose a more integrated solution to manage these data defined properties :

  • Easy to use (one click)
  • Transparent for the user (map tools always available by default when labeling is activated)
  • Do not update the underlying data (it should work even when the layer is not editable)
  • Keep in sync with the datasource (as much as possible)
  • Store this data along or inside the project file

As said above, thanks to the Auxiliary Storage mechanism, map tools like Move Label, Rotate Label or Change Label are available by default. Then, when the user select the map tool to move a label and click for the first time on the map, a simple question is asked allowing to select a primary key :

Primary key choice dialog – (YES, you NEED a primary key for any data management)

From that moment on, a hidden table is transparently created to store all data defined values (positions, rotations, …) and joined to the original layer thanks to the primary key previously selected. When you move a label, the corresponding property is automatically created in the auxiliary layer. This way, the original data is not modified but only the joined auxiliary layer!

A new tab has been added in vector layer properties to manage the Auxiliary Storage mechanism. You can retrieve, clean up, export or create new properties from there :

Where the auxiliary data is really saved between projects?

We end up in using a light SQLite database which, by default, is just 8 Ko! When you save your project with the usual extension .qgs, the SQLite database is saved at the same location but with a different extension : .qgd.

Two thoughts with that choice: 

  • “Hey, I would like to store geometries, why no spatialite instead? “

Good point. We tried that at start in fact. But spatialite database initializing process using QGIS spatialite provider was found too long, really long. And a raw spatialite table weight about 4 Mo, because of the huge spatial reference system table, the numerous spatial functions and metadata tables. We chose to fall back onto using sqlite through OGR provider and it proved to be fast and stable enough. If some day, we achieve in merging spatialite provider and GDAL-OGR spatialite provider, with options to only create necessary SRS and functions, that would open news possibilities, like storing spatial auxiliary data.

  • “Does that mean that when you want to move/share a QGIS project, you have to manually manage these 2 files to keep them in the same location?!”

True, and dangerous isn’t it? Users often forgot auxiliary files with EasyCustomLabeling plugin.  Hence, we created a new format allowing to zip several files : .qgz.  Using that format, the SQLite database project.qgd and the regular project.qgs file will be embedded in a single project.zip file. WIN!!

Changing the project file format so that it can embed, data, fonts, svg was a long standing feature. So now we have a format available for self hosted QGIS project. Plugins like offline editing, Qconsolidate and other similar that aim at making it easy to export a portable GIS database could take profit of that new storage container.

Now, some work remains to add labeling connectors capabilities,  allow user to draw labeling paths by hand. If you’re interested in making this happen, please contact us!


More information

A full video showing auxiliary storage capabilities:


QEP: https://github.com/qgis/QGIS-Enhancement-Proposals/issues/27

PR New Zip format: https://github.com/qgis/QGIS/pull/4845

PR Editable Joined layers: https://github.com/qgis/QGIS/pull/4913

PR Auxiliary Storage: https://github.com/qgis/QGIS/pull/5086

Back to Top

Sustaining Members