QGIS Planet

Hack to adjust map symbols location in QGIS

EN | PT

Now and then I get too many map symbols (points) in the same place, and I thought how nice it would be if we could drag n’ drop them around without messing with their geometries position, just like we do with labels. That thought gave me an idea for a cool hack.

Choose your point layer and start by creating two new fields called symbX and symbY (Type: Decimal number; Size: 20; Precision: 5). Now go the layer properties and in the Style tab edit your symbol. For each level of your symbol select “map units” as the offset units, and set the following expression in the offset data define properties option:


CASE WHEN symbX IS NOT NULL AND symbY IS NOT NULL THEN
    tostring($x - symbX) + ',' + tostring($y - symbY)
ELSE
    '0,0'
END

Screenshot from 2015-02-22 18:18:43

Be aware that, if your coordinates have negative values, you need to adapt the code. E.g., If you have negative values in X you should use “tostring(symbX -$x)” instead.

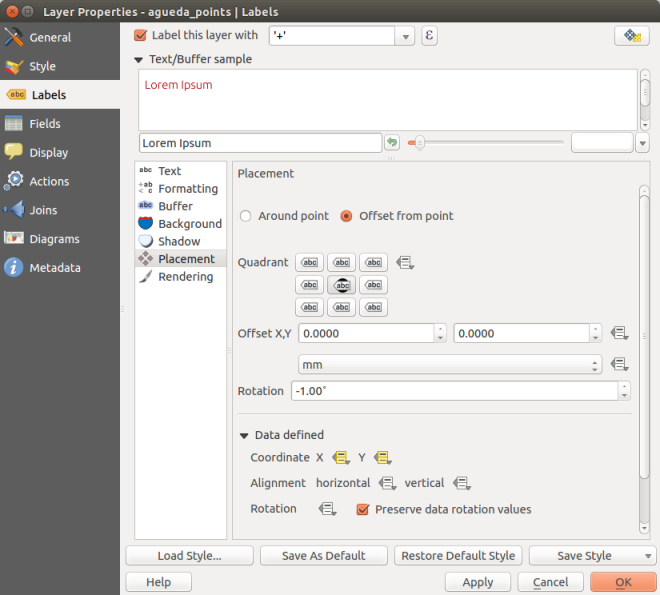
Now, temporarly  label your layer with a small convenient text (I used a centered ‘+’ (plus sign) with a white buffer) and set its coordinates to data defined using the symbX and symbY Fields.

Screenshot from 2015-02-22 22:42:07

From this point on, when you use the move label tool, not only the label position change but also the actual symbol! Pretty cool, isn’t it?

anim

Notice that the features geometries are not changed during the process. Also, remember that in this case you can also add leading lines to connect the symbols to the original position of the points.

Labels leading lines with QGIS and Postgis

EN | PT

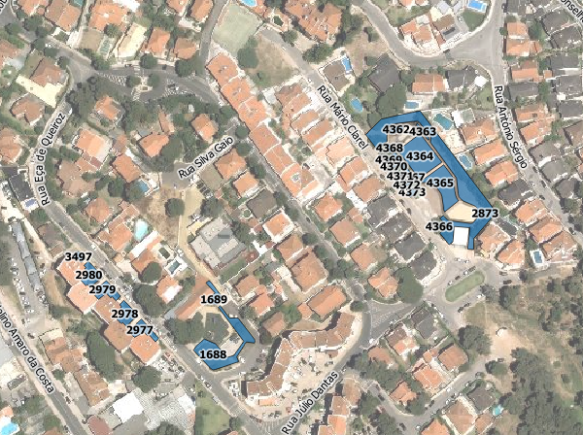
Recently I had the need to add labels to features with very close geometries, resulting in their collision.

Capturar_3

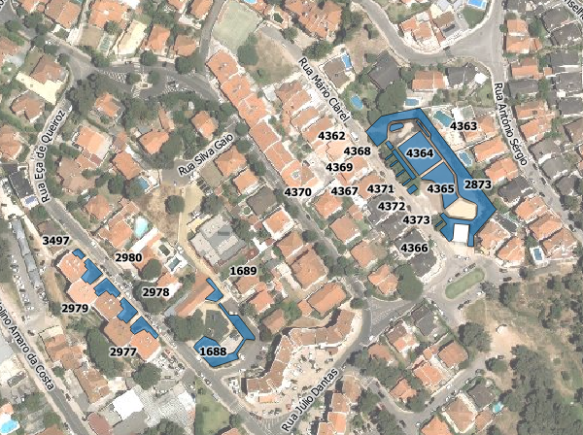
Using data-defined override for label’s position (I have used layer to labeled layer plugin to set this really fast) and the QGIS tool to move labels, it was quite easy to relocate them to better places. However, in same cases, it was difficult to understand to which geometry they belonged.

Capturar_2

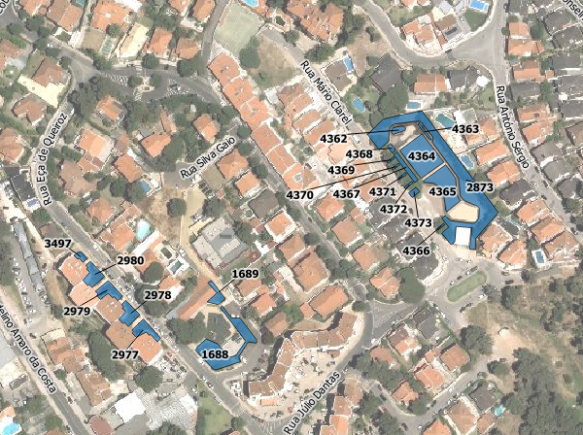
I needed some kind of leading lines to connect, whenever necessary, label and feature. I knew another great plugin called “Easy Custom Labeling“, by Regis Haubourg, that did what I needed, but it would create a memory duplicate of the original layer, wish meant that any edition on the original layer wouldn’t be updated in the labels.

Since the data were stored in a PostgreSQL/Postgis database, I have decided to create a query that would return a layer with leading lines. I used the following query in DB manager:

SELECT
  gid,
  label,
  ST_Makeline(St_setSRID(ST_PointOnSurface(geom),27493), St_setSRID(St_Point(x_label::numeric, y_label::numeric),27493))
FROM
  epvu.sgev
WHERE
  x_label IS NOT NULL AND
  y_label IS NOT NULL AND
  NOT ST_Within(ST_Makeline(St_setSRID(ST_PointOnSurface(geom),27493), St_setSRID(St_Point(x_label::numeric, y_label::numeric),27493)),geom))

This query creates a line by using the feature centroid as starting point and the label coordinate as end point. The last condition on the WHERE statement assures that the lines are only created for labels outside the feature.

Capturar_1

With the resulting layer loaded in my project, all I need is to move my labels and save the edition (and press refresh) to show a nice leading line.

guidelines

Multiple format map series using QGIS 2.6 – Part 1

EN | PT

As always, the new QGIS version (QGIS 2.6 Brigthon) brings a vast new set of features that will allow the user to do more, better and faster than with the earlier version. One of this features is the ability to control some of the composer’s items properties with data (for instance, size and position). Something that will allow lots of new interesting usages. In the next posts, I propose to show how to create map series with multiple formats.

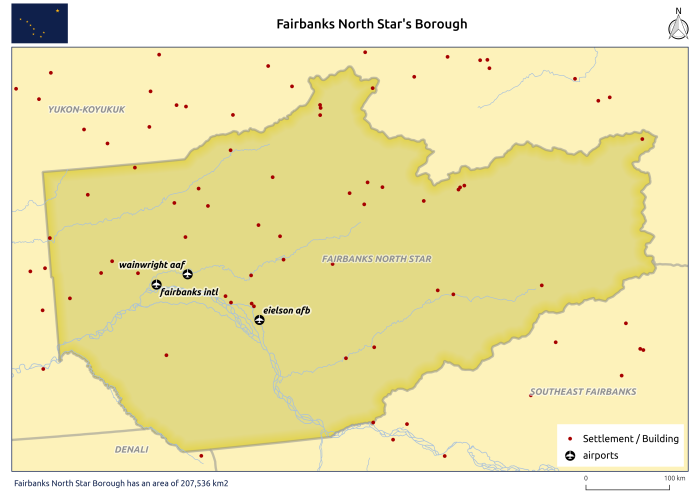
In this first post, the goal is that, keeping the page size, the map is created with the most suitable orientation (landscape or portrait) to fit the atlas feature. To exemplify, I will be using the Alaska’s sample dataset to create a map for each of Alaska’s regions.

I have started by creating the layout in one of the formats, putting the items in the desired positions.

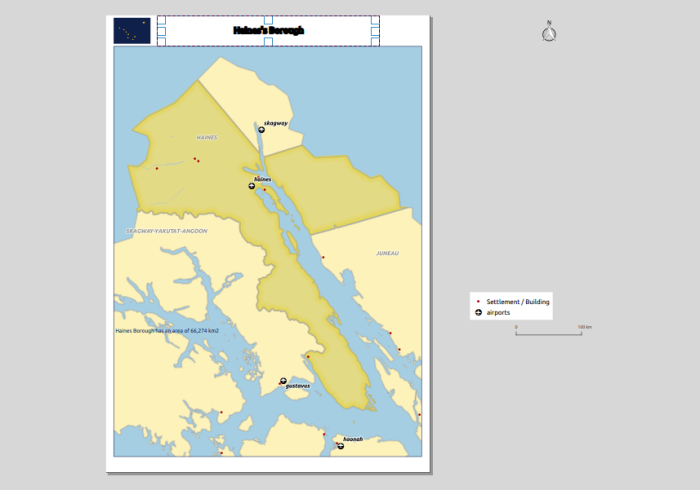
mapa_base_atlas

To control the page orientation with the atlas feature, in the composition tab, I used the following expression in the orientation data defined properties:

CASE WHEN bounds_width( $atlasgeometry ) >=  bounds_height( $atlasgeometry ) THEN 'landscape' ELSE 'portrait' END

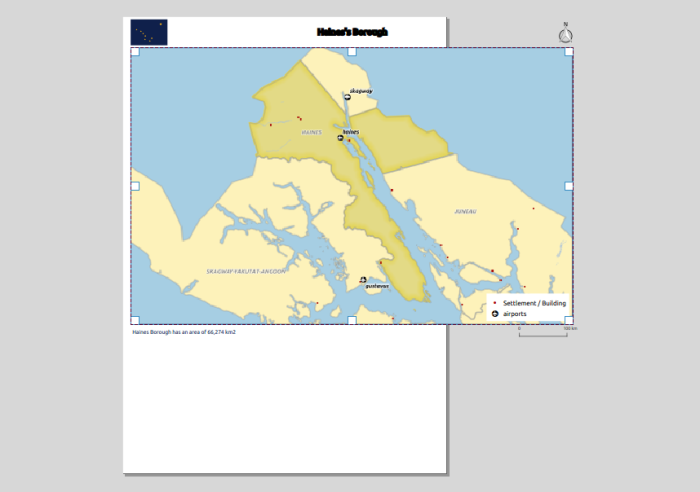
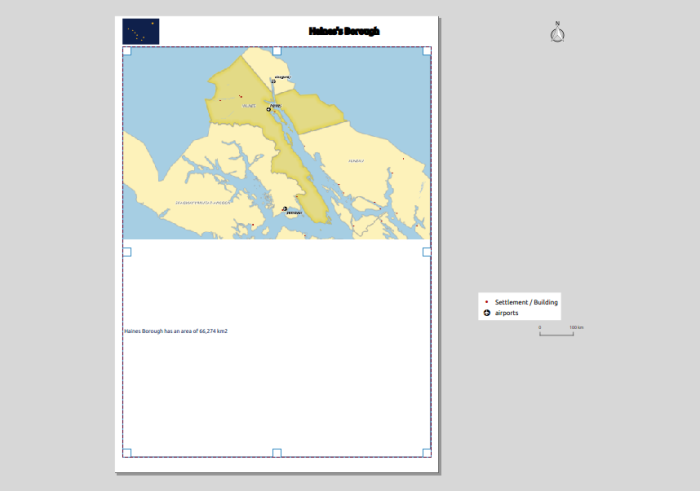
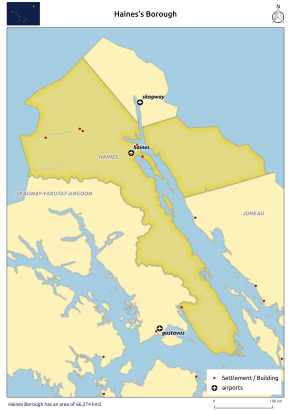
Using the atlas preview, I could verify that the page’s orientation changed according to the form of the atlas feature. However, the composition’s items did not follow this change and some got even outside the printing area

Screenshot from 2014-11-08 23:29:49

To control both size and position of the composition’s items I had in consideration the A4 page size (297 x 210 mm), the map margins ( 20 mm, 5 mm, 10 mm, 5 mm) and the item’s reference points.

For the map item, using the upper left corner as reference point, it was necessary to change it’s height and width. I knew that the item height was the subtraction of the top and bottom margins (30 mm) from the page height, therefore I used the following expression:

(CASE WHEN  bounds_width(  $atlasgeometry ) >=  bounds_height( $atlasgeometry) THEN 297 ELSE 210 END) - 30

Likewise, the expression to use in the width was:

(CASE WHEN  bounds_width(  $atlasgeometry ) >=  bounds_height( $atlasgeometry) THEN 210 ELSE 297 END) - 10

Screenshot from 2014-11-09 00:02:15

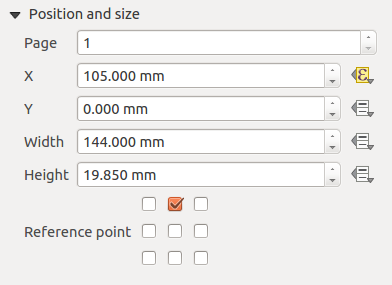
The rest of the items were always at a relative position of the page without the need to change their size and therefore only needed to control their position. For example, the title was centered at the page’s top, and therefore, using the top-center as reference point, all that was needed was the following expression for the X position:

Screenshot from 2014-11-09 00:13:17

(CASE WHEN  bounds_width(  $atlasgeometry ) >=  bounds_height( $atlasgeometry)  THEN 297 ELSE 210 END)  / 2.0

Screenshot from 2014-11-09 00:30:57

On the other hand, the legend needed to change the position in both X and Y. Using the bottom-right-corner as reference point, the X position expression was:

(CASE WHEN  bounds_width(  $atlasgeometry ) >=  bounds_height( $atlasgeometry) THEN 297 ELSE 210 END) - 7

And for the Y position:

(CASE WHEN  bounds_width(  $atlasgeometry ) >=  bounds_height( $atlasgeometry) THEN 210 ELSE 297 END) - 12

Screenshot from 2014-11-09 00:47:28

For the remaining items (North arrow, scalebar, and bottom left text), the expression were similar to the ones already mentioned, and, after setting them for each item, I got a layout that would adapt to both page orientation.

output_9

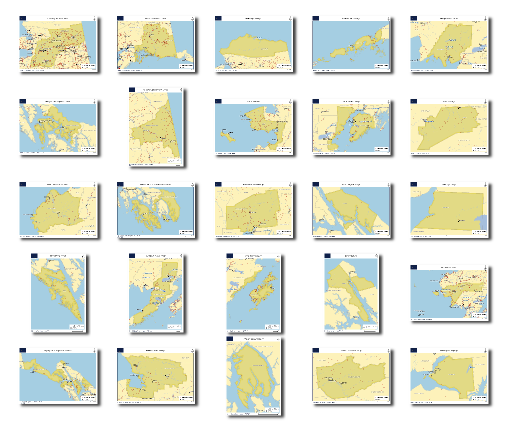
From that point, printing/exporting all (25) maps was one click away.

mosaico_regioes

In the next post of the series, I will try to explain how to create map series where it’s the size of the page that change to keep the scale’s value of the scale constant.

Map corner coordinates in QGIS

EN | PT

Some time ago in the qgis-pt mailing list, someone asked how to show the coordinates of a map corners using QGIS. Since this features wasn’t available (yet), I have tried to reach a automatic solution, but without success,  After some thought about it and after reading a blog post by Nathan Woodrow, it came to me that the solution could be creating a user defined function for the expression builder to be used in labels in the map.

Closely following the blog post instructions, I have created a file called userfunctions.py in the  .qgis2/python folder and, with a help from Nyall Dawson I wrote the following code.

from qgis.utils import qgsfunction, iface
from qgis.core import QGis

@qgsfunction(2,"python")
def map_x_min(values, feature, parent):
 """
 Returns the minimum x coordinate of a map from
 a specific composer.
 """
 composer_title = values[0]
 map_id = values[1]
 composers = iface.activeComposers()
 for composer_view in composers():
  composer_window = composer_view.composerWindow()
  window_title = composer_window.windowTitle()
  if window_title == composer_title:
   composition = composer_view.composition()
   map = composition.getComposerMapById(map_id)
   if map:
    extent = map.currentMapExtent()
    break
 result = extent.xMinimum()
 return result

After running the command import userfunctions in the python console  (Plugins > Python Console), it was already possible to use the  map_x_min() function (from the python category) in an expression to get the minimum X value of the map.

Screenshot from 2014-09-09 16^%29^%29

All I needed now was to create the other three functions,  map_x_max(), map_y_min() and map_y_max().  Since part of the code would be repeated, I have decided to put it in a function called map_bound(), that would use the print composer title and map id as arguments, and return the map extent (in the form of a QgsRectangle).

from qgis.utils import qgsfunction, iface
from qgis.core import QGis

def map_bounds(composer_title, map_id):
 """
 Returns a rectangle with the bounds of a map
 from a specific composer
 """
 composers = iface.activeComposers()
 for composer_view in composers:
  composer_window = composer_view.composerWindow()
  window_title = composer_window.windowTitle()
  if window_title == composer_title:
   composition = composer_view.composition()
   map = composition.getComposerMapById(map_id)
   if map:
    extent = map.currentMapExtent()
    break
 else:
  extent = None

 return extent

With this function available, I could now use it in the other functions to obtain the map X and Y minimum and maximum values, making the code more clear and easy to maintain. I also add some mechanisms to the original code to prevent errors.

@qgsfunction(2,"python")
def map_x_min(values, feature, parent):
 """
 Returns the minimum x coordinate of a map from a specific composer.
 Calculations are in the Spatial Reference System of the project.
<h2>Syntax</h2>
map_x_min(composer_title, map_id)
<h2>Arguments</h2>
composer_title - is string. The title of the composer where the map is.
 map_id - integer. The id of the map.
<h2>Example</h2>
map_x_min('my pretty map', 0) -> -12345.679

 """
 composer_title = values[0]
 map_id = values[1]
 map_extent = map_bounds(composer_title, map_id)
 if map_extent:
  result = map_extent.xMinimum()
 else:
  result = None

 return result

@qgsfunction(2,"python")
def map_x_max(values, feature, parent):
 """
 Returns the maximum x coordinate of a map from a specific composer.
 Calculations are in the Spatial Reference System of the project.
<h2>Syntax</h2>
map_x_max(composer_title, map_id)
<h2>Arguments</h2>
composer_title - is string. The title of the composer where the map is.
 map_id - integer. The id of the map.
<h2>Example</h2>
map_x_max('my pretty map', 0) -> 12345.679

 """
 composer_title = values[0]
 map_id = values[1]
 map_extent = map_bounds(composer_title, map_id)
 if map_extent:
  result = map_extent.xMaximum()
 else:
  result = None

 return result

@qgsfunction(2,"python")
def map_y_min(values, feature, parent):
 """
 Returns the minimum y coordinate of a map from a specific composer.
 Calculations are in the Spatial Reference System of the project.
<h2>Syntax</h2>
map_y_min(composer_title, map_id)
<h2>Arguments</h2>
composer_title - is string. The title of the composer where the map is.
 map_id - integer. The id of the map.
<h2>Example</h2>
map_y_min('my pretty map', 0) -> -12345.679

 """
 composer_title = values[0]
 map_id = values[1]
 map_extent = map_bounds(composer_title, map_id)
 if map_extent:
  result = map_extent.yMinimum()
 else:
  result = None

 return result

@qgsfunction(2,"python")
def map_y_max(values, feature, parent):
 """
 Returns the maximum y coordinate of a map from a specific composer.
 Calculations are in the Spatial Reference System of the project.
<h2>Syntax</h2>
map_y_max(composer_title, map_id)
<h2>Arguments</h2>
composer_title - is string. The title of the composer where the map is.
 map_id - integer. The id of the map.
<h2>Example</h2>
map_y_max('my pretty map', 0) -> 12345.679

 """
 composer_title = values[0]
 map_id = values[1]
 map_extent = map_bounds(composer_title, map_id)
 if map_extent:
  result = map_extent.yMaximum()
 else:
  result = None

 return result

The functions became available to the expression builder in the “Python” category (could have been any other name) and the functions descriptions are formatted as help texts to provide the user all the information needed to use them.

Screenshot from 2014-09-09 15^%39^%19

Using the created functions, it was now easy to put the corner coordinates in labels near the map corners. Any change to the map extents is reflected in the label, therefore quite useful to use with the atlas mode.

Screenshot from 2014-09-09 15^%40^%27

The functions result can be used with other functions. In the following image, there is an expression to show the coordinates in a more compact way.
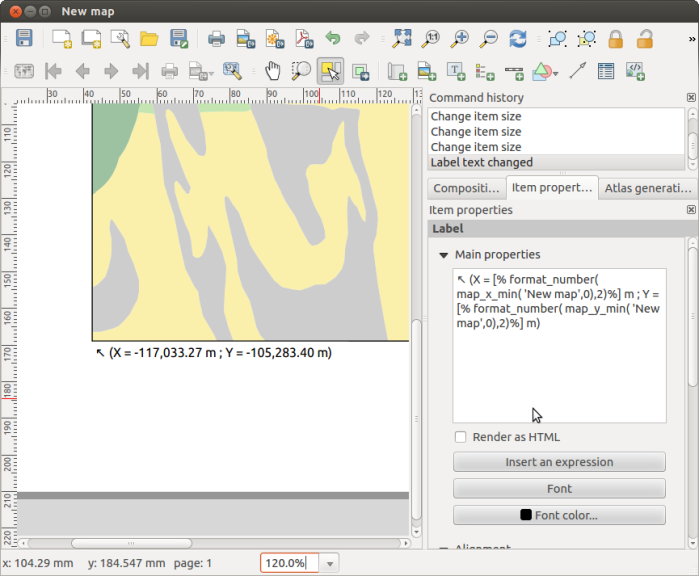
Screenshot from 2014-09-09 15^%43^%55

There was a setback… For the functions to become available, it was necessary to manually import them in each QGIS session. Not very practical. Again with Nathan’s help, I found out that it’s possible to import python modules at QGIS startup by putting a startup.py file with the import statements in the .qgis2/python folder. In my case, this was enough.

import userfunctions

I was pretty satisfied with the end result. The ability to create your own functions in expressions demonstrates once more how easy it is to customize QGIS and create your own tools. I’m already thinking in more applications for this amazing functionality.
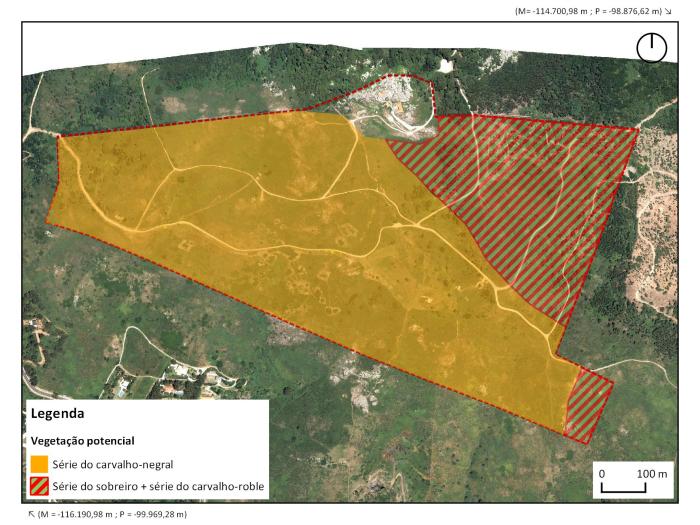
UT 9 - Qta da Peninha - Vegetação potencial

You can download the Python files with the functions HERE. Just unzip both files to the .qgis2/python folder, and restart QGIS, and the functions should become available.

Disclaimer: I’m not an English native speaker, therefore I apologize for any errors, and I will thank any advice on how to improve the text.

Back to Top

Sustaining Members