


Multiple format map series using QGIS 2.6 – Part 2
EN | PT
In my last post, I have tried to show how I used QGIS 2.6 to create a map series where the page’s orientation adapted to the shape of the atlas features. This method is useful when the final scale of the maps is irrelevant, or when the size of the atlas elements is similar, allowing one to use a fixed scale. On the other hand, when using a fixed scale is mandatory and the features size are too different, it is needed to change the size of the paper. In this second part ot the post, I will try to show how I came to a solution for that.
As a base, I used the map created in the previous post, from which I did a duplicate. To exemplify the method, I tried to create a map series at 1:2.000.000 scale. Since I was going to change both width and height of the paper, I did not need to set an orientation, and therefore, I deactivated the data defined properties of the orientation option:
ith some maths with the map scale, the size of the atlas feature and the already defined margins, I came up with the following expressions to use, respectively, in width and height:
((bounds_width( $atlasgeometry ) / 2000000.0) * 1000.0) * 1.1 + 10
((bounds_height( $atlasgeometry ) / 2000000.0) * 1000.0) * 1.1 + 30
Allow me to clarify. (bounds_width( $atlasgeometry ) / 2000000.0) is the atlas feature’s width in meters when represented at 1:2.000.000. This is multiplied by 1000 to convert it to millimeters (the composer’s settings units). In order to keep the atlas feature not to close to the margin, I have decided to add 10% of margin around it, hence the multiplication by 1.1. To finish I add the map margins value that were already set in the previous post (i.e.,20 mm, 5 mm, 10 mm, 5 mm)
As one can see from the previous image, after setting the expressions in the paper width and height options, it’s size already changed according to the size of the atlas features. But, as expected, all the itens stubbornly kept their positions.For that reason, it has been necessary to change the size and position expressions for each of then.
Starting by the map item size, the expressions to use in width and height were not difficult to understand since they would be the paper size without the margins size:
((bounds_width( $atlasgeometry ) / 2000000.0) * 1000.0) * 1.1
((bounds_height( $atlasgeometry ) / 2000000.0) * 1000.0) * 1.1

To position the items correctly, all was needed was to replace the “CASE WHEN … THEN … END” statement by the expressions defined before. For instance, the expressions used in the X and Y options for the legend position:
(CASE WHEN bounds_width( $atlasgeometry ) >= bounds_height( $atlasgeometry) THEN 297 ELSE 210 END) - 7
(CASE WHEN bounds_width( $atlasgeometry ) >= bounds_height( $atlasgeometry) THEN 210 ELSE 297 END) - 12
Became, respectively:
(((bounds_width( $atlasgeometry ) / 2000000.0) * 1000.0) * 1.1 + 10) - 7
(((bounds_height( $atlasgeometry ) / 2000000.0) * 1000.0) * 1.1 + 30) - 12

Changing the expressions of the X and Y position options for the remaining composer’s items I have reached the final layout.

Once again, printing/exporting all (25) maps was only one click away.
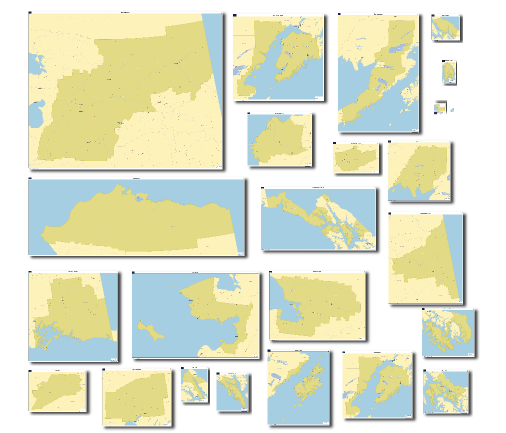
Since QGIS allows exporting the composer as georeferenced images, opening all maps in QGIS I got this interesting result.
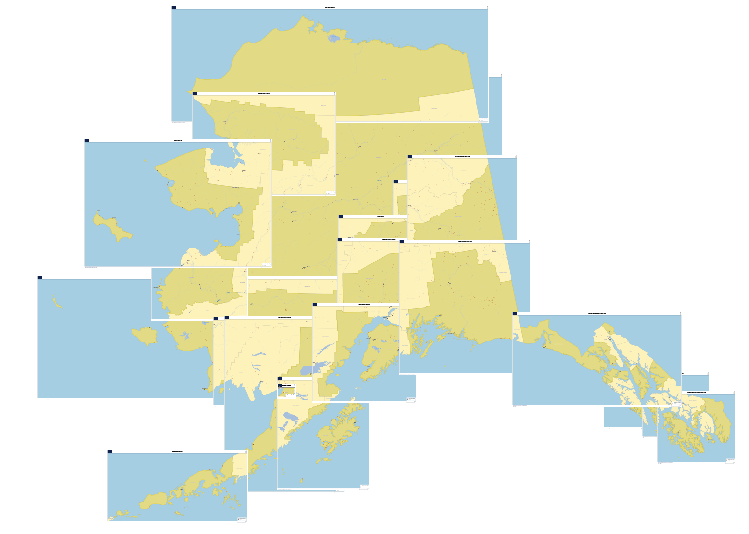
As one can see by the results, using this method, we can get some quite strange formats. That is why in the 3rd and last post of this article, I will try to show how to create a fixed scale map series using standard paper formats (A4, A3, A2, A1 e A0).
Disclaimer: I’m not an English native speaker, therefore I apologize for any errors, and I will thank any advice on how to improve the text.
