Related Plugins and Tags

QGIS Planet

Like the super handy Atlas QGIS plugin? Want to see it as a core part of QGIS?

Atlas is a super handy little QGIS plugin that lets you generate a map series from a composer and a coverage (grid) layer.

http://www.oslandia.com/tech/wp-content/uploads/2012/01/atlas_main.png

http://www.oslandia.com/tech/wp-content/uploads/2012/01/image_results.png

The authors of the plugin are now looking for some funding to make it a core part of QGIS.  Making it part of QGIS would mean integration into the composer and maybe APIs for developers to add extensions.

The authors are looking at raising 7000€ in order top get the work done, but the more money raised the more features that are added.

More information can be found at http://www.oslandia.com/?p=1243

Like the super handy Atlas QGIS plugin? Want to see it as a core part of QGIS?

  • Open Source
  • qgis tags:
  • FOSSGIS
  • Open Source
  • osgeo
  • qgis
  • Quantum GIS

Atlas is a super handy little QGIS plugin that lets you generate a map series from a composer and a coverage (grid) layer.

Alt Text

Alt Text

The authors of the plugin are now looking for some funding to make it a core part of QGIS.  Making it part of QGIS would mean integration into the composer and maybe APIs for developers to add extensions.

The authors are looking at raising 7000€ in order top get the work done, but the more money raised the more features that are added.

More information can be found at http://www.oslandia.com/?p=1243

Better date and time support in QGIS expressions and styles

Version note: This will only work in the latest dev build of QGIS - not in 1.8

The lack of uni for the next couple of weeks has left me some time at night to work on some features that I really wish QGIS had.  One of these features was better date and time support in the expression engine.  Date and time is an important concept when working on inspection data and not being able to style my features in QGIS using date operations was bugging me.  So in good open source fashion I added some.

Here are the current functions (more to come in the future):

  • $now - returns the current date and time
  • age({datetime},{datetime}) - returns the difference between the two dates
  • todate({string}) - converts a string to date type
  • totime({string}) - converts a string to time type
  • tointerval({string}) - converts a string to a interval type (details below)
  • day**({datetime} or {interval}) - returns the day from a datetime type or the number of days in a interval._
  • hour**(...) - Same as above but for hours
  • minute**(...) - Same as above but for minutes
  • second**(...) - Same as above but for seconds
  • day**(..) - Same as above but for days
  • week**(..) - Same as above but for weeks
  • month**(...) - Same as above but for months
  • year**(...) - Same as above but for years
  • {datetime} - {interval} = {new datetime} - returns a new datetime subtracting the interval _
  • {datetime} + {interval} = {new datetime} - returns a new datetime adding the interval

The interval type

Functions like age(..),tointerval__(), {datetime} -/+ {interval}, day(..), hour(..), etc, use, or return, Intervals.  An Interval is a measure of time that we can use for different things.  An example of an Interval is '1 Year 2 Months' this is then converted to a number of seconds and used for any calculations.

For example one can take away 10 days from the current date by doing the following ( -> marks the output ):

todate($now - '10 Days')
-> 2012-06-20

as

todate($now)
-> 2012-06-30

We can also do something like:

todate($now + '2 Years 1 Month 10 Days')
-> 2014-08-10

The age() function will return an interval which we can use extract what information we need.

The number of days between two dates:

day(age('2012-06-30', '2012-06-10'))
-> 20
-- Think of it as '2012-06-30' - '2012-06-10'
-- Note: day(), month(), etc, functions return doubles so you can get
-- 21.135234 days if you are using date & time type rather than just date type
-- wrap the result in toint() to get a more sane output.

Day() will also work on a plain date:

day('2012-06-30')
-> 30

We can even get the number of seconds between two dates:

second(age('2012-06-30', '2012-06-10'))
-> 1728000

Currently the only date format supported is {year}-{month}-{day} as seen in the examples above. Shouldn't be too hard to add support to the todate(), todatetime(), totime() functions for giving it a pattern to use when converting the string e.g. dd-mm-YYYY, or something like that.

More on this fancy new stuff

When I wrote the new expression builder dialog a while ago I made it dynamic so that any new functions added to the expression engine will show up automatically.  So here they are:

We can also use these functions in the rule based rending, which is where the power really comes in.  Lets see something like that in action:

Should be pretty straight forward to understand. We are using the age() and day() functions to style the events that are older than 30 days, within 30 days, for today, or in the future.  We also check the year of the event using year() and year($now) to make sure we only see this years events, or style them differently depending on if they are last years events or in the future.

This is the result of the above rules:

I'm also using the date functions in the expression based labelling to label the features using the following expression:

CASE
WHEN year( "dateadded") < year($now) THEN
    'Last Year'
WHEN day(age("dateadded", $now)) < 0 THEN
    day(age("dateadded", todate($now))) || ' Days old'
ELSE
    day(age("dateadded", todate($now))) || ' Days to go'
END

Well that's it. Hope you find it handy in your day-to-day mapping. I know I will be using it a lot. Thanks to Martin and Jürgen for the code reviews during the process; venturing in an unknown part of the code base always makes me nervous but that is all part of learning, and sometimes you can make some pretty cool stuff. *Some other random notes: *The general idea has been modelled of how Postgres handles dates and times, it's not an exact copy but follows the same kind of ideas. The interval class also uses the same number of seconds for one year that postgres does so that we can be consistent with the output.

Better date and time support in QGIS expressions and styles

Version note: This will only work in the latest dev build of QGIS – not in 1.8

The lack of uni for the next couple of weeks has left me some time at night to work on some features that I really wish QGIS had.  One of these features was better date and time support in the expression engine.  Date and time is an important concept when working on inspection data and not being able to style my features in QGIS using date operations was bugging me.  So in good open source fashion I added some.

Here are the current functions (more to come in the future):

  • $nowreturns the current date and time
  • age({datetime},{datetime}) - returns the difference between the two dates
  • todate({string}) - converts a string to date type
  • totime({string}) – converts a string to time type
  • tointerval({string}) – converts a string to a interval type (details below)
  • day({datetime} or {interval}) – returns the day from a datetime type or the number of days in a interval.
  • hour(…) – Same as above but for hours
  • minute(…)  - Same as above but for minutes
  • second(…)  - Same as above but for seconds
  • day(..)  - Same as above but for days
  • week(..)  - Same as above but for weeks
  • month(…)  - Same as above but for months
  • year(…) - Same as above but for years
  • {datetime} – {interval} = {new datetime} – returns a new datetime subtracting the interval 
  • {datetime} + {interval} = {new datetime} – returns a new datetime adding the interval


The interval type

Functions like age(..), tointerval(), {datetime} -/+ {interval}, day(..), hour(..), etc, use, or return, Intervals.  An Interval is a measure of time that we can use for different things.  An example of an Interval is ’1 Year 2 Months’ this is then converted to a number of seconds and used for any calculations.

For example one can take away 10 days from the current date by doing the following ( -> marks the output ):

todate($now - '10 Days')
-> 2012-06-20

as

todate($now)
-> 2012-06-30

We can also do something like:

todate($now + '2 Years 1 Month 10 Days')
-> 2014-08-10

The age() function will return an interval which we can use extract what information we need.

The number of days between two dates:

day(age('2012-06-30', '2012-06-10'))
-> 20
-- Think of it as '2012-06-30' - '2012-06-10'
-- Note: day(), month(), etc, functions return doubles so you can get
-- 21.135234 days if you are using date & time type rather than just date type
-- wrap the result in toint() to get a more sane output.

Day() will also work on a plain date:

day('2012-06-30')
-> 30

We can even get the number of seconds between two dates:

second(age('2012-06-30', '2012-06-10'))
-> 1728000

Currently the only date format supported is {year}-{month}-{day} as seen in the examples above. Shouldn’t be too hard to add support to the todate(), todatetime(), totime() functions for giving it a pattern to use when converting the string e.g. dd-mm-YYYY, or something like that.

More on this fancy new stuff

When I wrote the new expression builder dialog a while ago I made it dynamic so that any new functions added to the expression engine will show up automatically.  So here they are:

List of new date and time functions.

We can also use these functions in the rule based rending, which is where the power really comes in.  Lets see something like that in action:

Styled using days and years

Should be pretty straight forward to understand. We are using the age() and day() functions to style the events that are older than 30 days, within 30 days, for today, or in the future.  We also check the year of the event using year() and year($now) to make sure we only see this years events, or style them differently depending on if they are last years events or in the future.

This is the result of the above rules:

Result of using date functions in rule based renderer

I’m also using the date functions in the expression based labelling to label the features using the following expression:

CASE
WHEN year( "dateadded") < year($now) THEN
	'Last Year'
WHEN day(age("dateadded", $now)) < 0 THEN
	day(age("dateadded", todate($now))) || ' Days old'
ELSE
	day(age("dateadded", todate($now))) || ' Days to go'
END

Well that’s it. Hope you find it handy in your day-to-day mapping. I know I will be using it a lot.
Thanks to Martin and Jürgen for the code reviews during the process; venturing in an unknown part of the code base always makes me nervous but that is all part of learning, and sometimes you can make some pretty cool stuff.
Some other random notes: The general idea has been modelled of how Postgres handles dates and times, it’s not an exact copy but follows the same kind of ideas. The interval class also uses the same number of seconds for one year that postgres does so that we can be consistent with the output.


Filed under: Open Source, qgis Tagged: FOSSGIS, gis, map-rendering, Open Source, osgeo, qgis, Quantum GIS, styling

Better date and time support in QGIS expressions and styles

  • Open Source
  • qgis tags:
  • FOSSGIS
  • gis
  • map-rendering
  • Open Source
  • osgeo
  • qgis
  • Quantum GIS
  • styling

Version note: This will only work in the latest dev build of QGIS - not in 1.8

The lack of uni for the next couple of weeks has left me some time at night to work on some features that I really wish QGIS had.  One of these features was better date and time support in the expression engine.  Date and time is an important concept when working on inspection data and not being able to style my features in QGIS using date operations was bugging me.  So in good open source fashion I added some.

Here are the current functions (more to come in the future):

  • $now - returns the current date and time
  • age({datetime},{datetime}) - returns the difference between the two dates
  • todate({string}) - converts a string to date type
  • totime({string}) - converts a string to time type
  • tointerval({string}) - converts a string to a interval type (details below)
  • day**({datetime} or {interval}) - returns the day from a datetime type or the number of days in a interval._
  • hour**(...) - Same as above but for hours
  • minute**(...) - Same as above but for minutes
  • second**(...) - Same as above but for seconds
  • day**(..) - Same as above but for days
  • week**(..) - Same as above but for weeks
  • month**(...) - Same as above but for months
  • year**(...) - Same as above but for years
  • {datetime} - {interval} = {new datetime} - returns a new datetime subtracting the interval _
  • {datetime} + {interval} = {new datetime} - returns a new datetime adding the interval

The interval type

Functions like age(..),tointerval__(), {datetime} -/+ {interval}, day(..), hour(..), etc, use, or return, Intervals.  An Interval is a measure of time that we can use for different things.  An example of an Interval is '1 Year 2 Months' this is then converted to a number of seconds and used for any calculations.

For example one can take away 10 days from the current date by doing the following ( -> marks the output ):

todate($now - '10 Days')
-> 2012-06-20

as

todate($now)
-> 2012-06-30

We can also do something like:

todate($now + '2 Years 1 Month 10 Days')
-> 2014-08-10

The age() function will return an interval which we can use extract what information we need.

The number of days between two dates:

day(age('2012-06-30', '2012-06-10'))
-> 20
-- Think of it as '2012-06-30' - '2012-06-10'
-- Note: day(), month(), etc, functions return doubles so you can get
-- 21.135234 days if you are using date & time type rather than just date type
-- wrap the result in toint() to get a more sane output.

Day() will also work on a plain date:

day('2012-06-30')
-> 30

We can even get the number of seconds between two dates:

second(age('2012-06-30', '2012-06-10'))
-> 1728000

Currently the only date format supported is {year}-{month}-{day} as seen in the examples above. Shouldn't be too hard to add support to the todate(), todatetime(), totime() functions for giving it a pattern to use when converting the string e.g. dd-mm-YYYY, or something like that.

More on this fancy new stuff

When I wrote the new expression builder dialog a while ago I made it dynamic so that any new functions added to the expression engine will show up automatically.  So here they are:

We can also use these functions in the rule based rending, which is where the power really comes in.  Lets see something like that in action:

Should be pretty straight forward to understand. We are using the age() and day() functions to style the events that are older than 30 days, within 30 days, for today, or in the future.  We also check the year of the event using year() and year($now) to make sure we only see this years events, or style them differently depending on if they are last years events or in the future.

This is the result of the above rules:

I'm also using the date functions in the expression based labelling to label the features using the following expression:

CASE
WHEN year( "dateadded") < year($now) THEN
    'Last Year'
WHEN day(age("dateadded", $now)) < 0 THEN
    day(age("dateadded", todate($now))) || ' Days old'
ELSE
    day(age("dateadded", todate($now))) || ' Days to go'
END

Well that's it. Hope you find it handy in your day-to-day mapping. I know I will be using it a lot. Thanks to Martin and Jürgen for the code reviews during the process; venturing in an unknown part of the code base always makes me nervous but that is all part of learning, and sometimes you can make some pretty cool stuff. Some other random notes: The general idea has been modelled of how Postgres handles dates and times, it's not an exact copy but follows the same kind of ideas. The interval class also uses the same number of seconds for one year that postgres does so that we can be consistent with the output.

Better date and time support in QGIS expressions and styles

Version note: This will only work in the latest dev build of QGIS - not in 1.8

The lack of uni for the next couple of weeks has left me some time at night to work on some features that I really wish QGIS had.  One of these features was better date and time support in the expression engine.  Date and time is an important concept when working on inspection data and not being able to style my features in QGIS using date operations was bugging me.  So in good open source fashion I added some.

Here are the current functions (more to come in the future):

  • $now - returns the current date and time
  • age({datetime},{datetime}) - returns the difference between the two dates
  • todate({string}) - converts a string to date type
  • totime({string}) - converts a string to time type
  • tointerval({string}) - converts a string to a interval type (details below)
  • day**({datetime} or {interval}) - returns the day from a datetime type or the number of days in a interval._
  • hour**(...) - Same as above but for hours
  • minute**(...) - Same as above but for minutes
  • second**(...) - Same as above but for seconds
  • day**(..) - Same as above but for days
  • week**(..) - Same as above but for weeks
  • month**(...) - Same as above but for months
  • year**(...) - Same as above but for years
  • {datetime} - {interval} = {new datetime} - returns a new datetime subtracting the interval _
  • {datetime} + {interval} = {new datetime} - returns a new datetime adding the interval

The interval type

Functions like age(..),tointerval__(), {datetime} -/+ {interval}, day(..), hour(..), etc, use, or return, Intervals.  An Interval is a measure of time that we can use for different things.  An example of an Interval is '1 Year 2 Months' this is then converted to a number of seconds and used for any calculations.

For example one can take away 10 days from the current date by doing the following ( -> marks the output ):

todate($now - '10 Days')
-> 2012-06-20

as

todate($now)
-> 2012-06-30

We can also do something like:

todate($now + '2 Years 1 Month 10 Days')
-> 2014-08-10

The age() function will return an interval which we can use extract what information we need.

The number of days between two dates:

day(age('2012-06-30', '2012-06-10'))
-> 20
-- Think of it as '2012-06-30' - '2012-06-10'
-- Note: day(), month(), etc, functions return doubles so you can get
-- 21.135234 days if you are using date & time type rather than just date type
-- wrap the result in toint() to get a more sane output.

Day() will also work on a plain date:

day('2012-06-30')
-> 30

We can even get the number of seconds between two dates:

second(age('2012-06-30', '2012-06-10'))
-> 1728000

Currently the only date format supported is {year}-{month}-{day} as seen in the examples above. Shouldn't be too hard to add support to the todate(), todatetime(), totime() functions for giving it a pattern to use when converting the string e.g. dd-mm-YYYY, or something like that.

More on this fancy new stuff

When I wrote the new expression builder dialog a while ago I made it dynamic so that any new functions added to the expression engine will show up automatically.  So here they are:

We can also use these functions in the rule based rending, which is where the power really comes in.  Lets see something like that in action:

Should be pretty straight forward to understand. We are using the age() and day() functions to style the events that are older than 30 days, within 30 days, for today, or in the future.  We also check the year of the event using year() and year($now) to make sure we only see this years events, or style them differently depending on if they are last years events or in the future.

This is the result of the above rules:

I'm also using the date functions in the expression based labelling to label the features using the following expression:

CASE
WHEN year( "dateadded") < year($now) THEN
    'Last Year'
WHEN day(age("dateadded", $now)) < 0 THEN
    day(age("dateadded", todate($now))) || ' Days old'
ELSE
    day(age("dateadded", todate($now))) || ' Days to go'
END

Well that's it. Hope you find it handy in your day-to-day mapping. I know I will be using it a lot. Thanks to Martin and Jürgen for the code reviews during the process; venturing in an unknown part of the code base always makes me nervous but that is all part of learning, and sometimes you can make some pretty cool stuff. *Some other random notes: *The general idea has been modelled of how Postgres handles dates and times, it's not an exact copy but follows the same kind of ideas. The interval class also uses the same number of seconds for one year that postgres does so that we can be consistent with the output.

Styling temporal (time) data in QGIS

So this years first uni semester is done and dusted, now I have some free time.  Blog all the things!

This is a follow up post for discussion that was started on LinkedIn about showing features older, or newer, then a certain date different colours   The main post was about using free, or low cost, solutions in order to aid in mapping water networks. I recommend that everyone watch it. A very good presentation.

I recommended that you could use the rule based rendering engine but the expression engine in QGIS doesn’t have any date functions yet.  All good we can add them if we need and once I get my head around the expression engine I plan on doing exactly that. But for now we can do it a different way.

We are going to use Spatialite, but any database will do (syntax and process will vary).

Lets have a look an inspection layer we have in our Spatialite database viewed in QGIS:

Pretty boring and hard to see what has been done in the last 30 days.  Now with the lack of support for dates in the expression engine we have to use another methods.  For this example we will use the really handy DBManger plugin that now ships with QGIS from 1.8.  Load it, connect to your database, and run the following query:

SELECT id,
              CASE WHEN DATE("date_checked") > DATE('now', '-30 days') THEN
                         'Within 30 Days'
              ELSE
                         'older'
              END as age, date_checked, geom
FROM  "inspections"

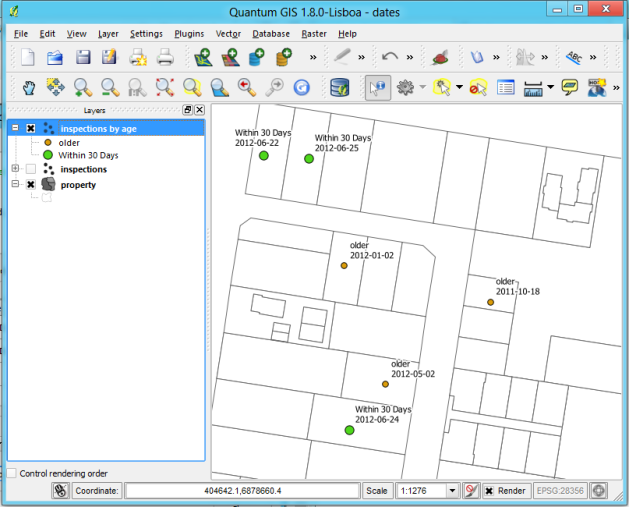
As you can see anything that is within the 30 days now has the “Within 30 Days” string in the age column, or else it has “older”.  CASE statements can be very powerful things in SQL sometimes.

Now load it into QGIS, style, and label it using the new age column

and Bob’s your uncle

You now have a layer that is style based on age but is also dynamic.  Adding a new inspection point will now will be styled according to those rules. (Although you will have to edit the normal inspection layer with it turned off as views/queries are not editable – without some setup anyway)

It might be a simple thing to some but sometimes it’s hard to find the right words to describe what you want when you are looking for this kind of thing. So hopefully this has helped a few people get started with visualizing their time/date based data in QGIS.

Happy mapping!


Filed under: Open Source, qgis Tagged: FOSSGIS, gis, Open Source, osgeo, qgis, Quantum GIS, styling

Styling temporal (time) data in QGIS

  • Open Source
  • qgis tags:
  • FOSSGIS
  • gis
  • Open Source
  • osgeo
  • qgis
  • Quantum GIS
  • styling

So this years first uni semester is done and dusted, now I have some free time.  Blog all the things!

This is a follow up post for discussion that was started on LinkedIn about showing features older, or newer, then a certain date different colours   The main post was about using free, or low cost, solutions in order to aid in mapping water networks. I recommend that everyone watch it. A very good presentation.

I recommended that you could use the rule based rendering engine but the expression engine in QGIS doesn't have any date functions yet.  All good we can add them if we need and once I get my head around the expression engine I plan on doing exactly that. But for now we can do it a different way.

We are going to use Spatialite, but any database will do (syntax and process will vary).

Lets have a look an inspection layer we have in our Spatialite database viewed in QGIS:

Pretty boring and hard to see what has been done in the last 30 days.  Now with the lack of support for dates in the expression engine we have to use another methods.  For this example we will use the really handy DBManger plugin that now ships with QGIS from 1.8.  Load it, connect to your database, and run the following query:

SELECT id,
              CASE WHEN DATE("date_checked") > DATE('now', '-30 days') THEN
                         'Within 30 Days'
              ELSE
                         'older'
              END as age, date_checked, geom
FROM  "inspections"

As you can see anything that is within the 30 days now has the "Within 30 Days" string in the age column, or else it has "older".  CASE statements can be very powerful things in SQL sometimes.

Now load it into QGIS, style, and label it using the new age column

and Bob's your uncle

You now have a layer that is style based on age but is also dynamic.  Adding a new inspection point will now will be styled according to those rules. (Although you will have to edit the normal inspection layer with it turned off as views/queries are not editable - without some setup anyway)

It might be a simple thing to some but sometimes it's hard to find the right words to describe what you want when you are looking for this kind of thing. So hopefully this has helped a few people get started with visualizing their time/date based data in QGIS.

Happy mapping!

Styling temporal (time) data in QGIS

So this years first uni semester is done and dusted, now I have some free time.  Blog all the things!

This is a follow up post for discussion that was started on LinkedIn about showing features older, or newer, then a certain date different colours   The main post was about using free, or low cost, solutions in order to aid in mapping water networks. I recommend that everyone watch it. A very good presentation.

I recommended that you could use the rule based rendering engine but the expression engine in QGIS doesn't have any date functions yet.  All good we can add them if we need and once I get my head around the expression engine I plan on doing exactly that. But for now we can do it a different way.

We are going to use Spatialite, but any database will do (syntax and process will vary).

Lets have a look an inspection layer we have in our Spatialite database viewed in QGIS:

Pretty boring and hard to see what has been done in the last 30 days.  Now with the lack of support for dates in the expression engine we have to use another methods.  For this example we will use the really handy DBManger plugin that now ships with QGIS from 1.8.  Load it, connect to your database, and run the following query:

SELECT id,
              CASE WHEN DATE("date_checked") > DATE('now', '-30 days') THEN
                         'Within 30 Days'
              ELSE
                         'older'
              END as age, date_checked, geom
FROM  "inspections"

As you can see anything that is within the 30 days now has the "Within 30 Days" string in the age column, or else it has "older".  CASE statements can be very powerful things in SQL sometimes.

Now load it into QGIS, style, and label it using the new age column

and Bob's your uncle

You now have a layer that is style based on age but is also dynamic.  Adding a new inspection point will now will be styled according to those rules. (Although you will have to edit the normal inspection layer with it turned off as views/queries are not editable - without some setup anyway)

It might be a simple thing to some but sometimes it's hard to find the right words to describe what you want when you are looking for this kind of thing. So hopefully this has helped a few people get started with visualizing their time/date based data in QGIS.

Happy mapping!

QGIS 1.8 is out!

After almost a year and a lot of hard work QGIS 1.8 is finally out.  This is the best QGIS version so far, packed full of fancy new features.

The official release notice can be found here: http://qgis.org/index.php?option=com_content&view=article&id=149 and downloads can be found at http://download.qgis.org

Here is the change log of all the new stuff in 1.8:

- QGIS Browser -_ a stand alone app and a new panel in QGIS. The_ browser lets you easily navigate your file system and connection based (PostGIS, WFS etc.) datasets, preview them and drag and drop items into the canvas. - DB Manager -_ the DB manager is now officially part of QGIS core. You_ can drag layers from the QGIS Browser into DB Manager and it will import your layer into your spatial database. Drag and drop tables between spatial databases and they will get imported. You can use the DB Manager to execute SQL queries against your spatial database and then view the spatial output for queries by adding the results to QGIS as a query layer. - Action Tool - now there is a tool on the map tools toolbar that will allow you to click on a vector feature and execute an action. - MSSQL Spatial Support - you can now connect to your Microsoft SQL Server spatial databases using QGIS. - Customization - allows setting up simplified QGIS interface by hiding various components of main window and widgets in dialogs. - New symbol layer types - Line Pattern Fill, Point Pattern fill - Composers - have multiple lines on legend items using a specified character - Expression based labelling - Heatmap tool - a new core plugin has been added for generating raster heatmaps from point data. You may need to activate this plugin using the plugin manager. - GPS Tracking - The GPS live tracking user interface was overhauled and many fixes and improvements were added to it. - Menu Re-organisation - The menus were re-organised a little - we now have separate menus for Vector and Raster and many plugins were updated to place their menus in the new Vector and Raster top level menus. - Offset Curves - a new digitising tool for creating offset curves was added. - Terrain Analysis Plugin - a new core plugin was added for doing terrain analysis - and it can make really good looking coloured relief maps. - Ellipse renderer - symbollayer to render ellipse shapes (and also rectangles, triangles, crosses by specifying width and height). Moreover, the symbol layer allows to set all parameters (width, height, colors, rotation, outline with) from data fields, in mm or map units - New scale selector with predefined scales - Option to add layers to selected or active group - Pan To Selected tool - New tools in Vector menu - densify geoemtries, Build spatial index - Export/add geometry column tool can export info using layer CRS, project CRS or ellipsoidal measurements - Model/view based tree for rules in rule-based renderer - Updated CRS selector dialog - Improvements in Spatial Bookmarks - Plugin metadata in metadata.txt - New plugin repository - Refactored postgres data provider: support for arbitrary key (including non-numeric and multi column), support for requesting a certain geometry type and/or srid in QgsDataSourceURI added gdalfillnodata to GDALTools plugin_ - Support for PostGIS TopoGeometry datatype - Python bindings for vector field symbollayer and general updates to the python bindings. - New message log window - Benchmark program - Row cache for attribute table - Legend independent drawing order - UUID generation widget for attribute table - Added support of editable views in SpatiaLite databases - Expression based widget in field calculator - Creation of event layers in analysis lib using linear referencing - Group selected layers option added to the TOC context menu - load/save layer style (new symbology) from/to SLD document - WFS support in QGIS Server - Option to skip WKT geometry when copying from attribute table - upport for zipped and gzipped layers - Test suite now passes all tests on major platforms and nightly tests - Copy and paste styles between layers - Set tile size for WMS layers - Support for nesting projects within other projects

Thanks to all the sponsors and everyone who put a lot of work into this release!

QGIS 1.8 is out!

After almost a year and a lot of hard work QGIS 1.8 is finally out.  This is the best QGIS version so far, packed full of fancy new features.

The official release notice can be found here: http://qgis.org/index.php?option=com_content&view=article&id=149 and downloads can be found at http://download.qgis.org

Here is the change log of all the new stuff in 1.8:

- QGIS Browser - a stand alone app and a new panel in QGIS. The
browser lets you easily navigate your file system and connection based
(PostGIS, WFS etc.) datasets, preview them and drag and drop items
into the canvas.
- DB Manager - the DB manager is now officially part of QGIS core. You
can drag layers from the QGIS Browser into DB Manager and it will
import your layer into your spatial database. Drag and drop tables
between spatial databases and they will get imported. You can use the
DB Manager to execute SQL queries against your spatial database and
then view the spatial output for queries by adding the results to QGIS
as a query layer.
- Action Tool - now there is a tool on the map tools toolbar that will
allow you to click on a vector feature and execute an action.
- MSSQL Spatial Support - you can now connect to your Microsoft SQL
Server spatial databases using QGIS.
- Customization - allows setting up simplified QGIS interface by
hiding various components of main window and widgets in dialogs.
- New symbol layer types - Line Pattern Fill, Point Pattern fill
- Composers - have multiple lines on legend items using a specified character
- Expression based labelling
- Heatmap tool - a new core plugin has been added for generating
raster heatmaps from point data. You may need to activate this plugin
using the plugin manager.
- GPS Tracking - The GPS live tracking user interface was overhauled
and many fixes and improvements were added to it.
- Menu Re-organisation - The menus were re-organised a little – we now
have separate menus for Vector and Raster and many plugins were
updated to place their menus in the new Vector and Raster top level
menus.
- Offset Curves - a new digitising tool for creating offset curves was added.
- Terrain Analysis Plugin - a new core plugin was added for doing
terrain analysis – and it can make really good looking coloured relief
maps.
- Ellipse renderer - symbollayer to render ellipse shapes (and also
rectangles, triangles, crosses by specifying width and height).
Moreover, the symbol layer allows to set all parameters (width,
height, colors, rotation, outline with) from data fields, in mm or map
units
- New scale selector with predefined scales
- Option to add layers to selected or active group
- Pan To Selected tool
- New tools in Vector menu - densify geoemtries, Build spatial index
- Export/add geometry column tool can export info using layer CRS,
project CRS or ellipsoidal measurements
- Model/view based tree for rules in rule-based renderer
- Updated CRS selector dialog
- Improvements in Spatial Bookmarks
- Plugin metadata in metadata.txt
- New plugin repository
- Refactored postgres data provider: support for arbitrary key
(including non-numeric and multi column), support for requesting a
certain geometry type and/or srid in QgsDataSourceURI
added gdal_fillnodata to GDALTools plugin
- Support for PostGIS TopoGeometry datatype
- Python bindings for vector field symbollayer and general updates to
the python bindings.
- New message log window
- Benchmark program
- Row cache for attribute table
- Legend independent drawing order
- UUID generation widget for attribute table
- Added support of editable views in SpatiaLite databases
- Expression based widget in field calculator
- Creation of event layers in analysis lib using linear referencing
- Group selected layers option added to the TOC context menu
- load/save layer style (new symbology) from/to SLD document
- WFS support in QGIS Server
- Option to skip WKT geometry when copying from attribute table
- upport for zipped and gzipped layers
- Test suite now passes all tests on major platforms and nightly tests
- Copy and paste styles between layers
- Set tile size for WMS layers
- Support for nesting projects within other projects

Thanks to all the sponsors and everyone who put a lot of work into this release!


Filed under: Open Source, qgis Tagged: Open Source, osgeo, qgis, Quantum GIS

QGIS 1.8 is out!

After almost a year and a lot of hard work QGIS 1.8 is finally out.  This is the best QGIS version so far, packed full of fancy new features.

The official release notice can be found here: http://qgis.org/index.php?option=com_content&view=article&id=149 and downloads can be found at http://download.qgis.org

Here is the change log of all the new stuff in 1.8:

- QGIS Browser -_ a stand alone app and a new panel in QGIS. The_ browser lets you easily navigate your file system and connection based (PostGIS, WFS etc.) datasets, preview them and drag and drop items into the canvas. - DB Manager -_ the DB manager is now officially part of QGIS core. You_ can drag layers from the QGIS Browser into DB Manager and it will import your layer into your spatial database. Drag and drop tables between spatial databases and they will get imported. You can use the DB Manager to execute SQL queries against your spatial database and then view the spatial output for queries by adding the results to QGIS as a query layer. - Action Tool - now there is a tool on the map tools toolbar that will allow you to click on a vector feature and execute an action. - MSSQL Spatial Support - you can now connect to your Microsoft SQL Server spatial databases using QGIS. - Customization - allows setting up simplified QGIS interface by hiding various components of main window and widgets in dialogs. - New symbol layer types - Line Pattern Fill, Point Pattern fill - Composers - have multiple lines on legend items using a specified character - Expression based labelling - Heatmap tool - a new core plugin has been added for generating raster heatmaps from point data. You may need to activate this plugin using the plugin manager. - GPS Tracking - The GPS live tracking user interface was overhauled and many fixes and improvements were added to it. - Menu Re-organisation - The menus were re-organised a little - we now have separate menus for Vector and Raster and many plugins were updated to place their menus in the new Vector and Raster top level menus. - Offset Curves - a new digitising tool for creating offset curves was added. - Terrain Analysis Plugin - a new core plugin was added for doing terrain analysis - and it can make really good looking coloured relief maps. - Ellipse renderer - symbollayer to render ellipse shapes (and also rectangles, triangles, crosses by specifying width and height). Moreover, the symbol layer allows to set all parameters (width, height, colors, rotation, outline with) from data fields, in mm or map units - New scale selector with predefined scales - Option to add layers to selected or active group - Pan To Selected tool - New tools in Vector menu - densify geoemtries, Build spatial index - Export/add geometry column tool can export info using layer CRS, project CRS or ellipsoidal measurements - Model/view based tree for rules in rule-based renderer - Updated CRS selector dialog - Improvements in Spatial Bookmarks - Plugin metadata in metadata.txt - New plugin repository - Refactored postgres data provider: support for arbitrary key (including non-numeric and multi column), support for requesting a certain geometry type and/or srid in QgsDataSourceURI added gdalfillnodata to GDALTools plugin_ - Support for PostGIS TopoGeometry datatype - Python bindings for vector field symbollayer and general updates to the python bindings. - New message log window - Benchmark program - Row cache for attribute table - Legend independent drawing order - UUID generation widget for attribute table - Added support of editable views in SpatiaLite databases - Expression based widget in field calculator - Creation of event layers in analysis lib using linear referencing - Group selected layers option added to the TOC context menu - load/save layer style (new symbology) from/to SLD document - WFS support in QGIS Server - Option to skip WKT geometry when copying from attribute table - upport for zipped and gzipped layers - Test suite now passes all tests on major platforms and nightly tests - Copy and paste styles between layers - Set tile size for WMS layers - Support for nesting projects within other projects

Thanks to all the sponsors and everyone who put a lot of work into this release!

QGIS 1.8 is out!

  • Open Source
  • qgis tags:
  • Open Source
  • osgeo
  • qgis
  • Quantum GIS

After almost a year and a lot of hard work QGIS 1.8 is finally out.  This is the best QGIS version so far, packed full of fancy new features.

The official release notice can be found here: http://qgis.org/index.php?option=com_content&view=article&id=149 and downloads can be found at http://download.qgis.org

Here is the change log of all the new stuff in 1.8:

- QGIS Browser - a stand alone app and a new panel in QGIS. The browser lets you easily navigate your file system and connection based (PostGIS, WFS etc.) datasets, preview them and drag and drop items into the canvas. - DB Manager - the DB manager is now officially part of QGIS core. You can drag layers from the QGIS Browser into DB Manager and it will import your layer into your spatial database. Drag and drop tables between spatial databases and they will get imported. You can use the DB Manager to execute SQL queries against your spatial database and then view the spatial output for queries by adding the results to QGIS as a query layer. - Action Tool - now there is a tool on the map tools toolbar that will allow you to click on a vector feature and execute an action. - MSSQL Spatial Support - you can now connect to your Microsoft SQL Server spatial databases using QGIS. - Customization - allows setting up simplified QGIS interface by hiding various components of main window and widgets in dialogs. - New symbol layer types - Line Pattern Fill, Point Pattern fill - Composers - have multiple lines on legend items using a specified character - Expression based labelling - Heatmap tool - a new core plugin has been added for generating raster heatmaps from point data. You may need to activate this plugin using the plugin manager. - GPS Tracking - The GPS live tracking user interface was overhauled and many fixes and improvements were added to it. - Menu Re-organisation - The menus were re-organised a little - we now have separate menus for Vector and Raster and many plugins were updated to place their menus in the new Vector and Raster top level menus. - Offset Curves - a new digitising tool for creating offset curves was added. - Terrain Analysis Plugin - a new core plugin was added for doing terrain analysis - and it can make really good looking coloured relief maps. - Ellipse renderer - symbollayer to render ellipse shapes (and also rectangles, triangles, crosses by specifying width and height). Moreover, the symbol layer allows to set all parameters (width, height, colors, rotation, outline with) from data fields, in mm or map units - New scale selector with predefined scales - Option to add layers to selected or active group - Pan To Selected tool - New tools in Vector menu - densify geoemtries, Build spatial index - Export/add geometry column tool can export info using layer CRS, project CRS or ellipsoidal measurements - Model/view based tree for rules in rule-based renderer - Updated CRS selector dialog - Improvements in Spatial Bookmarks - Plugin metadata in metadata.txt - New plugin repository - Refactored postgres data provider: support for arbitrary key (including non-numeric and multi column), support for requesting a certain geometry type and/or srid in QgsDataSourceURI added gdal_fillnodata to GDALTools plugin - Support for PostGIS TopoGeometry datatype - Python bindings for vector field symbollayer and general updates to the python bindings. - New message log window - Benchmark program - Row cache for attribute table - Legend independent drawing order - UUID generation widget for attribute table - Added support of editable views in SpatiaLite databases - Expression based widget in field calculator - Creation of event layers in analysis lib using linear referencing - Group selected layers option added to the TOC context menu - load/save layer style (new symbology) from/to SLD document - WFS support in QGIS Server - Option to skip WKT geometry when copying from attribute table - upport for zipped and gzipped layers - Test suite now passes all tests on major platforms and nightly tests - Copy and paste styles between layers - Set tile size for WMS layers - Support for nesting projects within other projects

Thanks to all the sponsors and everyone who put a lot of work into this release!

New QGIS Training Provider in Australia - Digital Mapping Solutions

If you are in Australia and are looking for some QGIS training Digital Mapping Solutions have just announced that they are now providing a  2 day Introduction to QGIS training course.

The course covers such things as:

  • User interface and basic tools

  • QGIS projects and preferences

  • Coordinate Reference Systems and On-The-Fly (OTF) projection

  • Map navigation and QGIS tools

  • Vector map objects: Adding, deleting & modifying

  • Attribute data: Field editing & modification

  • Layer manipulation

  • Digitizing

  • Styles and labelling

  • Object manipulation: Combine, split & buffer

  • Registering raster imagery

  • Creating layouts for printing

  • Utilising WMS and WFS Web Services

  • Plugins

  • Database connectivity

More details and a booking form for the course can be found at http://www.mapsolutions.com.au/training/quantum-gis/introduction-to-qgis.aspx

Training like this is great for QGIS popularity in Australia.  Working in local government I know how hard it can be to get IT to say yes to software unless there is formal training of some sort, and now thanks to DMS there is.

Enjoy :)

New QGIS Training Provider in Australia – Digital Mapping Solutions

If you are in Australia and are looking for some QGIS training Digital Mapping Solutions have just announced that they are now providing a  2 day Introduction to QGIS training course.

The course covers such things as:

  • User interface and basic tools
  • QGIS projects and preferences
  • Coordinate Reference Systems and On-The-Fly (OTF) projection
  • Map navigation and QGIS tools
  • Vector map objects: Adding, deleting & modifying
  • Attribute data: Field editing & modification
  • Layer manipulation
  • Digitizing
  • Styles and labelling
  • Object manipulation: Combine, split & buffer
  • Registering raster imagery
  • Creating layouts for printing
  • Utilising WMS and WFS Web Services
  • Plugins
  • Database connectivity

More details and a booking form for the course can be found at http://www.mapsolutions.com.au/training/quantum-gis/introduction-to-qgis.aspx

Training like this is great for QGIS popularity in Australia.  Working in local government I know how hard it can be to get IT to say yes to software unless there is formal training of some sort, and now thanks to DMS there is.

Enjoy :)


Filed under: Open Source, qgis

New QGIS Training Provider in Australia - Digital Mapping Solutions

If you are in Australia and are looking for some QGIS training Digital Mapping Solutions have just announced that they are now providing a  2 day Introduction to QGIS training course.

The course covers such things as:

  • User interface and basic tools

  • QGIS projects and preferences

  • Coordinate Reference Systems and On-The-Fly (OTF) projection

  • Map navigation and QGIS tools

  • Vector map objects: Adding, deleting & modifying

  • Attribute data: Field editing & modification

  • Layer manipulation

  • Digitizing

  • Styles and labelling

  • Object manipulation: Combine, split & buffer

  • Registering raster imagery

  • Creating layouts for printing

  • Utilising WMS and WFS Web Services

  • Plugins

  • Database connectivity

More details and a booking form for the course can be found at http://www.mapsolutions.com.au/training/quantum-gis/introduction-to-qgis.aspx

Training like this is great for QGIS popularity in Australia.  Working in local government I know how hard it can be to get IT to say yes to software unless there is formal training of some sort, and now thanks to DMS there is.

Enjoy :)

Back to Top

Sustaining Members