Related Plugins and Tags

QGIS Planet

QGIS gets Oracle support!

Seems this is a good day for QGIS Oracle users. According this commit made by Jürgen QGIS now has built-in Oracle support. Win!

Native Oracle support can now see QGIS being opened up to a wider user base yet again. A large user base normally means more people willing to sponsor awesome new features and bug fixes. Having seen the growth in the user base from having native MS SQL Server 2008+ support I can imagine what it will be like with Oracle.

The list of formats QGIS can open and edit is getting larger and larger with each release. Is there a future for vendor lock in? I can’t see it.

Standard disclaimer about latest dev build and new features :)


Filed under: Open Source, qgis Tagged: FOSSGIS, gis, Open Source, oracle, osgeo, qgis, qgis-editing, Quantum GIS

New QGIS PDF and HTML manuals

A quick update from the QGIS documentation team today on the mailing list. The QGIS 1.8 manual is now available in HTML and PDF form.

HTML manual can be found at:
http://docs.qgis.org/html/en/docs/user_manual/index.html

PDF manual at:
http://docs.qgis.org/pdf/QGIS-1.8-UserGuide-en.pdf

This has been part of an ongoing effort from the documentation team since before the 1.8 release to bring our all our documentation into reStructedText rather then LaTeX. Moving to reStructedText allows quicker updates and a larger range of final output formats.

I would like to thank everyone who has been involved in this process as I know what a grueling process updating documentation can be.

Community notice

Just remember you don’t have to be a programmer to contribute to an open source project. If you think you could contribute to the updating of the QGIS documentation please contact the team on the mailing list.


Filed under: Open Source, qgis Tagged: FOSSGIS, gis, Open Source, osgeo, qgis, Quantum GIS

Using a QGIS spatial index to speed up your code

If you need to do any kind of spatial operations in QGIS using Python or C++ you really want them to be as fast a possible in order reduce the amount of time you make the user wait. Lets take the simple scenario of a recent question that was asked on gis.stackexchange; Summing up values of neighboring polygons?.

I went for the SQL approach as I like how quick SQL can express what you need to do, however SQL is not the only way to skin a cat as spatialthoughts has shown in his blog post. Here Ujaval has used Python to find the neighboring polygons of each feature. Running the script on a small dataset yields results in reasonable time however running it on a larger dataset can take a long time.

In order to check if a feature touches another you need to have two features to compare against each other. The simple way to do this is to create two loops where you check each feature against every other feature. Here is a quick code example of just that.

layer = qgis.utils.iface.activeLayer()
# Select all features along with their attributes
allAttrs = layer.pendingAllAttributesList()
layer.select(allAttrs)
# Get all the features to start
allfeatures = {feature.id(): feature for (feature) in layer}

def noindex():
        for feature in allfeatures.values():
                for f in allfeatures.values():
                        touches = f.geometry().touches(feature.geometry())
                        # It doesn't matter if we don't return anything it's just an example

import timeit
print "Without Index: %s seconds " % timeit.timeit(noindex,number=1)

So the above code is pretty simple, just loop each feature and check against every other feature. No worries. No worries at least until you run this on a large dataset then I think you can see the issue here. Running the above code on a layer with around 28000 features takes 1912.41 seconds – that’s 31 minutes. Holy crap!

Note: We put all the features of the layer into a dictionary as it will make lookup quicker in the later index example.

How can we speed up the above code? Lets take a gander at QgsSpatialIndex

QgsSpatialIndex to rule them all

QgsSpatialIndex is a wrapper around the open source SpatailIndex lib and uses a RTree for an index method. If you don’t know what an index is you can think of it like the index in a book – a pointer to a location in the book rather then having to scan every page to find a word.

There isn’t much to using QgsSpatialIndex just insert each QgsFeature and it handles the rest, when we need something out we just use the intersects method to return any features inside an area.

layer = qgis.utils.iface.activeLayer()
# Select all features along with their attributes
allAttrs = layer.pendingAllAttributesList()
layer.select(allAttrs)
# Get all the features to start
allfeatures = {feature.id(): feature for (feature) in layer}

def withindex():
        # Build the spatial index for faster lookup.
        index = QgsSpatialIndex()
        for f in allfeatures.values():
                index.insertFeature(f)

        # Loop each feature in the layer again and get only the features that are going to touch.
        for feature in allfeatures.values():
          # Get the ids of all the features in the index that are within
          # the bounding box of the current feature because these are the ones
          # that will be touching.
          ids = index.intersects(feature.geometry().boundingBox())
          for id in ids:
            f = allfeatures[id]
            if f == feature: continue
            touches = f.geometry().touches(feature.geometry())
            # It doesn't matter if we don't return anything it's just an example

import timeit
print "With Index: %s seconds " % timeit.timeit(withindex,number=1)

Running this code on our 28000 feature layer returns the results in 10 seconds. 31 minutes down to 10 seconds by just using a spatial index. Nice!

So the next time you need to do some spatial operations remember to use the handy QgsSpatialIndex in order to speed up your code. If you don’t want to use QgsSpatialIndex, or need some more flexiblity, you could even use the Python RTree module.

Full code

layer = qgis.utils.iface.activeLayer()

# Select all features along with their attributes
allAttrs = layer.pendingAllAttributesList()
layer.select(allAttrs)
# Get all the features to start
allfeatures = {feature.id(): feature for (feature) in layer}

def noindex():
	for feature in allfeatures.values():
		for f in allfeatures.values():
			touches = f.geometry().touches(feature.geometry())
			# It doesn't matter if we don't return anything it's just an example

def withindex():
	# Build the spatial index for faster lookup.
	index = QgsSpatialIndex()
	map(index.insertFeature, allfeatures.values())

	# Loop each feature in the layer again and get only the features that are going to touch.
	for feature in allfeatures.values():
	  ids = index.intersects(feature.geometry().boundingBox())
	  for id in ids:
	    f = allfeatures[id]
	    touches = f.geometry().touches(feature.geometry())
	    # It doesn't matter if we don't return anything it's just an example

import timeit
print "With Index: %s seconds " % timeit.timeit(withindex,number=1)
print "Without Index: %s seconds " % timeit.timeit(noindex,number=1)


Filed under: Open Source, qgis Tagged: FOSSGIS, gis, qgis, Quantum GIS, spatial operations

Five new awesomely awesome QGIS features – Round 2

As QGIS is such a fast moving project I have decided to make this a regular blog post in order to highlight some new features added to QGIS. If you haven’t already, don’t forget to check out round one.

Remember that some of these features may still only be new which might change between now and the next official released version. With that out of the way lets get listing.

Atlas integration

If you are a regular user of QGIS Python plugins, and who isn’t, then you would have used the awesome Atlas plugin developed by Vincent Picavet. This great tool can be used to generate mapbooks, or an atlas as some people like to say, using a coverage layer and a print composer. What makes this even more awesome is that it is now built into the print composer.

Atlas composer intergration

The builtin atlas function also gives you the ability to use an expression to do runtime text replacement, including access to all the fields on the coverage layer.  The coverage layer doesn’t even have to be a region layer, it can be a simple point layer, or even a line layer.   You can see the result of me running the atlas generation from the above example here

Big thanks to Oslandia for integrating this great feature, and the companies sponsoring the work.
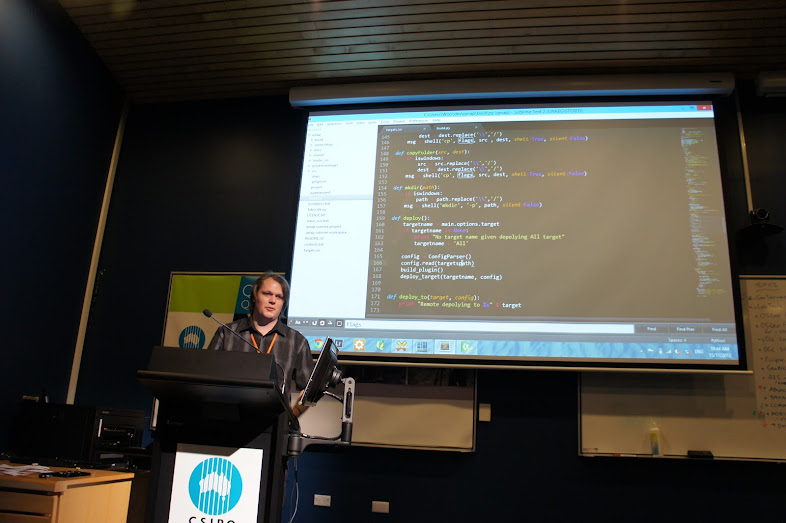
New Python console

This new addition comes from the great work that Salvatore Larosa has been doing to add a better Python console to QGIS.

The new Python console includes attribute auto complete, syntax highlighting, better copy and paste, uploading to codepad, the ability to run code from a file, etc.  You don’t realise how much difference there is until you go back to using the old one in version 1.8.

New Python console

Tabbed and groups in builtin forms

One of the things I really loved about QGIS, coming from MapInfo, was the builtin forms.  Just having the ability to enter data using controls like combo boxes, calendar widgets, etc makes you one step closer to having better data.   This feature is the exact reason I setup a 67 year old for kerb data collection.

As good as they are the builtin forms have an issue of ending up with as a big scrolling list with lots of fields; also the lack of  the ability to group or put fields on tabs in the UI meant you had to create a custom form.  Well not any more.

There is now a combo box on the Fields tab that allows you to build a generated form but also add tabs and group boxes.  You can even have the same field shown more then once on the form, handy for something like an ID field that you would like to show on each tab.

With this new ability the builtin forms can get me 95% of the way for data entry jobs, the other 5% I just make a custom form – but that is very rare.

Sextante

Sextante is a great and powerful analytical framework that has been added to the core of QGIS thanks to Victor Olaya.  This is not a feature that I use a lot but this is only due to most of my work being in development and not analysis, however that doesn’t mean that it’s not a really cool feature.

One of the greatest things about the Sextante toolbox is that it allows you to integrate other great open source tools like GRASS, SAGA, R, OTB, etc, right into your QGIS workflow and view the results in the canvas. It even includes a modeller so that you can build a connected diagram of all the bits of your process, even if it crosses between programs.

The toolbox

For me what is even better is that you can use Sextante in your plugins or custom Python code.  Sextante has a Python interface – well the whole thing is written in Python – that you can use to run a Sextante supported algorithm.

import sextante
outputs_0=sextante.runalg("grass:v.crossbones", /file, 0, ,, 1, 2, 3, 4, 1=3.0,2=8.0,5=6.0,8=6.0,11=6.0,14=6.0, None)
outputs_1=sextante.runalg("grass:v.delaunay", outputs_0['output'], True, True, None)
outputs_2=sextante.runalg("grass:v.dissolve", outputs_0['output'], , None)

Victor has created a blog to cover some Sextante recipes at QGIS-SEXTANTE cookbook/. There are also some really cool example of Sextante in use at:

Massive amount of composer additions

This last feature, or rather feature set,  comes from the sponsorship and support of the World BankAustralia-Indonesia Facility for Disaster Reduction, Geoscience Australia and the GFDRR.  Most of this work was done to aid in the development of a new QGIS plugin called inaSAFE, which has also received some great praise

“(InaSAFE) is very beneficial for all of us. It’s a good example of our partnership.”
Dr Susilo Bambang Yudhoyono – President of Indonesia

Some of the improvements include:

  • A new loadFromTemplate method, in the API, that can do text replacement in the QGIS composer template.
  • Better support for EPSG:4326 scale bars
  • Multipage in one composer
  • Automatic overview frame in map frame
  • HTML frame
  • Zebra style grid frame border
  • More control of grid labels. Inside, outside, disabled
  • etc, etc

These are great additions to the QGIS composer and I have already used the overview frame feature along with the new atlas integration  to make some quick nice looking map books. \

A huge thanks to the World BankAustralia-Indonesia Facility for Disaster ReductionGeoscience Australia and the GFDRR, and all the developers included.

You can see some of the output that InaSAFE generates using some of these new features at http://quake.linfiniti.com/

P.S The World Bank also sponsored the new raster Save As.. ability just like we have for vector layers.


Filed under: Open Source, qgis Tagged: FOSSGIS, gis, Open Source, osgeo, qgis, Quantum GIS

FOSS4G-AU in summary

Last Thursday and Friday was our first local Australian FOSS4G event which was hosted at the CSRIO building in Brisbane.  Very big thanks to CSRIO for hosting the event.  The venue was setup perfectly for  hosting an event like this, including dual projectors for presenting, video calls over to Perth, etc.

The first day was done using a un-conference style of event. This is the first time I’ve been to a un-conference and I liked the format a lot.   Once everyone was there on the first morning we collected ideas from people and everyone voted on which ones they would like to see.  After we had picked enough topics Shaun and I made a program for the day and we started.

Topics included:

Me presenting QMap

The second day was a code sprint.  I worked on converting a MapBasic scripts from one of the guys to QGIS, and Jody enlisted the others to help check the headers of the GeoServer project so that it can finally pass OSGeo incubation.

Overall I think it was a very successful event.  I would like to make these a yearly event if we can, provided that we have people to talk, or projects to work on.

More information about up coming OSGeo events in Australia and New Zealand can be found at http://www.meetup.com/osgeo-aust-nz/


Filed under: Open Source, qgis Tagged: FOSSGIS, gis, Open Source, open source gis, osgeo, qgis, Quantum GIS

User defined expression functions for QGIS

Ever since I added expression based labels, including the new expression builder UI, something that I always wanted to add is the ability to define custom user defined functions in Python (or C++) and use them in an expression. The expression engine is used for labels, rule based rendering, layer actions, field calculator, and atlas composer tags.  Thanks to the all the awesome work on the expression engine by Martin all this cool stuff is now possible.

Today I pushed a commit into master that adds the ability to define a function in Python (or C++), register it in the expression engine, then use it anywhere expressions are used.

The good stuff

Lets take a use case from Ujaval Gandhi and his example of counting vertices for each feature.

First we need to import the new qgsfunction decorator function from qgis.utils. The qgsfunction decorator will take a normal Python function, wrap it up in the class used to define a function, and register it in the engine.

So what does an empty function look like:

from qgis.utils import qgsfunction
from qgis.core import QGis

@qgsfunction(0, "Python")
def vertices(values, feature, parent):
	pass

@qgsfunction(0, "Python") means we are defining a new vertices function that takes 0 args and lives in the “python” group in the expression builder UI. Any custom function must take (values, feature, parent) as python args. values is a list of QVariants passed into the function, feature is the current QgsFeature, and parent is expression engine node (you use this to raise errors).

Lets stick some more logic in there:

from qgis.utils import qgsfunction
from qgis.core import QGis

@qgsfunction(0, "Python")
def vertices(values, feature, parent):
	"""
		Returns the number of vertices for a features geometry
	"""
	count = None
	geom = feature.geometry()
	if geom is None: return None
	if geom.type() == QGis.Polygon:
		count = 0
		if geom.isMultipart():
		  polygons = geom.asMultiPolygon()
		else:
		  polygons = [ geom.asPolygon() ]
		for polygon in polygons:
		  for ring in polygon:
		    count += len(ring)
	return count

Pretty simple. Get the geometry from the feature, check if it’s a polygon, if it is then count the number of vertices and return that number.

Now that we have that all done we can save it into a file in our .qgis/python folder, lets call it userfunctions.py (note you don’t have to save it here, anywhere that QGIS can find it will do.  Anywhere on PATH)

Lets open QGIS and run import userfunctions.py:

Importing functions from userfunctions.py

Now open the label properties for the layer:

The new function shown in the expression builder

Nice! Notice also that the function doc string is used as the function help. How cool is that.  You can also see the $ sign in front of the function, this is because any functions that take no args are considered special and use the $ sign as a convention, this is all automatic when the function is registered.

And the result is:

The label using the new function

You can even use it in the rule based rendering:

Rule rendering using new function

Enjoy!

Notes

  • You must unregister a function once you are finished with it using QgsExpression.unregisterFunction(name). This mainly applies to plugins where the user might unload your plugin and the code is no longer available. In the above example we could import userfunctions and never unregister because we plan on using it for the whole session.
  • You can’t override the built-in methods.

Filed under: Open Source, qgis Tagged: FOSSGIS, gis, Open Source, OSS, qgis, Quantum GIS

Australian QGIS User Group

I’m very please to announce the Australian QGIS User Group. Chris Scott (DMS) and I created this group because the interest in QGIS here is growing fast and it would be nice to have a place where us Aussies can hang out and chat about QGIS stuff, discuss local issues, organize local events, put shrimps on the barbie.

My ultimate goal would be to turn this into a full user group much like the Swiss QGIS User Group but for now we will keep it light.

Everyone is free to view the content of the home page and the Google group, however you have to request to join the Google Group to post.  This is only so that we can keep it local and not reduce the official QGIS mailing lists.

So in saying all that. If you live in Australia. Use QGIS, or are interested in QGIS. Feel free to join the group.


Filed under: Open Source, qgis Tagged: FOSSGIS, gis, Open Source, osgeo, qgis, Quantum GIS

Don’t forget to migrate your QGIS plugins!

From QGIS 1.8 and onwards the Plugin Installer plugin will no longer include the option to add the 3rd party repositories.  This was by design and intended to move people over to using the official plugin repository at http://plugins.qgis.org/ so we can provide a richer experience and keep everything in one place.

If you have plugins that are still not on the official repository then I would strongly recommend that you migrate them as a lot of new 1.8 users will be missing out on your great work.


Filed under: Open Source, qgis Tagged: FOSSGIS, gis, Open Source, python, qgis, Quantum GIS

HTML map tips in QGIS

New fresh QGIS feature! So fresh in fact you can still smell the wet paint :)

QGIS (development build) can now display map tips using HTML (a subset anyway).

To enable the new map tips: Open the Layer Properties dialog for a layer and select the Display tab

Display tab to set HTML map tips

In action

Layer properties for HTML map tip

Notice how we can also use a QGIS expression. Anything inside [% %] will be evaluated and replaced with the value in real-time. We can even use a CASE statement. Pretty cool!

And the result when hovering over a feature

HTML in QGIS map tip? Yes! WOOT!

Hold on. Pause the track! We can even use some CSS to make it more fancy.


<style>
h1 {color:red;}
p.question {color:blue;}
</style>
<h1> [% "NAME" %] </h1>
<br>
<img src="[% "image" %]" />
<br>
<p class="question">Is this place a country?</p>
<br>
[% CASE WHEN "TYPE" = 'Country' THEN 'Yes' ELSE 'No. It is a ' || "TYPE" END %]

CSS in a html map tip

Happy Mapping :)


Filed under: Open Source, qgis Tagged: FOSSGIS, gis, mapping, Open Source, qgis, styling, tips

Better date and time support in QGIS expressions and styles

Version note: This will only work in the latest dev build of QGIS – not in 1.8

The lack of uni for the next couple of weeks has left me some time at night to work on some features that I really wish QGIS had.  One of these features was better date and time support in the expression engine.  Date and time is an important concept when working on inspection data and not being able to style my features in QGIS using date operations was bugging me.  So in good open source fashion I added some.

Here are the current functions (more to come in the future):

  • $nowreturns the current date and time
  • age({datetime},{datetime}) - returns the difference between the two dates
  • todate({string}) - converts a string to date type
  • totime({string}) – converts a string to time type
  • tointerval({string}) – converts a string to a interval type (details below)
  • day({datetime} or {interval}) – returns the day from a datetime type or the number of days in a interval.
  • hour(…) – Same as above but for hours
  • minute(…)  - Same as above but for minutes
  • second(…)  - Same as above but for seconds
  • day(..)  - Same as above but for days
  • week(..)  - Same as above but for weeks
  • month(…)  - Same as above but for months
  • year(…) - Same as above but for years
  • {datetime} – {interval} = {new datetime} – returns a new datetime subtracting the interval 
  • {datetime} + {interval} = {new datetime} – returns a new datetime adding the interval


The interval type

Functions like age(..), tointerval(), {datetime} -/+ {interval}, day(..), hour(..), etc, use, or return, Intervals.  An Interval is a measure of time that we can use for different things.  An example of an Interval is ’1 Year 2 Months’ this is then converted to a number of seconds and used for any calculations.

For example one can take away 10 days from the current date by doing the following ( -> marks the output ):

todate($now - '10 Days')
-> 2012-06-20

as

todate($now)
-> 2012-06-30

We can also do something like:

todate($now + '2 Years 1 Month 10 Days')
-> 2014-08-10

The age() function will return an interval which we can use extract what information we need.

The number of days between two dates:

day(age('2012-06-30', '2012-06-10'))
-> 20
-- Think of it as '2012-06-30' - '2012-06-10'
-- Note: day(), month(), etc, functions return doubles so you can get
-- 21.135234 days if you are using date & time type rather than just date type
-- wrap the result in toint() to get a more sane output.

Day() will also work on a plain date:

day('2012-06-30')
-> 30

We can even get the number of seconds between two dates:

second(age('2012-06-30', '2012-06-10'))
-> 1728000

Currently the only date format supported is {year}-{month}-{day} as seen in the examples above. Shouldn’t be too hard to add support to the todate(), todatetime(), totime() functions for giving it a pattern to use when converting the string e.g. dd-mm-YYYY, or something like that.

More on this fancy new stuff

When I wrote the new expression builder dialog a while ago I made it dynamic so that any new functions added to the expression engine will show up automatically.  So here they are:

List of new date and time functions.

We can also use these functions in the rule based rending, which is where the power really comes in.  Lets see something like that in action:

Styled using days and years

Should be pretty straight forward to understand. We are using the age() and day() functions to style the events that are older than 30 days, within 30 days, for today, or in the future.  We also check the year of the event using year() and year($now) to make sure we only see this years events, or style them differently depending on if they are last years events or in the future.

This is the result of the above rules:

Result of using date functions in rule based renderer

I’m also using the date functions in the expression based labelling to label the features using the following expression:

CASE
WHEN year( "dateadded") < year($now) THEN
	'Last Year'
WHEN day(age("dateadded", $now)) < 0 THEN
	day(age("dateadded", todate($now))) || ' Days old'
ELSE
	day(age("dateadded", todate($now))) || ' Days to go'
END

Well that’s it. Hope you find it handy in your day-to-day mapping. I know I will be using it a lot.
Thanks to Martin and Jürgen for the code reviews during the process; venturing in an unknown part of the code base always makes me nervous but that is all part of learning, and sometimes you can make some pretty cool stuff.
Some other random notes: The general idea has been modelled of how Postgres handles dates and times, it’s not an exact copy but follows the same kind of ideas. The interval class also uses the same number of seconds for one year that postgres does so that we can be consistent with the output.


Filed under: Open Source, qgis Tagged: FOSSGIS, gis, map-rendering, Open Source, osgeo, qgis, Quantum GIS, styling

Styling temporal (time) data in QGIS

So this years first uni semester is done and dusted, now I have some free time.  Blog all the things!

This is a follow up post for discussion that was started on LinkedIn about showing features older, or newer, then a certain date different colours   The main post was about using free, or low cost, solutions in order to aid in mapping water networks. I recommend that everyone watch it. A very good presentation.

I recommended that you could use the rule based rendering engine but the expression engine in QGIS doesn’t have any date functions yet.  All good we can add them if we need and once I get my head around the expression engine I plan on doing exactly that. But for now we can do it a different way.

We are going to use Spatialite, but any database will do (syntax and process will vary).

Lets have a look an inspection layer we have in our Spatialite database viewed in QGIS:

Pretty boring and hard to see what has been done in the last 30 days.  Now with the lack of support for dates in the expression engine we have to use another methods.  For this example we will use the really handy DBManger plugin that now ships with QGIS from 1.8.  Load it, connect to your database, and run the following query:

SELECT id,
              CASE WHEN DATE("date_checked") > DATE('now', '-30 days') THEN
                         'Within 30 Days'
              ELSE
                         'older'
              END as age, date_checked, geom
FROM  "inspections"

As you can see anything that is within the 30 days now has the “Within 30 Days” string in the age column, or else it has “older”.  CASE statements can be very powerful things in SQL sometimes.

Now load it into QGIS, style, and label it using the new age column

and Bob’s your uncle

You now have a layer that is style based on age but is also dynamic.  Adding a new inspection point will now will be styled according to those rules. (Although you will have to edit the normal inspection layer with it turned off as views/queries are not editable – without some setup anyway)

It might be a simple thing to some but sometimes it’s hard to find the right words to describe what you want when you are looking for this kind of thing. So hopefully this has helped a few people get started with visualizing their time/date based data in QGIS.

Happy mapping!


Filed under: Open Source, qgis Tagged: FOSSGIS, gis, Open Source, osgeo, qgis, Quantum GIS, styling

Using QGIS in local government

Something that I always find interesting is how people are using different open source tools to get their work done.  This post attempts to outline how I/we are using QGIS at work for different projects.

Kerb mapping, condition, and defect pickup

This project is currently being done by a 67 year old foreman who has worked for the council for a very long time and has great knowledge of the town.   QGIS, with the main working layers stored in PostGIS, was setup so that he can:

  • Digitize kerb lines from aerial photos.
  • Split the existing kerb lines into segments depending on different asset rules.
  • Give each segment an overall condition rating.
  • Add defect points along the each kerb segment e.g. broken, lifted, etc,

Each defect point is snapped to the underlying  kerb line and chainages (distance along line) is generated using a update statement at the end of the project (could be done using a insert trigger if needed) using ST_line_locate_point(line, point).

Defect points coloured by risk captured against the kerb line

Overall QGIS has been great for this project.  The built in data entry forms have been a great help to allow fast and correct data entry. Each form has four drop downs all with present values and descriptions to aid in data entry.

Flood damaged claim maps

We recently suffered, like the rest of Queensland, some really major flooding which caused large amounts of damage to our road infrastructure. We got off pretty light compared to some places, nevertheless we still had a lot of damaged assets.  And so began the process of collecting data that could be used for state government funding claims.

Anyway, onto the QGIS bit.  QGIS was installed on one of the main engineers computers in order for him to make maps for each claim.  Having the ability for him to have one map window but multiple frames in the composer helped him to create multiple  views of the same data with ease.

In total there are 42 QGIS project files with a main project file which served the base layers to the other projects, using the cool Embed Layers and Groups feature.  This means any change in main base project was reflected up(down?) to the other projects next time they are opened.  The main project file has things like, property layer; normal road layers, with labels; road layer with roads for claims.   The other 42 projects have a filtered, and styled, road layer to only show roads in that batch, and its composers (print layouts).

Normally we would use MapInfo for this kind of thing but consider this: There are at least 3 print layouts per claim, each layout could have more then one map frame.  Now with MapInfo only being able to have a 1:1 ratio between the map window and the map frame in the layout you would need at least 3 map windows per claim.  Quick calc:

42 * 3 =  126+n map windows + 126 print layouts (n = extra map frames in layouts)

Each map window has its own copy of every layer, making change once apply every where changes hard.  This of course doesn’t apply to styles as they are stored in the .map (tab) file, but does for labels, style overrides, etc.   I’ll pass.

QGIS is no means perfect for printing or print layouts but the 1:N map window to map frame ratio worked really well for this project.  The styling options in QGIS also helped to change the display of the map depending on what was needed to be shown quickly, one even used the rule-based rendering.

You get the point.
Moving on.

Processing GPS photos with road chainages

This one I am quite proud of.  It’s nothing fancy but still saves a lot of time.  While not really QGIS only but a combination of QGIS+Spatialite it process GPS photos and assigns them a road name and chainage.

The issue: A large influx of GPS photos for the different flood damage projects and the need to process them quickly so that they got assigned to the correct road and chainage.  Now you can map GPS photos easy enough but then you still have to go to each one and assign a road name, chainage, and move it into the correct folder.  To hell with doing that by hand, this is why we invented GIS.

The result is a little (140 line) python script that:

  1. extracts the coordinates from each photos,
  2. finds the closest (within tolerance) road distance node (distance nodes are generated at 5m intervals along the road, around 800,000 in total for the whole shire),
  3. gets the road name, locality, and chainage for that node,
  4. creates a folder with that road name,
  5. renames the photo with {name} @ {chainage},
  6. moves it into the road name folder it is assign to.
  7. inserts a record for that photo into the spatialite database that can be viewed in QGIS.
The Spatialite database has a spatial index on the road distance nodes and with that in place it can process 148 photos in 8 seconds.  Not too bad at all. Now all we have to do to process the photos is stick them into a special folder and run process.bat.

Porting our planning scheme maps

I have been involved in creating, and maintaining, our planning scheme maps for the council.  It’s been a pretty fun project, apart from the constant moving target that is the state planning specifications, but I digress.

Planning scheme in QGIS

This project was done, and still is, in MapInfo. While there is nothing technically wrong with that, it has become a bit more of a pain to maintain then one would hope.  The planning scheme is not just one map but rather a series of different maps all with different scales and requirements.  I’m sure by now you can start to see the issues that can arise:

  1. No dynamic scale bar for layouts (not even a scale bar object rather just text and boxes made to look like a scale bar. With no group items feature moving these around is a pain).
  2. 1:1 map window to map frame means excessive map windows when the data is all the same with just different views.
  3. Legends don’t support ordering, adding items, or groups.
  4. With no embedding base maps feature like in QGIS it’s hard to change one thing and apply it to all the map windows/workspaces.
The specifications also ask for lines with symbols along them to show things like bikeways, footpaths etc, something that can’t be done in MapInfo, well it can by using the line style editor but I would rather stab myself in the eye.
The one thing I haven’t fully worked out how to do in QGIS yet is fully automate the printing process. Currently I open MapInfo using a batch file and pass it a workspace and MBX which prints the layouts and exits. I do this for each map type.    In QGIS I have a few options:
  1. Create a plugin that runs though each project and prints off its composers.
  2. Create a python script that runs from a batch file using qgis.core and qgis.gui QGIS python bindings.
  3. add a –code option to the command line of QGIS so that you could run: qgis.exe –noplugins –code “print.py”, which would open QGIS and run the python code and exit.
I’m yet to explore what option is the best for this project but I’ll get back to you on that.  Once I have the above issue sorted I plan on creating the maps in QGIS to see how it would turn out (time permitting)

Custom asset data collection program

This one would have to be my favourite.  I really love programming (most days), and being able to create our own data collection program using QGIS and MS SQL 2008 has been great.

While it is only very very young I’m already seeing some great potential.  Using an open source base (apart from MS SQL) has given us a lot of power, power to change stuff that we don’t like (which so far has been one minor bug), and the power to get exactly what we need.

I can’t talk about this project a lot as it is only very new and still only in design/testing/prototyping stage.

The main things for me are:

  • Ease of use. If I get asked how to do something over and over I have failed the users. And no 100 page training manuals.
  • Fast
  • No menus, or right-click menus! I’m a power user and even I hate navigating menus on a tablet.
  • Easy to build custom forms
  • Online/Offline syncing
  • Ease of use. Oh did I say this already!? Well it’s important.
  • Easy to configure by admins.
  • Limited use of dialogs. It’s NOT ok for an app to ask users to confirm 100 dialogs to do one thing.

Overall I think using QGIS and PyQt I can hit all the targets listed above quite well. In fact I know I can because I have already hit most of the them in the last couple of weeks.

Summary

So that is my list of QGIS uses in my local government situation, hopefully it wasn’t TL;DR and you found it interesting.  I’m sure there will be plenty more to add at the end of 2012.


Filed under: Open Source, qgis Tagged: case study, FOSSGIS, gis, local gov, Local government, mapinfo, Open Source, osgeo, qgis, Quantum GIS

Custom QGIS feature forms – Value Binding

One thing I didn’t explain very well  in my other post was how to correctly set up value binding between your custom form and QGIS.  I didn’t explain it because at the time I didn’t know how.

The other day I was building a custom form QGIS for a project I am working on. I had named all the fields right, set the ui as the edit form for the layer, but only the line edits were getting bound to the correct values.

 So having a dig around in the code I noticed that QGIS uses the same methods to bind the built-in edit forms as it does for the custom forms, meaning that you must set what kind of control you want to use in Layer Properties -> Fields 

Correctly binding values

First create the form with the controls you need, remember to name them the same as your fields.

Custom form with controls using the same name as the fields

Note that here I have a QComboBox with the FeatureCla name, this will bind the combo box to the FeatureCla field in my dataset in QGIS.

Now set the custom form as the Edit UI for the layer

Set the Edit UI to your form

Tip: You can use relative paths if you store the form along side your project file

 Flick to the Fields tab and set up the Edit Widget type for each field that you have used on the custom feature form.

Set the Edit Widget that matches your control

I have set the FeatueCla field to use Unique values widget, this tells QGIS to collect all the unique values from that column and add them to the QComboBox.  There are a range of different edit widgets you can set

Each will map to a different set of control types (Widgets) e.g. If you want to have a checkbox on your form you must select Checkbox in the Edit Widget list to get it to bind correctly.

Save the properties and head back to you map.  Use the Identify Tool to select a feature.

Values bound to form

And that is it. Pretty cool hey!

Final thoughts

This is one feature I really like in QGIS.  The ability to create custom forms for people to do data entry without the need to build a plugin is very cool.  Couple this the built-in GPS module for QGIS and you have yourself a nice simple field data collection program.

I have some ideas to make this feature even more powerful, but more on that later once I get some time to add it in.


Filed under: Open Source, qgis Tagged: FOSSGIS, gis, Open Source, osgeo, qgis-editing, Quantum GIS

QGIS on the social networks

Did you know QGIS is also on all the major social networking sites?

No?

Well now you do :)

Google+
Facebook
Twitter

Search for QGIS on Twitter
Search for QGIS on Google+

Come join the discussions on your preferred platform. If you prefer not to say much, social networks are still a great way to keep up to date with all the cool stuff happening in QGIS land.

Anita Graser, of underdark.wordpress.com, and myself manage the Google+ and Facebook pages.

If you have something cool that you have done with QGIS and would like to pimp it to the world, free feel to contact me, or even just mention QGIS in the post, Mentioning QGIS will make it show up in the search on Twitter or Google+.  I keep a keen eye on all sites for anything cool that I can reshare on the main QGIS pages.


Filed under: Open Source, qgis Tagged: FOSSGIS, gis, Open Source, qgis, Quantum GIS, social networking sites

A new QGIS plugin: Python Script Runner

Gary Sherman has just published a new Python plugin for QGIS that I think people will find very handy, I know I will.  The plugin allows you to run Python scripts inside QGIS for tasks that don’t really require, or warrant, a whole plugin.

Go check out Gray’s post about the new plugin at http://spatialgalaxy.net/2012/01/29/script-runner-a-plugin-to-run-python-scripts-in-qgis/

The new plugin can be installed via the Plugin Installer using the “runner” or “script”.  The Plugin Installer is another one of my favorite plugins for QGIS, being able to push out a new plugin and know that everyone can get it is a good feeling :)


Filed under: Open Source, qgis Tagged: FOSSGIS, gis, Open Source, osgeo, plugin, python, qgis, Quantum GIS

Improvements to the QGIS rule based rendering

The rule based rendering in QGIS has just got a make over to improve in some of the old usability issues it used to have.  Most of the improvements are UI related. If you would like to try them out you will need to grab a copy of the latest dev build (qgis-dev in OSGeo4W)

Main improvements include:

  • Nested rules.  If the parent rule evaluates to false none of the child rules are applied. This replaces the priority system in the old dialog.
  • Disable symbol for rules. Rules with no symbol only act as a check for the child rules e.g nothing is rendered for the rule but child rules still are (unless also disabled).
  • Drag and Drop rules (multi-selection is supported).  Rules can be dragged onto other rules in order to nest them and set up a rendering hierarchy.
  • Inline editing of rule labels, expressions, scales
  • Overall tweaks to the dialog

The new rule dialog

As you can see in the screenshot, the rules are now organized in a tree which clearly expresses which rules should be applied and when.

In the example above, all the rules under the Sealed rule will only be applied if that rule is true. The old system would have you managing all rules in one big list and dealing with priorities in order to get the rules to apply right, the new dialog is a major improvement.

And the results! As you can see below, QGIS will only render the colored squares if the Sealed rule is true otherwise it just shows a green line.

The rules applied

The work was sponsored by Ville de Morges, Switzerland and developed by Martin Dobias.  Thanks to both of them for these improvements.

More info:

Note: As this is a brand new feature there might be some bugs, or things that don’t quite work as expected. If you do find something don’t hesitate to file a bug report at hub.qgis.org so it can be fixed, or at least known about.


Filed under: Open Source, qgis Tagged: FOSSGIS, gis, map-rendering, mapping, Open Source, osgeo, qgis, Quantum GIS, styling

QGIS support for MS SQL Server 2008 – Coming Soon!

Good news!

Support for MS SQL Server 2008 in QGIS is coming soon.   A native QGIS provider for MS SQL Server is currently being worked on to make using, managing, and editing SQL Server data in QGIS just as easy as PostGIS.

The work is being sponsored by the Australian company Digital Mapping Solutions. So a very big thanks to them for this great feature!

There is no ETA on when it will be added to the main QGIS build, but the provider is currently in testing stage and hopefully will be in there soon.

So if you have been itching to try SQL Server data in QGIS, hang in there as a good solution is just around the corner.

P.S The other blog posts on this topic I used ogr, this method will still work fine after the native provider is added, however the native driver will add a nicer interface including integration into the QBrowser, better optimization for the QGIS code, and hopefully same feel as the PostGIS experience.


Filed under: Open Source, qgis Tagged: digital mapping solutions, FOSSGIS, gis, ms sql server, MS SQL Server 2008, MS SQL Spatial, ogr, Open Source, qgis, Quantum GIS

Expression based labeling now in QGIS.

QGIS finally has expression based labels! (Although you must be running latest dev build)

What does that mean? Well QGIS used to be only able to label with a field from the layer, very limiting if you need to make a nice looking label string. Now you can use expressions (eg ‘Up ‘ || US_Invert || ‘some more text’ ) to label the feature, just like this.

Example of expression based labels

This is something that I missed a lot when moving from MapInfo to QGIS.  After opening a ticket on the QGIS bug list and nothing happening with it for a couple of months (not that I expected anything to, everyone is busy enough as is.  I don’t expect the devs to just jump at all my requests) so I decided I should at least attempt adding it myself.  The joys of open source!

Turns out adding the expression labeling was the easy part, however there was no good generic expression string builder that I could use to build the expression string.  QGIS already had the expression builder for the query window and the field calculator, however the code was very tied down to only work for those implementations, plus they didn’t scale with the increasing function list.  I’m not going to go and make yet another dialog just for the labeling.  Uniformity is the key to good user experience.

After searching around to see what other GIS systems did to get some inspiration it seemed that every example that I came across was, in my opinion, poor.    Although there was one ArcGIS idea ticket that gave me a few ideas http://ideas.arcgis.com/ideaView?id=087300000008IbHAAU

So with that I started working on a generic expression builder that could be used to build an expression string anywhere, replacing the query window and field calculator in due time. One ring widget to rule them all, one ring widget to bind the, etc.

The result

Generic expression builder

Key features of the new expression builder:

  • Live validation of expression
  • Real time searching
  • Live output preview
  • Help on selected item.
  • Easier to add new functions without changing the UI.  Function list is read right from the expression parser.  No more hidden functions.
  • Reusable widget

If the expression hits an error while you type you will be shown an “Expression is invalid” warning (yes I know it’s wrong in the screen shot). Clicking (more info) or hovering over the expression area will show you the error.

Expression has error

Searching can done by using the search box at the top. The function list will reduce to show only functions or fields containing that string (Note: it is case sensitive at the current time) .

Searching for a function or field name.

Still to do

As with all programming it is never bug free so I expect, now that it is open to wider testing, that there might be a few that need to be addressed .   There is also very limited function help written for the functions, although if anyone is willing to have a go at it I’m more than happy.

If you do find any bugs will the widget/dialog you can open a ticket at http://hub.qgis.org/projects/quantum-gis/issues , assign it to me and I’ll see what I can do.

In the works

  • Simple Syntax highlighting
  • Recent expression used list
  • Saved expressions
  • Auto bracketing (maybe)
  • UI tweaking

I would like to thank Martin from the QGIS team for reviewing my code all though the project and helping me improve the code and idea.  Also thanks to all the other people who gave ideas for the widget/dialog.

Enjoy!


Filed under: Open Source, qgis Tagged: FOSSGIS, gis, Open Source, osgeo, qgis, Quantum GIS

Generating contours using GDAL ( via shell or QGIS)

I tell you. It always amazes me how much cool stuff you can do with great open source GIS software these days. GDAL is one of those great open source projects that I have just found a great use for (apart from just opening every raster type under the sun in QGIS).

GDAL has the ability to generate contours from a DEM, something that I have always wanted to try for my town but have never been able due to lack of a good DEMs.

Recently we purchased a set of DEMs that cover a large area as part of a study. Each DEM uses a grid size of 1mx1m. Prefect for generating contours.

Using the GdalTools QGIS plugin.

First make sure that you have the latest version of the GdalTools plugin installed (GdalTools should be installed by default with QGIS. If it’s not, search “Gdal” in the plugin installer). Enable the plugin once it’s installed.

Load the DEM into QGIS using the Load Raster icon.

DEM loaded in QGIS

Now head up to the menu Raster->Extraction->Contour

Raster menu in QGIS

Select the settings that you need. For this DEM I am going to generate 250mm contours.

Contour dialog.

Take note of the text area at the bottom of the dialog as that is the exact command sent to GDAL in order to generate the contours. If you take a copy of that you can run it on the command line for batch processing later.

Hit ok.

250mm contours from the DEM

BAM! :)

Using the command line/shell.

Using QGIS for a one off DEM is fine and dandy but what if you have 3000 DEMs that you need to process. To hell with doing that by hand!

Remember the contour tool in QGIS told us the exact command line args to use, so creating a shell script for automating the process is pretty easy.

for f in *.asc
do
  echo "Processing $f"
 gdal_contour -a ELEV -i 0.25 $f $f-250mm.shp
done

The above code will loop though the current directory and process all the DEMs generating 250mm contours for each one. It saves each new contour file as {filename}-250mm.shp. You will need to change *.asc to whatever format your DEM is in.

Copy the above code into a file somewhere and call it generate_contours.sh. This can then be called from the command line using

sh generate_contours.sh

Running sh on Windows

If you’re a windows user you will need to run OsGeo4W Shell in order to use sh.

Loading OsGeo4w shell.

Once the shell is loaded you can just call:

sh generate_contours.sh

Output from running generate_contours.sh

Final remarks

I ran the above sh script on a folder with about 2500 DEMs and it took around 4 hours to complete the whole folder. Of course performance will vary but it seems pretty quick considering.

Once again the possibly to use open source GIS tools to get my work done is amazing.  No expensive software here.

So far I’m not aware of any line smoothing/generalizing abilities using GDAL/OGR.  Although you can import the contours into GRASS and use that: http://grass.osgeo.org/wiki/V.generalize_tutorial

You can also generate the contours using GDAL via Python but that is a topic for another day.


Filed under: Open Source, qgis Tagged: contours, DEM, FOSSGIS, gdal, gis, grid, ogr, Open Source, osgeo, qgis, Quantum GIS, raster

Visualizing QGIS code activity between 1.6 and 1.7 – Video

Here is a quick video I did this morning using the very cool tool Gource. The video shows all the commits (1265) that were made between release 1.6 and 1.7. QGIS 1.7 was released on 19th June 2011 but there was still some clean up in the 1.7 branch paste that date into September.

It’s interesting to note the large burst of activity around November.


Filed under: Open Source, qgis Tagged: FOSSGIS, gis, git, Gource, Open Source, qgis, Quantum GIS

Back to Top

Sustaining Members