Related Plugins and Tags

QGIS Planet

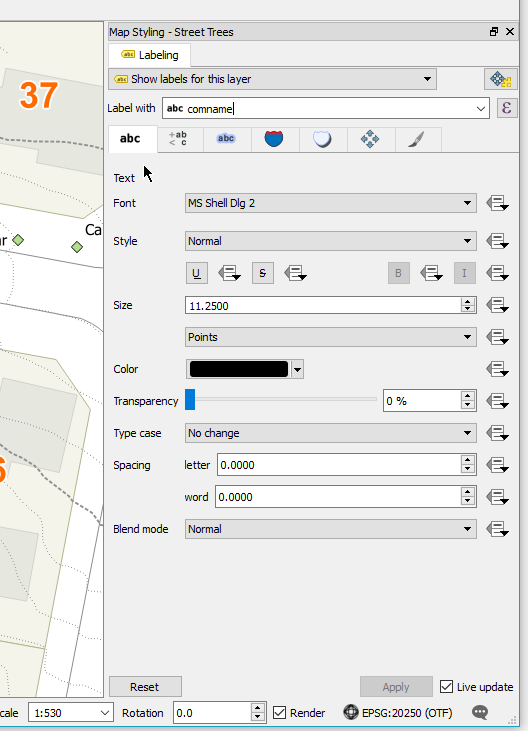
QGIS style dock – Part 2 – Plugin panels

In part 1 I talked about the new style dock and the in built functions it has in this post I would like to cover how you can extend that dock using plugin panels.

While building the dock it became evident that being able to add your own panels with be super neat, why lock the user to what styling controls we have built into core.

After one, or two, API iterations it is now possible to add your own panels to the style dock.

First we need to make a new widget using QgsLayerStylingPanel

class CustomPanel(QgsLayerStylingPanel):
    def __init__(self, layer, canvas, parent):
        super(CustomPanel, self).__init__(layer, canvas, parent)
        self.layer = layer

    def apply(self):
        pass

then we need to create a factory object (QgsLayerStylingPanelFactory) which will hold the metadata for the panel widget, things like icon, title, and the widget it self as required. The factory object looks like this:

class PanelFactory(QgsLayerStylingPanelFactory):
    def icon(self):
        return QIcon(r"F:\icons\SVG\book.svg")

    def title(self):
        return ""

    def supportsLayer( self, layer):
        return layer.type() == QgsMapLayer.VectorLayer

    def createPanel(self, layer, canvas, parent):
        return CustomPanel(layer, canvas, parent)

# Also make a instance and tell the style dock about it
# make sure you keep a instance of the the factory around
factory = PanelFactory()
iface.registerMapStylePanelFactory(factory)

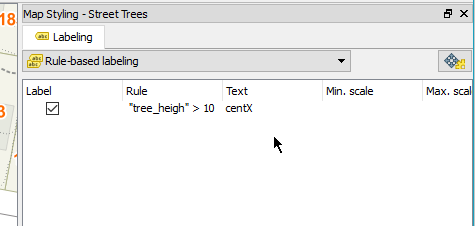
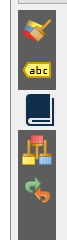
You can also see we have a supportsLayer() method. This must return True if the layer can be supported for the widget, if the layer isn’t support it’s not shown in the layer style dock. We also have the createPanel method which just returns the widget, you could also use this method to return different widgets based on layer type if you needed. This createPanel method will be called any time the item is selected in the left panel of the style dock. Using the above code we will see a new icon on the side panel

style

Remember, the create method is called any time this new item is selected.    If your widget is expensive to create you can create a cache here.

Now lets add some logic.  As an example I’m going to load the style xml and show it in the panel. Adding some logic to the __init__ method of the CustomPanel class

class CustomPanel(QgsLayerStylingPanel):
    def __init__(self, layer, canvas, parent):
        super(CustomPanel, self).__init__(layer, canvas, parent)
        self.layer = layer
        self.setLayout(QVBoxLayout())

        # Create the editor and set the xml from the layer.
        self.editor = QgsCodeEditorHTML()
        self.editor.setLexer(QsciLexerXML())
        doc = QDomDocument( "style" ) 
        rootNode = doc.createElement( "qgis" )
        doc.appendChild( rootNode )
        iface.activeLayer().writeStyle( rootNode, doc, "")
        xml = doc.toString()
        self.editor.setText(xml)
        self.layout().addWidget(self.editor)

xml

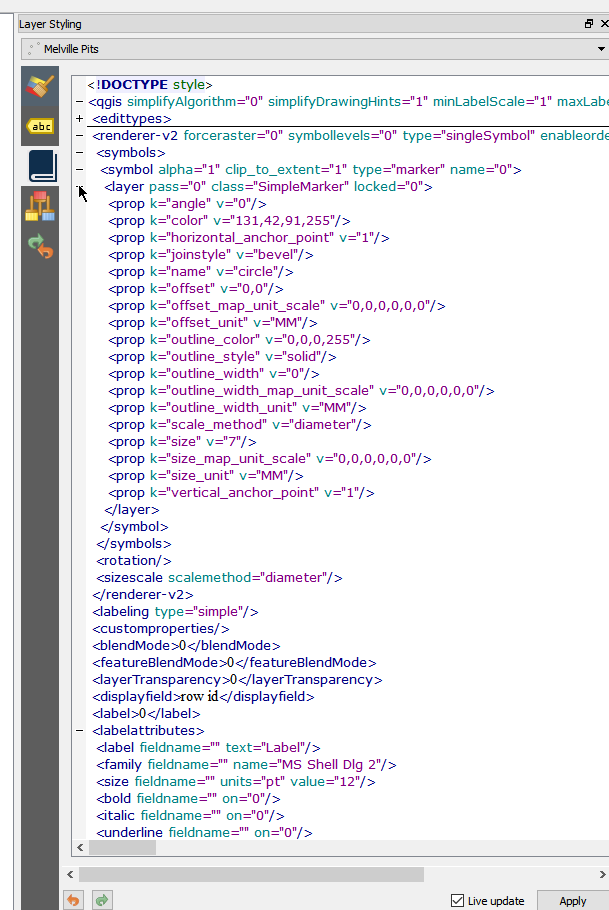
Nifty.  Now can we 1 UP it and make it live edit?  Sure can!  The style dock will call apply() whenever we raise the widgetChanged signal.  We can just connect this to the text changed event and add some logic to the apply method.

class CustomPanel(QgsLayerStylingPanel):
    def __init__(self, layer, canvas, parent):
        super(CustomPanel, self).__init__(layer, canvas, parent)
        .....
        self.editor.textChanged.connect(self.widgetChanged.emit)

    def apply(self):
        # Read the xml and set it back to the style.
        doc = QDomDocument( "style" ) 
        doc.setContent(self.editor.text())
        node = doc.documentElement()
        self.layer.readStyle(node, "")
        self.layer.triggerRepaint()

live

WINNING!

Pro Tip: Raise widgetChanged whenever you need to tell the style dock to trigger the apply method. The style state of the layer will also be saved to the undo stack so you don’t have to worry about that.

This is just an example, hand editing xml is well gross, but I’m sure you can see great uses for being able to expand the style dock.

QGIS style dock – Part 1 – Live Styles!

This post is part of a series exploring the new style dock.

  • Part 1 – Styles
  • Part 2 – Plugin pages
  • Part 3 – New panel API

A while ago did a post about the new style dock in QGIS. The first stage was getting labels working and then moving on to styles. After many iterations of the UIs and the APIs I’m pretty happy with the release state of the dock. We now have styles (vector and raster), labels, saved styles, undo redo, and plugin support (yep!)

Of all the features I have added to QGIS this is my favorite. Nothing has made me feel more productive then working on this feature and seeing the gains it allows in day to day work.

If you haven’t used the style dock yet I would strongly encourage you to grab the nightly QGIS builds and give it a crack, F7 to open anytime, or use the paint brush icon on the layers panel.   I’m not bragging when I say that it will change your life in QGIS for the better, it has become a part of my daily workflow. No going back!

Dock break down

breakdown

As you can see in the image there is a few main things in the dock, the layer selection, style options selector (come back to this later), undo/redo, live update and apply.

Live Updates

One of the key things for me when doing this dock was instant feedback. I really hated the open close, change, apply, repeat workflow of the old dialogs.  Every widget in the dock can request a redraw on change so you can see feedback instantly in the canvas.  This might not always be what you want so you can disable it for those cases and use manual apply.

Undo Stack

Live updates come with a risk. What happens if you apply something you didn’t mean. There is no cancel button. Well not to fear we now have a undo/redo stack.  Any style change will now add an entry to the style undo stack so you can rollback and forward any changes. Undo/Redo now allows for fearless style changes, so style away to your hearts content and rollback anything you don’t like.

I will also add that the undo stack is stored on the layer object itself, so closing the dock doesn’t clear the stack nor does changing the active layer. You can also access the stack via the Python bindings if needed.

Style Options

On the side of the dock we have the different style options.  These buttons change the style options in the main panel.

options
Vector Style Options
  • Style
  • Label
  • Saved styles
  • Undo/Redo
optionsraster
Raster Style Options
  • Style
  • Transparency
  • Histogram
  • Saved styles
  • Undo/Redo

The Saved Styles and Undo/Redo will always be the last in the stack regardless of the active layer type.

Style UIs (Note: GIF heavy section)

Almost all the widgets have been tweaked to allow for better dock layout. Widgets are now in a more uniform layout which flows better when moving around in the dock and just generally look better.

layout

When I talked about live updates before this applies to everything, even the data defined buttons.  Any changes in those will be reflected into the canvas without any extra clicks.

dd

Changing renderers is now simple and quick. You go from nothing to seeing instant results in seconds.

change

A excellent side effect of the live updates is workflows that were never exposed before and now possible. Using the graduated renderer histogram for example. As the histogram allows for live edits we can now update the map on the fly from adjusting the histogram.

hiso.gif

Style UIs (Raster)

As soon as I finished vectors it became pretty evident that raster layers were going to be the next main thing to move.   So the style dock fully supports raster styling.

raster

Undo/Redo

For the final trick. Here we have the undo/redo stack in action. Unlimited undo/redo  on all layers when changing styles. Fearless change he we come

undo

Trying to find a picture to sum up my feelings about the style dock and I think this fits

but of course I’m super bias.

Stay tuned for Part 2 where I talk about adding your own style panels to the style dock.

Speeding up QGIS build times with Ninja

As a developer, feedback is important when you are working.  The quicker you have the feedback the quicker you can fix the issues.  This doesn’t just apply to feedback from users/clients but also from your tooling.

Finding a new tool that increases my productivity is one of the best feelings, and this is one of those cases.   I was told about using Ninja for building instead Make, Visual Studio, Jom (Qt Build Tool).

If you are not a developer and don’t know what those tools are, they are what we use to build and compile all the code in QGIS.  If this step is slow the feedback loop is slow and it becomes annoying.  Improving this feedback loop greatly increases your workflow and happiness, and by happiness I really do mean that.

Ninja is one of these tools that did this. It’s optimized to be fast.  It does very little work in order to be faster any time it can.  Ninja was built by a developer on the Google Chrome team in order to improve their build times (read the history here)

Building QGIS with Ninja is super easy:

Install Ninja from package manager or using the ninja.exe (the whole tool is a single exe) if you are on windows

cd qgis-src
mkdir ninja-build
cd ninja-build
ccmake -GNinja ..
ninja

Done

You can build just the targets you need using

ninja qgis
ninja pycore

etc

The ccmake setup generates the ninja.build file that ninja uses. Myself and Matthias Kuhn have already patched our QGIS cmake files to handle any odd things that got generated – only a handful of things which was nice

The best thing I find about Ninja is how smart it is on knowing if it needs to build something or not, and this is the point that I find other tools fail on. They spend ages wasting time looking for what to do. Ninja knows it in a instant.

When running Ninja with no code changes I get this (on Windows):

21:18:54: Running steps for project qgis2.15.0...
21:18:54: Starting: "C:\QtCreator\bin\ninja.exe" qgis
ninja: no work to do.
21:18:54: The process "C:\QtCreator\bin\ninja.exe" exited normally.
21:18:54: Elapsed time: 00:00. 

Not even a second. If I did the same with VS or JOM I could have written this post before it finished working out what to do.

Here is what happens changing a single file:

21:19:48: Running steps for project qgis2.15.0...
21:19:48: Starting: "C:\QtCreator\bin\ninja.exe" qgis
[1/6] Building CXX object src\core\CMakeFiles\qgis_core.dir\raster\qgshillshaderenderer.cpp.obj
[2/6] Linking CXX shared library output\bin\qgis_core.dll
21:19:51: The process "C:\QtCreator\bin\ninja.exe" exited normally.
21:19:51: Elapsed time: 00:03.

It’s super impressive. Even a cold build on Windows is shorter now. On Linux it’s even faster due to faster disk access in Linux vs Windows

If you build QGIS form source I would highly recommend giving it a crack because I know you will love it.

Styling maps in QGIS is better when it’s interactive

I’m sure you are all well aware of my hate of blocking dialogs, and when it comes to styling QGIS has a few and they annoy me to no end. With new fancy map making tools like MapBox and CartoDB all having nice non blocking styling options it’s about time QGIS followed suit to bring better control and faster workflows to users.

The first stage of the dock is complete, pending feedback of course, and merged into master.

Introducing the map styling dock:

2016-04-19 20_27_00-Action center

Having the style (label only at the moment) options in a dock widget opens up some really nice workflows to map styling.

Firstly, now you don’t have to do the Open -> Change Setting -> Apply -> Close -> Open dance each time you want to change a layer style.  The dock is linked to the active layer in the legend so you can move around freely, update settings, and move on.

Second, we can now have a great workflow and allow for live updating. Yes you did read that right, it will live update the map as you change values. How bloody great is that!  Reducing the feedback loop is always the best.  If it can be done live, do it live.  There is a Reset button if you make a mistake.

Third, all styling options will now live in a single location going forward. Once we have moved style, diagrams, blend modes, it will be a one stop shop for styles with no annoying dialogs getting in the way.

In QGIS 2.14 we also have this awesome feature for rule based labels, however that added another dialog, and I wasn’t going move to a dock just to have another dialog block me two steps down the road. So now all the rules based labels dialogs are panels inside the main dock. When adding a new rule it will show the rule editor, and the list when not.  Remember how I said the dock updates the map live, well that also applies when you add/update rules.  The dock will update the canvas as the rule changes even before you hit save on the rule

2016-04-19 20_48_36-Action center

2016-04-19 20_48_28-Action center

The new styling dock is in master now, although might not be in the nightly build for a day or so.

You can check out some videos of the dock in action here:

Super keen on any feedback and ideas anyone might have.  Give it a try and let me know what you think.

EDIT: I would also like to add that what I have started/done is only possible because of the great work that has been done before me. Big thanks to all the people that have done work to enable me to make this feature,  label settings, threaded rendering, data defined buttons, etc.

UIs are for the weak. Welcome to ASCII QGIS land

Have you ever thought “gee I wish I could have a ASCII  QGIS map viewer for console use.  I’m so over these fancy UIs with their fancy graphics, fonts, and icons”.

No?

Anybody?

You are still reading? OK good I thought I lost you.

Anyway. Here is a fun idea. A ASCII QGIS map viewer that renders your project files in a console window (with colour possible).  Still with me?

This project was mainly just a bit of fun to play with the curses Python library and QGIS. What started off as a random idea on the train seems to have turned into full “usable” thing, if viewing a project and the legend is considered usable.

If you are still with me and itching to see it in action here it is.  In all the ASCII glory

Nifty!

What can it do so far?

  • Load project
  • Pan
  • Zoom
  • Set colour mode on/off

QGIS

The code is up at https://github.com/NathanW2/ascii_qgis (or http://nathanw2.github.io/ascii_qgis/)

It’s a bit of a fun side project at the moment so you might find bugs as I have only tested it on my machine.

Follow the README on github for notes on running.

Have fun.


Good news for QGIS MapInfo users

So some good news for QGIS users who also need/want to use MapInfo.  QGIS via GDAL 2.0 can support MapInfo TAB file editing. In all older versions of GDAL there was only support for read and/or write but not both.

MapInfo TAB editing has been supported in GDAL 2 but up until this point QGIS has only be built against GDAL 1.xx.  GDAL 2.x is now the default GDAL release in OSGeo4w.

From Jurgen:

2.0.2 is now the default GDAL in OSGeo4W and the nightlies (qgis-ltr-dev,
qgis-rel-dev and qgis-dev) already picked it up.

With the next release the regular packages (2.14 and 2.8) will also be updated
to use it

Even if you don’t want to make the switch to full QGIS you can now use both bits of software and edit in both.

QGIS will still only support a single geometry type per layer so if you open a mixed tab file you will get the geometry type selector.  You can load the layer 3 times if you need the 3 different geometry types.


Not always about new features

I love a good feature just as much as the next person but sometimes it’s great to fix a small workflow issue that has bugged you for the longest time.

If you have ever seen this kind of dialog you will know what I mean

error

The good old Python error dialog in QGIS.  The dialog is there to tell you that an exception was raised in Python somewhere and would dump out the error for you to debug it.   One big issue with this dialog though.  It’s blocking.  Blocking dialogs are really bad.   As a user, the blocking dialog means a broken workflow. Worst of all, there really is nothing you can do about it because the only thing you can do is close.

This dialog has now been replaced with a message bar if something goes wrong in Python code.  The message bar is non blocking and lets you continue working even if something didn’t work correctly.

message

The message bar has two buttons.  One will open the stack trace dialog to see the error in more detail. The other button opens the log window.

dialog

The message bar will only show a single error message for each type of error even if there are multiple exceptions in a row. A good example of this is an error in a mouse move event handler causing a error on each mouse move.

UI theme support now core in QGIS

I enjoy using the dark UI theme for QGIS so much I figured why not make it a core feature. In the next version of QGIS if you head to the options screen you can now find a UI Theme option.

Options | General_037

The default dark theme is called Night Mapping for all those late night mapping jobs that you do, or if you just like dark UI themes.

QGIS b789fab_029

Selection_031

Selection_034

Something you will notice with this theme is the custom icons for the layer visibility. Pretty nifty! Here is how it is done

Creating new themes

To create a new theme simply make a new folder in .qgis2\themes\ with the name of the theme you want and create a style.qss file inside there. Check out the default themes for an example

Follow the Qt style sheet guides to see what can be styled.

Something I have added on top of the normal style sheets is variable support. Variables can be declared in a variables.qss file in the theme folder.

Here is an example of some variables:

@background: #323232
@text: #aaa
@selection: #507098
@menuback: #444
@highlight: #ffaa00

Now in style.qss we can do this:

QWidget
{
color: @text;
background-color: @background;
}

Great for not having to repeat your self or quick updating in a single place. When the theme is applied via the Options dialog or via the API it will replace the variables in style.qss using variables.qss. The result file is called style.qss.auto

Needs some tweaks

The default dark theme is a collection of stuff I have found around the net and stuff I have added myself. It’s far from prefect and I would love help to make it the best dark theme for QGIS. If you have another theme you think would make a good default one open a pull request on GitHub

Enjoy

Accessing composer item properties via custom expressions in QGIS

So here is a neat trick. Lets say you wanted to access the scale of a composer map to make it part of a label. The scale bar can already be set to numeric to show the number value but what if it needs to be part of an existing label with other text. Not to fear, expression functions are here.

  • Create a new composer. Add the map frame and a label.
  • Set the item ID of the map frame to something you can remember, lets just use themap
  • Select the label and add some text
  • Click Insert Expression

Now for the cool part

  • Select Function Editor
  • Click New File. Give the file a new name and hit save. I called it composer functions.

In the code editor paste this code:

from qgis.utils import iface
from qgis.core import *
from qgis.gui import *

@qgsfunction(args="auto", group='Composer')
def composeritemattr(composername, mapname, attrname, feature, parent):
    composers = iface.activeComposers()
    # Find the composer with the given name
    comp = [composer.composition() for composer in composers 
                if composer.composerWindow().windowTitle() == composername][0]
    # Find the item
    item = comp.getComposerItemById(mapname)
    # Get the attr by name and call 
    return getattr(item, attrname)()
  • Click Run Script

run

Now in your label use this text:

Scale: [% composeritemattr('Composer 1', 'themap', 'scale')%]

Update the Composer 1 to match your composer name, and the themap to match your item ID.

and like magic here is the scale from the map item in a label:

2015-05-21 22_00_09-Composer 1

Check the expression error section if the label doesn’t render

error


Filed under: Open Source, qgis Tagged: composer, python, qgis

PSA: Please use new style Qt signals and slots not the old style

Don’t do this:

self.connect(self.widget, 
             SIGNAL("valueChanged(int)"), 
             self.valuechanged)

It’s the old way, the crappy way. It’s prone to error and typing mistakes. And who really wants to be typing strings as functions and arg names in it. Gross.

Do this:

self.widget.valueChanged.connect(self.valuechanged)
self.widget.valueChanged[str].connect(self.valuechanged)

Much nicer. Cleaner. Looks and feels like Python not some mash up between C++ and Python. The int argument is the default so it will use that. If you to pick the signal type you can use [type].

Don’t do this:

self.emit(SIGNAL("changed()", value1, value2))

Do this

class MyType(QObject):
   changed = pyqtSignal(str, int)

   def stuff(self):
       self.changed.emit(value1, value2)

pyqtSignal is a type you can use to define you signal. It will come with type checking, if you don’t want type checking just do pyqtSignal(object).

Please think of the poor kittens before using the old style in your code.


Filed under: pyqt, python, qgis Tagged: pyqt, qgis, qt

A interactive command bar for QGIS

Something that has been on my mind for a long time is a interactive command interface for QGIS.  Something that you can easily open, run simple commands, and is interactive to ask for arguments when they are needed.

After using the command interface in Emacs for a little bit over the weekend – you can almost hear the Boos! from heavy Vim users :) – I thought this is something I must have in QGIS as well.  I’m sure it can’t be that hard to add.

So here it is.  A interactive command interface for QGIS.

commandbar

commandbar2

The command bar plugin (find it in the plugin installer) adds a simple interactive command bar to QGIS. Commands are defined as Python code and may take arguments.

Here is an example function:

@command.command("Name")
def load_project(name):
    """
    Load a project from the set project paths
    """
    _name = name
    name += ".qgs"
    for path in project_paths:
        for root, dirs, files in os.walk(path):
            if name in files:
                path = os.path.join(root, name)
                iface.addProject(path)
                return
    iface.addProject(_name)

All functions are interactive and if not all arguments are given when called it will prompt for each one.

Here is an example of calling the point-at function with no args. It will ask for the x and then the y

pointat

Here is calling point-at with all the args

pointatfunc

Functions can be called in the command bar like so:

my-function arg1 arg2 arg2

The command bar will split the line based on space and the first argument is always the function name, the rest are arguments passed to the function. You will also note that it will convert _ to - which is easier to type and looks nicer.

The command bar also has auto complete for defined functions – and tooltips once I get that to work correctly.

You can use CTRL + ; (CTRL + Semicolon), or CTRL + ,, to open and close the command bar.

What is a command interface without auto complete

autocomplete

Use Enter to select the item in the list.

How about a function to hide all the dock panels. Sure why not.

@command.command()
def hide_docks():
    docks = iface.mainWindow().findChildren(QDockWidget)
    for dock in docks:
        dock.setVisible(False)

alias command

You can also alias a function by calling the alias function in the command bar.

The alias command format is alias {name} {function} {args}

Here is an example of predefining the x for point-at as mypoint

-> alias mypoint point-at 100

point-at is a built in function that creates a point at x y however we can alias it so that it will be pre-called with the x argument set. Now when we call mypoint we only have to pass the y each time.

-> mypoint
(point-at) What is the Y?: 200

You can even alias the alias command – because why the heck not :)

-> alias a alias
a mypoint 100

a is now the shortcut hand for alias

WHY U NO USE PYTHON CONSOLE

The Python console is fine and dandy but we are not going for a full programming language here, that isn’t the point. The point is easy to use commands.

You could have a function called point_at in Python that would be

point_at(123,1331)

Handling incomplete functions is a lot harder because of the Python parser. In the end it’s easier and better IMO to just make a simple DSL for this and get all the power of a DSL then try and fit into Python.

It should also be noted that the commands defined in the plugin can still be called like normal Python functions because there is no magic there. The command bar is just a DSL wrapper around them.

Notes

This is still a bit of an experiment for me so things might change or things might not work as full expected just yet.

Check out the projects readme for more info on things that need to be done, open to suggestions and pull requests.

Also see the docs page for more in depth information


Filed under: Open Source, python, qgis Tagged: plugin, pyqgis, qgis

Serving live tiles from a QGIS project via TileStache

I’m more then likly way behind the 8 ball here, aren’t all the cool kids doing tiles these days, but regardless I thought it was pretty cool to share. The other day I found TileStache a neat little Python app that can generate, cache, and serve tiles from a list of providers. The normal way is via Mapnik (and others) to render a image, there is also a vector provider which can render vector tiles. Nifty.

A while ago I wrote qgis2img which can generate an image for project, or layers, and export it for you. It serves two roles, one is to benchmark a project and layer render times, the other as a simple export tool. I thought it would be pretty cool to be able to export tiles from it but was I never really up for working on the math and all the logic so I left it. Then I found TileStache.

The best part about TileStache, apart from that it’s Python, is that you can make your own providers for it, and the API is dead easy

class Provider:
    def __init__(self, layer):
        self.layer = layer

    def renderArea(self, width, height, srs, xmin, ymin, xmax, ymax, zoom):
        pass

How easy is that! Just implement one method and you are good to go. So that’s what I did. I created a custom provider that will load a QGIS project and render out images. Thanks to the work done by Martin from Lutra Consulting for the multithreaded rendering in QGIS 2.4 this is a hell of a lot easier then it used to be.

Ignoring some of the setup code to create and load the session the whole export logic is in these few lines

   extents = QgsRectangle(xmin, ymin, xmax, ymax)
   settings.setExtent(extents)
   settings.setOutputSize(QSize(width, height))
   layers = [layer.id() for layer in project.visiblelayers()]
   image, rendertime = qgis2img.render.render_layers(settings, layers, RenderType=QgsMapRendererSequentialJob)

with render_layers defined as

def render_layers(settings, layers, RenderType):
    settings.setLayers(layers)
    job = RenderType(settings)
    job.start()
    job.waitForFinished()
    image = job.renderedImage()
    return image, job.renderingTime()

As this is build on top of my qgis2img tool you can see the full code here

Running it is as simple as installing TileStache, cloneing qgis2img, updating tilestache.cfg, and running the server.

$ pip install TileStache
$ git clone https://github.com/DMS-Aus/qgis2img.git
$ cd qgis2img

In tilestache.cfg you can just change the path to the project to render:

{
  "cache": {
    "name": "Test",
    "path": "/tmp/stache"
    },
  "layers": {
    "qgis":
    {
      "provider": {"class": "qgis2img.tilestache:Provider",
                   "kwargs": {"projectfile": "data/test.qgs"}
                  }
    }
  }
}

Then run the server

$ tilestache-server /path/to/tilestache.cfg

Note: The path to the .cfg file seems to have to be the full path. I had issues with relative paths working.

To view the tiles you can load the preview URL that TileStache provides or you can use it in something like LeafLet

<!DOCTYPE html>
<html>
<head>
    <title>QGIS Tiles WOOT!</title>
    <meta charset="utf-8" />
    <meta name="viewport" content="width=device-width, initial-scale=1.0">
    <link rel="stylesheet" href="http://cdn.leafletjs.com/leaflet-0.7.3/leaflet.css" />
</head>
<body>
    <div id="map" style="position: absolute; top: 0; right: 0; bottom: 0; left: 0;"></div>
    <script src="http://cdn.leafletjs.com/leaflet-0.7.3/leaflet.js"></script>
    <script>

        var map = L.map('map').setView([51.505, -0.09], 5);

        L.tileLayer('http://10.0.0.11:8080/{id}/{z}/{x}/{y}.png', {
            maxZoom: 18,
            id: 'qgis'
        }).addTo(map);

    </script>
</body>
</html>

And the result is live tiles from a QGIS project.

tiles

Winning!

Some Caveats

  • The provider currently doesn’t use metatiles so labels and points will get chopped at tile edge. I have working code for this but haven’t pushed it yet.

  • I don’t kill the QGIS session that I create. Creating a session for each request was really expensive so I just keep it around.

  • I only load the project once so any changes mean starting and stopping the server. Wouldn’t be hard to add a file watcher for this.

  • It’s just me using this at home for fun, I have no idea on how it would scale, or even if it would, but I would be keen to hear feedback on that theory.


Filed under: qgis

Exporting QGIS symbols as images

Ever wanted to export your QGIS symbols as images? Yes. Well here is some Python code that will let you do just that:

from PyQt4.QtCore import QSize
from PyQt4.QtGui import QImage, QPainter

style = QgsStyleV2.defaultStyle()
names = style.symbolNames()
size = QSize(64, 64)

for name in names:
    symbol = style.symbol(name)
    if not symbol.type() == QgsSymbolV2.Marker:
        continue

    image = QImage(size, QImage.Format_ARGB32_Premultiplied)
    image.fill(0) 
    painter = QPainter(image)
    symbol.drawPreviewIcon(painter, size)
    painter.end()
    image.save(r"C:temp{}.png".format(name), "PNG")

Or in 2.6 it’s even easier:

from PyQt4.QtCore import QSize
from PyQt4.QtGui import QImage, QPainter

style = QgsStyleV2.defaultStyle()
names = style.symbolNames()
size = QSize(64, 64)

for name in names:
    symbol = style.symbol(name)
    if not symbol.type() == QgsSymbolV2.Marker:
        continue

    image = symbol.asImage(size)
    image.save(r"C:temp{}.png".format(name), "PNG")

Bam!

symbols

Why? Because we can.


Filed under: qgis

Australian QGIS User Forums - Wrap up

I had a feeling this year was going to be a good one for QGIS. The recent success of the first Australian QGIS User Group in Perth, and the most recent one in Melbourne can only reinforce this. Both events had a great turn out of around fifty people.

The Perth event was run as three presentations followed by a discussion session.

  • Mapping Projects with QGIS (Jeremy Taylor - City of Belmont)

  • Custom Plugin Development (Shane French - Department of Environment and Conservation)

  • All the New Cool Stuff in QGIS 2.0 (Nathan Woodrow - Digital Mapping Solutions)

With a bit more time to prepare we added a workshop session to the Melbourne event:

Workshops

  • Styling and managing style libraries (Chris Scott - Digital Mapping Solutions)

  • Working with the composer (Nathan Woodrow - Digital Mapping Solutions)

  • Custom QGIS forms and Python (Nathan Woodrow - Digital Mapping Solutions)

  • General Q&A

Presentations

  • A GIS officers journey into the light (Barrett Higman - Alpine Shire Council)

  • QGIS in Victoria Police (Nyall Dawson - Victoria Police)

  • All the New Cool Stuff in QGIS 2.0 (Nathan Woodrow - Digital Mapping Solutions)

There was a great mix of users, even a few non users keen to check QGIS out for the first time. I was extremely happy with how both days turned out and the feedback so far has been fantastic. A massive thanks must go to DMS who sponsored both events.

Alt Text

I also thought I might give filming and screen recording my workshop a go. Seemed to turn out alright, for a first attempt anyway. A few mistakes here and there but live things never go 100% :)

{% youtube Z84GMcQV3EM %}

On a side note it was also a pleasure to be able to talk about my adventures with QGIS at the Melbourne Open GIS meetup. Big thanks to Simon for asking me to talk.

Quick Tip: Using coalesce to check for NULL or zero

Here is a quick tip that you can use in QGIS expressions, T-SQL, or even PostgresSQL.

Normally if you have a column that you need query on to find all the NULL or zeros you have to do something like this:

COLA IS NULL OR COLA = 0

Well that isn’t too bad. Sure yeah it’s fine for one column but what if you have three and you need to check them all together

(COLA IS NULL OR COLA = 0) AND (COLB IS NULL OR COLB = 0) AND (COLC IS NULL OR COLC = 0)

That is pretty long and gets hard to read pretty quick.

To cut this down we can use the coalesce function – T-SQL, PostgresSQL, QGIS Expression. The coalesce function returns the first non-NULL value out of an expression, or list of values. So if you do something like this:

coalesce(NULL, "A", 0)

You will get “A” because the first value is NULL. The function will just evaluate each value/expression until something turns up that isn’t NULL.

Using that logic we can replace the above function with the following:

coalesce(COLA, 0) = 0 AND coalesce(COLB, 0) = 0 AND coalesce(COLC, 0) = 0

To me that is a lot clearer and readable.


Filed under: qgis Tagged: qgis, sql

QGIS gets Oracle support!

Seems this is a good day for QGIS Oracle users. According this commit made by Jürgen QGIS now has built-in Oracle support. Win!

Native Oracle support can now see QGIS being opened up to a wider user base yet again. A large user base normally means more people willing to sponsor awesome new features and bug fixes. Having seen the growth in the user base from having native MS SQL Server 2008+ support I can imagine what it will be like with Oracle.

The list of formats QGIS can open and edit is getting larger and larger with each release. Is there a future for vendor lock in? I can’t see it.

Standard disclaimer about latest dev build and new features :)


Filed under: Open Source, qgis Tagged: FOSSGIS, gis, Open Source, oracle, osgeo, qgis, qgis-editing, Quantum GIS

New QGIS PDF and HTML manuals

A quick update from the QGIS documentation team today on the mailing list. The QGIS 1.8 manual is now available in HTML and PDF form.

HTML manual can be found at:
http://docs.qgis.org/html/en/docs/user_manual/index.html

PDF manual at:
http://docs.qgis.org/pdf/QGIS-1.8-UserGuide-en.pdf

This has been part of an ongoing effort from the documentation team since before the 1.8 release to bring our all our documentation into reStructedText rather then LaTeX. Moving to reStructedText allows quicker updates and a larger range of final output formats.

I would like to thank everyone who has been involved in this process as I know what a grueling process updating documentation can be.

Community notice

Just remember you don’t have to be a programmer to contribute to an open source project. If you think you could contribute to the updating of the QGIS documentation please contact the team on the mailing list.


Filed under: Open Source, qgis Tagged: FOSSGIS, gis, Open Source, osgeo, qgis, Quantum GIS

Back to Top

Sustaining Members