Something that I always find interesting is how people are using different open source tools to get their work done. This post attempts to outline how I/we are using QGIS at work for different projects.
Kerb mapping, condition, and defect pickup
This project is currently being done by a 67 year old foreman who has worked for the council for a very long time and has great knowledge of the town. QGIS, with the main working layers stored in PostGIS, was setup so that he can:
Digitize kerb lines from aerial photos.
Split the existing kerb lines into segments depending on different asset rules.
Give each segment an overall condition rating.
Add defect points along the each kerb segment e.g. broken, lifted, etc,
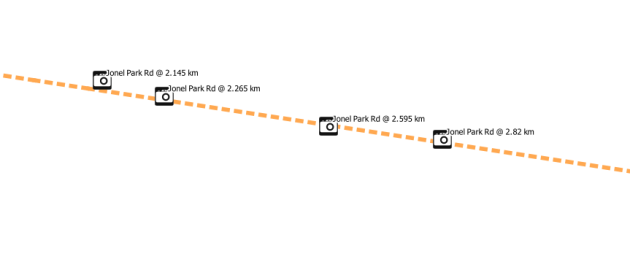
Each defect point is snapped to the underlying kerb line and chainages (distance along line) is generated using a update statement at the end of the project (could be done using a insert trigger if needed) using STlinelocate_point(line, point).

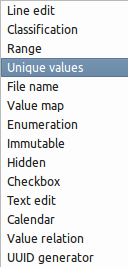
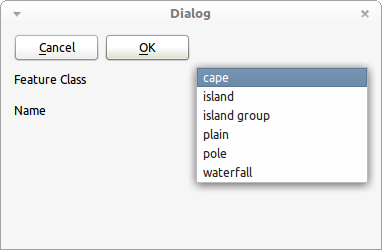
Overall QGIS has been great for this project. The built in data entry forms have been a great help to allow fast and correct data entry. Each form has four drop downs all with present values and descriptions to aid in data entry.
Flood damaged claim maps
We recently suffered, like the rest of Queensland, some really major flooding which caused large amounts of damage to our road infrastructure. We got off pretty light compared to some places, nevertheless we still had a lot of damaged assets. And so began the process of collecting data that could be used for state government funding claims.
Anyway, onto the QGIS bit. QGIS was installed on one of the main engineers computers in order for him to make maps for each claim. Having the ability for him to have one map window but multiple frames in the composer helped him to create multiple views of the same data with ease.
In total there are 42 QGIS project files with a main project file which served the base layers to the other projects, using the cool Embed Layers and Groups feature. This means any change in main base project was reflected up(down?) to the other projects next time they are opened. The main project file has things like, property layer; normal road layers, with labels; road layer with roads for claims. The other 42 projects have a filtered, and styled, road layer to only show roads in that batch, and its composers (print layouts).
Normally we would use MapInfo for this kind of thing but consider this: There are at least 3 print layouts per claim, each layout could have more then one map frame. Now with MapInfo only being able to have a 1:1 ratio between the map window and the map frame in the layout you would need at least 3 map windows per claim. Quick calc:
42 * 3 = 126+n map windows + 126 print layouts (n = extra map frames in layouts)
Each map window has its own copy of every layer, making change once apply every where changes hard. This of course doesn't apply to styles as they are stored in the .map (tab) file, but does for labels, style overrides, etc. I'll pass.
QGIS is no means perfect for printing or print layouts but the 1:N map window to map frame ratio worked really well for this project. The styling options in QGIS also helped to change the display of the map depending on what was needed to be shown quickly, one even used the rule-based rendering.
You get the point.
Moving on.
Processing GPS photos with road chainages
This one I am quite proud of. It's nothing fancy but still saves a lot of time. While not really QGIS only but a combination of QGIS+Spatialite it process GPS photos and assigns them a road name and chainage.
The issue: A large influx of GPS photos for the different flood damage projects and the need to process them quickly so that they got assigned to the correct road and chainage. Now you can map GPS photos easy enough but then you still have to go to each one and assign a road name, chainage, and move it into the correct folder. To hell with doing that by hand, this is why we invented GIS.
The result is a little (140 line) python script that:
extracts the coordinates from each photos,
finds the closest (within tolerance) road distance node_ (distance nodes are generated at 5m intervals along the road, around 800,000 in total for the whole shire)_,
gets the road name, locality, and chainage for that node,
creates a folder with that road name,
renames the photo with {name} @ {chainage},
moves it into the road name folder it is assign to.
inserts a record for that photo into the spatialite database that can be viewed in QGIS.

The Spatialite database has a spatial index on the road distance nodes and with that in place it can process 148 photos in 8 seconds. Not too bad at all. Now all we have to do to process the photos is stick them into a special folder and run process.bat.
Porting our planning scheme maps
I have been involved in creating, and maintaining, our planning scheme maps for the council. It's been a pretty fun project, apart from the constant moving target that is the state planning specifications, but I digress.

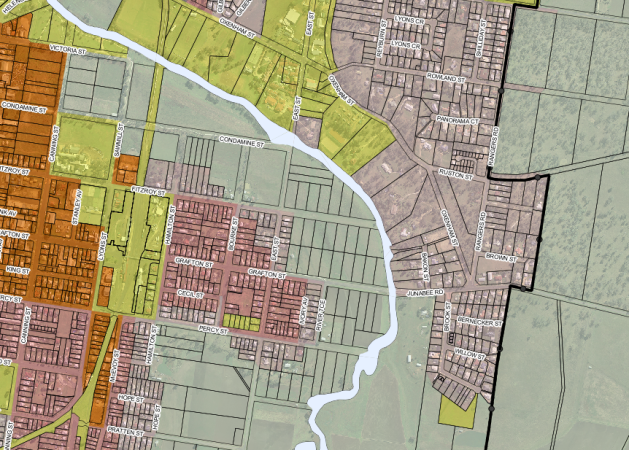
This project was done, and still is, in MapInfo. While there is nothing technically wrong with that, it has become a bit more of a pain to maintain then one would hope. The planning scheme is not just one map but rather a series of different maps all with different scales and requirements. I'm sure by now you can start to see the issues that can arise:
No dynamic scale bar for layouts (not even a scale bar object rather just text and boxes made to look like a scale bar. With no group items feature moving these around is a pain).
1:1 map window to map frame means excessive map windows when the data is all the same with just different views.
Legends don't support ordering, adding items, or groups.
With no embedding base maps feature like in QGIS it's hard to change one thing and apply it to all the map windows/workspaces.
The specifications also ask for lines with symbols along them to show things like bikeways, footpaths etc, something that can't be done in MapInfo, well it can by using the line style editor but I would rather stab myself in the eye.
The one thing I haven't fully worked out how to do in QGIS yet is fully automate the printing process. Currently I open MapInfo using a batch file and pass it a workspace and MBX which prints the layouts and exits. I do this for each map type. In QGIS I have a few options:
Create a plugin that runs though each project and prints off its composers.
Create a python script that runs from a batch file using qgis.core and qgis.gui QGIS python bindings.
add a --code option to the command line of QGIS so that you could run: qgis.exe --noplugins --code "print.py", which would open QGIS and run the python code and exit.
I'm yet to explore what option is the best for this project but I'll get back to you on that. Once I have the above issue sorted I plan on creating the maps in QGIS to see how it would turn out (time permitting)
Custom asset data collection program
This one would have to be my favourite. I really love programming (most days), and being able to create our own data collection program using QGIS and MS SQL 2008 has been great.
While it is only very very young I'm already seeing some great potential. Using an open source base (apart from MS SQL) has given us a lot of power, power to change stuff that we don't like (which so far has been one minor bug), and the power to get exactly what we need.
I can't talk about this project a lot as it is only very new and still only in design/testing/prototyping stage.
The main things for me are:
Ease of use. If I get asked how to do something over and over I have failed the users. And no 100 page training manuals.
Fast
No menus, or right-click menus! I'm a power user and even I hate navigating menus on a tablet.
Easy to build custom forms
Online/Offline syncing
Ease of use. Oh did I say this already!? Well it's important.
Easy to configure by admins.
Limited use of dialogs. It's NOT ok for an app to ask users to confirm 100 dialogs to do one thing.
Overall I think using QGIS and PyQt I can hit all the targets listed above quite well. In fact I know I can because I have already hit most of the them in the last couple of weeks.
Summary
So that is my list of QGIS uses in my local government situation, hopefully it wasn't TL;DR and you found it interesting. I'm sure there will be plenty more to add at the end of 2012.


