Related Plugins and Tags

QGIS Planet

Using QGIS in local government

Something that I always find interesting is how people are using different open source tools to get their work done.  This post attempts to outline how I/we are using QGIS at work for different projects.

Kerb mapping, condition, and defect pickup

This project is currently being done by a 67 year old foreman who has worked for the council for a very long time and has great knowledge of the town.   QGIS, with the main working layers stored in PostGIS, was setup so that he can:

  • Digitize kerb lines from aerial photos.
  • Split the existing kerb lines into segments depending on different asset rules.
  • Give each segment an overall condition rating.
  • Add defect points along the each kerb segment e.g. broken, lifted, etc,

Each defect point is snapped to the underlying  kerb line and chainages (distance along line) is generated using a update statement at the end of the project (could be done using a insert trigger if needed) using ST_line_locate_point(line, point).

Defect points coloured by risk captured against the kerb line

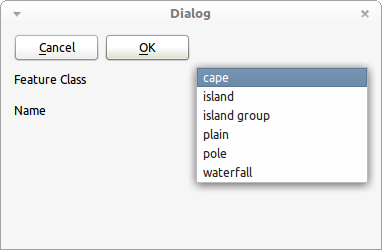
Overall QGIS has been great for this project.  The built in data entry forms have been a great help to allow fast and correct data entry. Each form has four drop downs all with present values and descriptions to aid in data entry.

Flood damaged claim maps

We recently suffered, like the rest of Queensland, some really major flooding which caused large amounts of damage to our road infrastructure. We got off pretty light compared to some places, nevertheless we still had a lot of damaged assets.  And so began the process of collecting data that could be used for state government funding claims.

Anyway, onto the QGIS bit.  QGIS was installed on one of the main engineers computers in order for him to make maps for each claim.  Having the ability for him to have one map window but multiple frames in the composer helped him to create multiple  views of the same data with ease.

In total there are 42 QGIS project files with a main project file which served the base layers to the other projects, using the cool Embed Layers and Groups feature.  This means any change in main base project was reflected up(down?) to the other projects next time they are opened.  The main project file has things like, property layer; normal road layers, with labels; road layer with roads for claims.   The other 42 projects have a filtered, and styled, road layer to only show roads in that batch, and its composers (print layouts).

Normally we would use MapInfo for this kind of thing but consider this: There are at least 3 print layouts per claim, each layout could have more then one map frame.  Now with MapInfo only being able to have a 1:1 ratio between the map window and the map frame in the layout you would need at least 3 map windows per claim.  Quick calc:

42 * 3 =  126+n map windows + 126 print layouts (n = extra map frames in layouts)

Each map window has its own copy of every layer, making change once apply every where changes hard.  This of course doesn’t apply to styles as they are stored in the .map (tab) file, but does for labels, style overrides, etc.   I’ll pass.

QGIS is no means perfect for printing or print layouts but the 1:N map window to map frame ratio worked really well for this project.  The styling options in QGIS also helped to change the display of the map depending on what was needed to be shown quickly, one even used the rule-based rendering.

You get the point.
Moving on.

Processing GPS photos with road chainages

This one I am quite proud of.  It’s nothing fancy but still saves a lot of time.  While not really QGIS only but a combination of QGIS+Spatialite it process GPS photos and assigns them a road name and chainage.

The issue: A large influx of GPS photos for the different flood damage projects and the need to process them quickly so that they got assigned to the correct road and chainage.  Now you can map GPS photos easy enough but then you still have to go to each one and assign a road name, chainage, and move it into the correct folder.  To hell with doing that by hand, this is why we invented GIS.

The result is a little (140 line) python script that:

  1. extracts the coordinates from each photos,
  2. finds the closest (within tolerance) road distance node (distance nodes are generated at 5m intervals along the road, around 800,000 in total for the whole shire),
  3. gets the road name, locality, and chainage for that node,
  4. creates a folder with that road name,
  5. renames the photo with {name} @ {chainage},
  6. moves it into the road name folder it is assign to.
  7. inserts a record for that photo into the spatialite database that can be viewed in QGIS.
The Spatialite database has a spatial index on the road distance nodes and with that in place it can process 148 photos in 8 seconds.  Not too bad at all. Now all we have to do to process the photos is stick them into a special folder and run process.bat.

Porting our planning scheme maps

I have been involved in creating, and maintaining, our planning scheme maps for the council.  It’s been a pretty fun project, apart from the constant moving target that is the state planning specifications, but I digress.

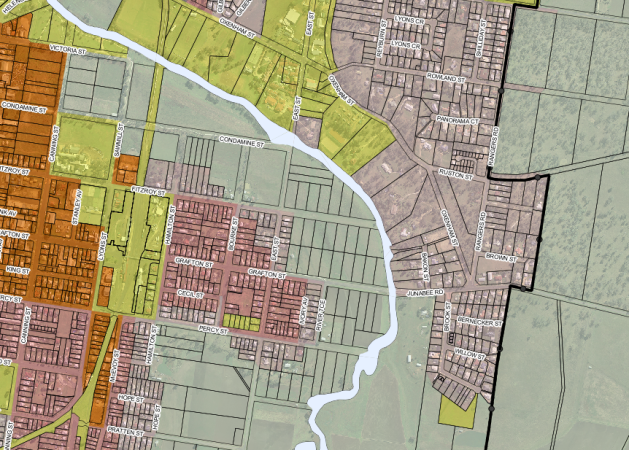
Planning scheme in QGIS

This project was done, and still is, in MapInfo. While there is nothing technically wrong with that, it has become a bit more of a pain to maintain then one would hope.  The planning scheme is not just one map but rather a series of different maps all with different scales and requirements.  I’m sure by now you can start to see the issues that can arise:

  1. No dynamic scale bar for layouts (not even a scale bar object rather just text and boxes made to look like a scale bar. With no group items feature moving these around is a pain).
  2. 1:1 map window to map frame means excessive map windows when the data is all the same with just different views.
  3. Legends don’t support ordering, adding items, or groups.
  4. With no embedding base maps feature like in QGIS it’s hard to change one thing and apply it to all the map windows/workspaces.
The specifications also ask for lines with symbols along them to show things like bikeways, footpaths etc, something that can’t be done in MapInfo, well it can by using the line style editor but I would rather stab myself in the eye.
The one thing I haven’t fully worked out how to do in QGIS yet is fully automate the printing process. Currently I open MapInfo using a batch file and pass it a workspace and MBX which prints the layouts and exits. I do this for each map type.    In QGIS I have a few options:
  1. Create a plugin that runs though each project and prints off its composers.
  2. Create a python script that runs from a batch file using qgis.core and qgis.gui QGIS python bindings.
  3. add a –code option to the command line of QGIS so that you could run: qgis.exe –noplugins –code “print.py”, which would open QGIS and run the python code and exit.
I’m yet to explore what option is the best for this project but I’ll get back to you on that.  Once I have the above issue sorted I plan on creating the maps in QGIS to see how it would turn out (time permitting)

Custom asset data collection program

This one would have to be my favourite.  I really love programming (most days), and being able to create our own data collection program using QGIS and MS SQL 2008 has been great.

While it is only very very young I’m already seeing some great potential.  Using an open source base (apart from MS SQL) has given us a lot of power, power to change stuff that we don’t like (which so far has been one minor bug), and the power to get exactly what we need.

I can’t talk about this project a lot as it is only very new and still only in design/testing/prototyping stage.

The main things for me are:

  • Ease of use. If I get asked how to do something over and over I have failed the users. And no 100 page training manuals.
  • Fast
  • No menus, or right-click menus! I’m a power user and even I hate navigating menus on a tablet.
  • Easy to build custom forms
  • Online/Offline syncing
  • Ease of use. Oh did I say this already!? Well it’s important.
  • Easy to configure by admins.
  • Limited use of dialogs. It’s NOT ok for an app to ask users to confirm 100 dialogs to do one thing.

Overall I think using QGIS and PyQt I can hit all the targets listed above quite well. In fact I know I can because I have already hit most of the them in the last couple of weeks.

Summary

So that is my list of QGIS uses in my local government situation, hopefully it wasn’t TL;DR and you found it interesting.  I’m sure there will be plenty more to add at the end of 2012.


Filed under: Open Source, qgis Tagged: case study, FOSSGIS, gis, local gov, Local government, mapinfo, Open Source, osgeo, qgis, Quantum GIS

Custom QGIS feature forms – Value Binding

One thing I didn’t explain very well  in my other post was how to correctly set up value binding between your custom form and QGIS.  I didn’t explain it because at the time I didn’t know how.

The other day I was building a custom form QGIS for a project I am working on. I had named all the fields right, set the ui as the edit form for the layer, but only the line edits were getting bound to the correct values.

 So having a dig around in the code I noticed that QGIS uses the same methods to bind the built-in edit forms as it does for the custom forms, meaning that you must set what kind of control you want to use in Layer Properties -> Fields 

Correctly binding values

First create the form with the controls you need, remember to name them the same as your fields.

Custom form with controls using the same name as the fields

Note that here I have a QComboBox with the FeatureCla name, this will bind the combo box to the FeatureCla field in my dataset in QGIS.

Now set the custom form as the Edit UI for the layer

Set the Edit UI to your form

Tip: You can use relative paths if you store the form along side your project file

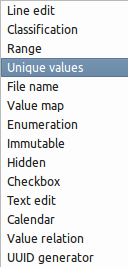
 Flick to the Fields tab and set up the Edit Widget type for each field that you have used on the custom feature form.

Set the Edit Widget that matches your control

I have set the FeatueCla field to use Unique values widget, this tells QGIS to collect all the unique values from that column and add them to the QComboBox.  There are a range of different edit widgets you can set

Each will map to a different set of control types (Widgets) e.g. If you want to have a checkbox on your form you must select Checkbox in the Edit Widget list to get it to bind correctly.

Save the properties and head back to you map.  Use the Identify Tool to select a feature.

Values bound to form

And that is it. Pretty cool hey!

Final thoughts

This is one feature I really like in QGIS.  The ability to create custom forms for people to do data entry without the need to build a plugin is very cool.  Couple this the built-in GPS module for QGIS and you have yourself a nice simple field data collection program.

I have some ideas to make this feature even more powerful, but more on that later once I get some time to add it in.


Filed under: Open Source, qgis Tagged: FOSSGIS, gis, Open Source, osgeo, qgis-editing, Quantum GIS

QGIS now with 100% more MS SQL Server 2008 support

Ok the title is a bit of a lie. QGIS did support MS SQL Server 2008 before by using OGR but this is a native provider so it’s a lot more integrated..

Good news everyone!

QGIS now has a native MS SQL 2008 provider. The provider can found using the new toolbar button (purple icon) or in the MS SQL node in the QBrowser tree. The provider also supports drag and drop import.

The work was sponsored by Digital Mapping Solutions (Australia) and completed by Tamas Szekeres

Any bugs can be assigned to “tamas” on hub.qgis.org.

A big thanks to both Digital Mapping Solutions and Tamas.

This addition will open QGIS up to a whole new set of users who have to use MS SQL but love QGIS.

Currently this is only in master but I will be in the 1.8 release when it comes out.

Note: At the moment you have to have a geometry_columns table in the database in order to connect, this table is the same format used by PostGIS and can be made by importing a layer using the ogr2ogr method. There will be a fix coming for this at some stage.


Filed under: Open Source, qgis Tagged: MS SQL Server 2008, MS SQL Spatial, Open Source, osgeo, qgis, Quantum GIS

QGIS on the social networks

Did you know QGIS is also on all the major social networking sites?

No?

Well now you do :)

Google+
Facebook
Twitter

Search for QGIS on Twitter
Search for QGIS on Google+

Come join the discussions on your preferred platform. If you prefer not to say much, social networks are still a great way to keep up to date with all the cool stuff happening in QGIS land.

Anita Graser, of underdark.wordpress.com, and myself manage the Google+ and Facebook pages.

If you have something cool that you have done with QGIS and would like to pimp it to the world, free feel to contact me, or even just mention QGIS in the post, Mentioning QGIS will make it show up in the search on Twitter or Google+.  I keep a keen eye on all sites for anything cool that I can reshare on the main QGIS pages.


Filed under: Open Source, qgis Tagged: FOSSGIS, gis, Open Source, qgis, Quantum GIS, social networking sites

A new QGIS plugin: Python Script Runner

Gary Sherman has just published a new Python plugin for QGIS that I think people will find very handy, I know I will.  The plugin allows you to run Python scripts inside QGIS for tasks that don’t really require, or warrant, a whole plugin.

Go check out Gray’s post about the new plugin at http://spatialgalaxy.net/2012/01/29/script-runner-a-plugin-to-run-python-scripts-in-qgis/

The new plugin can be installed via the Plugin Installer using the “runner” or “script”.  The Plugin Installer is another one of my favorite plugins for QGIS, being able to push out a new plugin and know that everyone can get it is a good feeling :)


Filed under: Open Source, qgis Tagged: FOSSGIS, gis, Open Source, osgeo, plugin, python, qgis, Quantum GIS

Improvements to the QGIS rule based rendering

The rule based rendering in QGIS has just got a make over to improve in some of the old usability issues it used to have.  Most of the improvements are UI related. If you would like to try them out you will need to grab a copy of the latest dev build (qgis-dev in OSGeo4W)

Main improvements include:

  • Nested rules.  If the parent rule evaluates to false none of the child rules are applied. This replaces the priority system in the old dialog.
  • Disable symbol for rules. Rules with no symbol only act as a check for the child rules e.g nothing is rendered for the rule but child rules still are (unless also disabled).
  • Drag and Drop rules (multi-selection is supported).  Rules can be dragged onto other rules in order to nest them and set up a rendering hierarchy.
  • Inline editing of rule labels, expressions, scales
  • Overall tweaks to the dialog

The new rule dialog

As you can see in the screenshot, the rules are now organized in a tree which clearly expresses which rules should be applied and when.

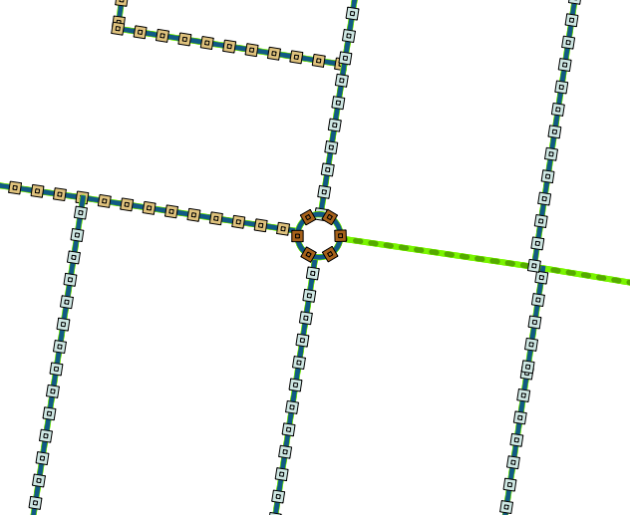
In the example above, all the rules under the Sealed rule will only be applied if that rule is true. The old system would have you managing all rules in one big list and dealing with priorities in order to get the rules to apply right, the new dialog is a major improvement.

And the results! As you can see below, QGIS will only render the colored squares if the Sealed rule is true otherwise it just shows a green line.

The rules applied

The work was sponsored by Ville de Morges, Switzerland and developed by Martin Dobias.  Thanks to both of them for these improvements.

More info:

Note: As this is a brand new feature there might be some bugs, or things that don’t quite work as expected. If you do find something don’t hesitate to file a bug report at hub.qgis.org so it can be fixed, or at least known about.


Filed under: Open Source, qgis Tagged: FOSSGIS, gis, map-rendering, mapping, Open Source, osgeo, qgis, Quantum GIS, styling

QGIS support for MS SQL Server 2008 – Coming Soon!

Good news!

Support for MS SQL Server 2008 in QGIS is coming soon.   A native QGIS provider for MS SQL Server is currently being worked on to make using, managing, and editing SQL Server data in QGIS just as easy as PostGIS.

The work is being sponsored by the Australian company Digital Mapping Solutions. So a very big thanks to them for this great feature!

There is no ETA on when it will be added to the main QGIS build, but the provider is currently in testing stage and hopefully will be in there soon.

So if you have been itching to try SQL Server data in QGIS, hang in there as a good solution is just around the corner.

P.S The other blog posts on this topic I used ogr, this method will still work fine after the native provider is added, however the native driver will add a nicer interface including integration into the QBrowser, better optimization for the QGIS code, and hopefully same feel as the PostGIS experience.


Filed under: Open Source, qgis Tagged: digital mapping solutions, FOSSGIS, gis, ms sql server, MS SQL Server 2008, MS SQL Spatial, ogr, Open Source, qgis, Quantum GIS

Expression based labeling now in QGIS.

QGIS finally has expression based labels! (Although you must be running latest dev build)

What does that mean? Well QGIS used to be only able to label with a field from the layer, very limiting if you need to make a nice looking label string. Now you can use expressions (eg ‘Up ‘ || US_Invert || ‘some more text’ ) to label the feature, just like this.

Example of expression based labels

This is something that I missed a lot when moving from MapInfo to QGIS.  After opening a ticket on the QGIS bug list and nothing happening with it for a couple of months (not that I expected anything to, everyone is busy enough as is.  I don’t expect the devs to just jump at all my requests) so I decided I should at least attempt adding it myself.  The joys of open source!

Turns out adding the expression labeling was the easy part, however there was no good generic expression string builder that I could use to build the expression string.  QGIS already had the expression builder for the query window and the field calculator, however the code was very tied down to only work for those implementations, plus they didn’t scale with the increasing function list.  I’m not going to go and make yet another dialog just for the labeling.  Uniformity is the key to good user experience.

After searching around to see what other GIS systems did to get some inspiration it seemed that every example that I came across was, in my opinion, poor.    Although there was one ArcGIS idea ticket that gave me a few ideas http://ideas.arcgis.com/ideaView?id=087300000008IbHAAU

So with that I started working on a generic expression builder that could be used to build an expression string anywhere, replacing the query window and field calculator in due time. One ring widget to rule them all, one ring widget to bind the, etc.

The result

Generic expression builder

Key features of the new expression builder:

  • Live validation of expression
  • Real time searching
  • Live output preview
  • Help on selected item.
  • Easier to add new functions without changing the UI.  Function list is read right from the expression parser.  No more hidden functions.
  • Reusable widget

If the expression hits an error while you type you will be shown an “Expression is invalid” warning (yes I know it’s wrong in the screen shot). Clicking (more info) or hovering over the expression area will show you the error.

Expression has error

Searching can done by using the search box at the top. The function list will reduce to show only functions or fields containing that string (Note: it is case sensitive at the current time) .

Searching for a function or field name.

Still to do

As with all programming it is never bug free so I expect, now that it is open to wider testing, that there might be a few that need to be addressed .   There is also very limited function help written for the functions, although if anyone is willing to have a go at it I’m more than happy.

If you do find any bugs will the widget/dialog you can open a ticket at http://hub.qgis.org/projects/quantum-gis/issues , assign it to me and I’ll see what I can do.

In the works

  • Simple Syntax highlighting
  • Recent expression used list
  • Saved expressions
  • Auto bracketing (maybe)
  • UI tweaking

I would like to thank Martin from the QGIS team for reviewing my code all though the project and helping me improve the code and idea.  Also thanks to all the other people who gave ideas for the widget/dialog.

Enjoy!


Filed under: Open Source, qgis Tagged: FOSSGIS, gis, Open Source, osgeo, qgis, Quantum GIS

Generating contours using GDAL ( via shell or QGIS)

I tell you. It always amazes me how much cool stuff you can do with great open source GIS software these days. GDAL is one of those great open source projects that I have just found a great use for (apart from just opening every raster type under the sun in QGIS).

GDAL has the ability to generate contours from a DEM, something that I have always wanted to try for my town but have never been able due to lack of a good DEMs.

Recently we purchased a set of DEMs that cover a large area as part of a study. Each DEM uses a grid size of 1mx1m. Prefect for generating contours.

Using the GdalTools QGIS plugin.

First make sure that you have the latest version of the GdalTools plugin installed (GdalTools should be installed by default with QGIS. If it’s not, search “Gdal” in the plugin installer). Enable the plugin once it’s installed.

Load the DEM into QGIS using the Load Raster icon.

DEM loaded in QGIS

Now head up to the menu Raster->Extraction->Contour

Raster menu in QGIS

Select the settings that you need. For this DEM I am going to generate 250mm contours.

Contour dialog.

Take note of the text area at the bottom of the dialog as that is the exact command sent to GDAL in order to generate the contours. If you take a copy of that you can run it on the command line for batch processing later.

Hit ok.

250mm contours from the DEM

BAM! :)

Using the command line/shell.

Using QGIS for a one off DEM is fine and dandy but what if you have 3000 DEMs that you need to process. To hell with doing that by hand!

Remember the contour tool in QGIS told us the exact command line args to use, so creating a shell script for automating the process is pretty easy.

for f in *.asc
do
  echo "Processing $f"
 gdal_contour -a ELEV -i 0.25 $f $f-250mm.shp
done

The above code will loop though the current directory and process all the DEMs generating 250mm contours for each one. It saves each new contour file as {filename}-250mm.shp. You will need to change *.asc to whatever format your DEM is in.

Copy the above code into a file somewhere and call it generate_contours.sh. This can then be called from the command line using

sh generate_contours.sh

Running sh on Windows

If you’re a windows user you will need to run OsGeo4W Shell in order to use sh.

Loading OsGeo4w shell.

Once the shell is loaded you can just call:

sh generate_contours.sh

Output from running generate_contours.sh

Final remarks

I ran the above sh script on a folder with about 2500 DEMs and it took around 4 hours to complete the whole folder. Of course performance will vary but it seems pretty quick considering.

Once again the possibly to use open source GIS tools to get my work done is amazing.  No expensive software here.

So far I’m not aware of any line smoothing/generalizing abilities using GDAL/OGR.  Although you can import the contours into GRASS and use that: http://grass.osgeo.org/wiki/V.generalize_tutorial

You can also generate the contours using GDAL via Python but that is a topic for another day.


Filed under: Open Source, qgis Tagged: contours, DEM, FOSSGIS, gdal, gis, grid, ogr, Open Source, osgeo, qgis, Quantum GIS, raster

Visualizing QGIS code activity between 1.6 and 1.7 – Video

Here is a quick video I did this morning using the very cool tool Gource. The video shows all the commits (1265) that were made between release 1.6 and 1.7. QGIS 1.7 was released on 19th June 2011 but there was still some clean up in the 1.7 branch paste that date into September.

It’s interesting to note the large burst of activity around November.


Filed under: Open Source, qgis Tagged: FOSSGIS, gis, git, Gource, Open Source, qgis, Quantum GIS

QGIS Tips – Custom feature forms with Python logic

Last week I found a nice little undocumented feature of QGIS. I plan on writing documentation, so it won’t stay that way for long but I thought I would post about it first and run though it step by step.

This post is going to be a follow up post based on what Tim Sutton did for the same subject back in 2009 at http://linfiniti.com/2009/11/creating-dynamic-forms-a-new-feature-headed-for-qgis-1-4/

For data entry one feature I really like in QGIS is the automatic feature edit forms with support for textboxs, dropdowns and all sorts of other cool Qt controls to make data entry a breeze.

However one thing that people might not be aware of is that you can have a custom forms for data entry. QGIS will take care of setting all the fields and then saving the values back to your layer.

This could be handy if you want to have say a logo, some validation and maybe some text to help the user fill in the form correctly. Or just a custom form layout because you can.

One thing Tim didn’t follow up on was a post about how to add custom Python logic to the form, which I think is the coolest feature of having these custom forms.

So lets get started.

Creating the custom form

This process is pretty much the same as what Tim outlined in his blog post however I’m going to go over it again for completeness.

In order to create the custom form you will need to install Qt Desinger. For windows I haven’t found a way to just install the desinger although if you have QGIS installed it is normally installed with the Qt framework and can be found at C:\OSGeo4w\bin\designer.exe. If you’re on Linux you can run something like

sudo apt-get install qt4-designer

Ohh how I wish windows had a package management system :(

Fire up Qt Desinger and select “Dialog with Buttons Bottom”.

Lets throw on a couple of Labels and a few Line Edits for the data. Now set the form to use a Grid Layout (Right Click on empty space on form->Layout->Layout in Grid).

Now the trick in making a custom form for QGIS is naming the object the same as the field. So I my case I have a road layer with the following fields.

- Segment_ID
- Parcel_ID
- Name
- Alias_Name
- Locality
- Parcel_type

For my custom form I only care about Segment_ID and Name, so my form looks like:

Custom form in Qt Designer

Note that I have set the read only property of the Segment ID line edit to True so that it can’t be edited. I don’t want people messing around with the ID.

As I said above the tick is in the naming so right click on each line edit and select Change objectName, naming each line edit using the same name as the field. For me the first control is called Segment_ID and the other is called Name.

Make sure the objects are the same name as the field.

Save the form into a new folder, I have put mine in C:\Temp\Roads. Jump back into QGIS, load the properties dialog for the layer. Select the General tab and set Edit UI to the new form .ui file.

Setting the edit form UI file.

Save and exit the properties window. Enable the layer for editing (or not) and select an object with the Identify Feature tool.

Woot! Custom edit form in QGIS.

Magic! As I’m in edit mode any changes I make to the Name line edit will be reflected back on the layer (but not the Segment ID as it’s read only). If you are in non-edit mode then you are given the custom form with everything disabled and a cancel button.

With Python validation and custom logic.

Now creating a custom form like above is pretty cool although having some custom Python validation behind it would be even cooler.

What I want to do is add some validation to the Name field so the user can’t enter null road names.

First save your QGIS project (as the Python code runner will look where the project is saved for the Python module). Again I have saved mine in C:\Temp\Roads as Roads.qgs. Now lets make a new python file in your favourite text editor and add the following code.

from PyQt4.QtCore import *
from PyQt4.QtGui import *

nameField = None
myDialog = None

def formOpen(dialog,layerid,featureid):
	global myDialog
	myDialog = dialog
	global nameField
	nameField = dialog.findChild(QLineEdit,"Name")
	buttonBox = dialog.findChild(QDialogButtonBox,"buttonBox")

	# Disconnect the signal that QGIS has wired up for the dialog to the button box.
	buttonBox.accepted.disconnect(myDialog.accept)

	# Wire up our own signals.
	buttonBox.accepted.connect(validate)
	buttonBox.rejected.connect(myDialog.reject)

def validate():
  # Make sure that the name field isn't empty.
	if not nameField.text().length() > 0:
		msgBox = QMessageBox()
		msgBox.setText("Name field can not be null.")
		msgBox.exec_()
	else:
		# Return the form as accpeted to QGIS.
		myDialog.accept()

Wow! What the hell is all that! I’ll step though the code to explain each bit.

Code break down.

First import the modules from Qt and set up a few global variables to hold the dialog and name field.

from PyQt4.QtCore import *
from PyQt4.QtGui import *

nameField = None
myDialog = None

Now we create a method that QGIS will call when it loads the form. This method takes an instance of our custom dialog, the Layer ID, and the Feature ID.

def formOpen(dialog,layerid,featureid):

Then using the findChild method we want to grab the reference to the Name field and the button box. We are also calling buttonBox.accepted.disconnect() to disconnect the slots that QGIS has auto wired up to our button box, we do this so we can hook up our own accepted logic.

After we have disconnected the accepted signal we can wire up our own call to the validate method using buttonBox.accepted.connect(validate).

global myDialog
myDialog = dialog
global nameField
nameField = dialog.findChild(QLineEdit,"Name")
buttonBox = dialog.findChild(QDialogButtonBox,"buttonBox")

# Disconnect the signal that QGIS has wired up for the dialog to the button box.
buttonBox.accepted.disconnect(myDialog.accept)
# Wire up our own signals.
buttonBox.accepted.connect(validate)
buttonBox.rejected.connect(myDialog.reject)

We need a method to validate the logic. This will be called when the signal buttonBox.accepted() is called. The logic in this method should be pretty streight forward. If the Name line edit has a length > 0 then we accept the dialog, if not then we give the user a message and let them fix the mistake.

def validate():
  # Make sure that the name field isn't empty.
	if not nameField.text().length() > 0:
		msgBox = QMessageBox()
		msgBox.setText("Name field can not be null.")
		msgBox.exec_()
	else:
		# Return the form as accpeted to QGIS.
		myDialog.accept()

Almost done!

Now that you have a Python file with the custom validation logic we need to tell QGIS to use this logic for the form. First save the Python file in the same directory as your project. I have called mine C:\Temp\Roads\RoadForm.py.

Back on the General tab in the layer properties we can set the Init function field. We set this to call the module and function we just made. The syntax is {module name}.{function name}. In my case my module (the Python file we made before) is called RoadForm and the function is called formOpen, so it will be RoadForm.formOpen.

Set the Init function field to moduleName.functionName

Save and use the Identify Feature tool to select a feature. You shouldn’t get any errors if everything worked ok. Now delete everything in the Name field and hit Ok.

Validation in action

Sweet! The form can now not be accepted if the name field is null.

And that’s that. Pretty simple but powerful feature once you know how to set it up.

Enjoy!

If you do end up using this custom form with python logic stuff in the real world, leave a comment and maybe a picture. It would be good to see use cases for this cool QGIS feature.

Bonus

Why not add a red highlight to the textbox if something is not valid.

from PyQt4.QtCore import *
from PyQt4.QtGui import *

nameField = None
myDialog = None

def formOpen(dialog,layerid,featureid):
  global myDialog
  myDialog = dialog
  global nameField
  nameField = dialog.findChild(QLineEdit,"Name")
  buttonBox = dialog.findChild(QDialogButtonBox,"buttonBox")

  nameField.textChanged.connect(Name_onTextChanged)
  # Disconnect the signal that QGIS has wired up for the dialog to the button box.
  buttonBox.accepted.disconnect(myDialog.accept)
  # Wire up our own signals.
  buttonBox.accepted.connect(validate)
  buttonBox.rejected.connect(myDialog.reject)

def validate():
  # Make sure that the name field isn't empty.
  if not nameField.text().length() > 0:
    nameField.setStyleSheet("background-color: rgba(255, 107, 107, 150);")
    msgBox = QMessageBox()
    msgBox.setText("Name field can not be null.")
    msgBox.exec_()
  else:
  # Return the form as accpeted to QGIS.
    myDialog.accept()

def Name_onTextChanged(text):
  if not nameField.text().length() > 0:
    nameField.setStyleSheet("background-color: rgba(255, 107, 107, 150);")
  else:
    nameField.setStyleSheet("")

The key part of of this is nameField.textChanged.connect(Name_onTextChanged) and the Name_onTextChanged(text) method. Give it a try, I think it looks quite nice.

Change text background to red on invalid input.


Filed under: Open Source, qgis Tagged: FOSSGIS, gis, Open Source, qgis, qgis-editing, Quantum GIS

New Tool: MapInfo to QGIS style converter

Hopefully this tool can be of some use to people, as I know it has been very helpful to me since I made it.

As I’m a pretty heavy QGIS user now, and my work place still stores most, if not all, of our data MapInfo TAB format, one  friction point for me using QGIS was having to restyle all the MapInfo layers.  If we only had a handful of layer this wouldn’t be such a pain but we have a lot of tables and it would take me months to go though each one manually and style them.

I thought “there has to be some way I can automate this…” and so the MapInfo To QGIS Style Generator (or mapinfoToQgis.py) was born. Knowing that QGIS uses QML (a XML file format) to store it style information, and that MapInfo was able to export a style string for each object, I compared what QGIS generated for its QML using the same symbol I picked in QGIS as I had in MapInfo.   Almost a 1 to 1 conversion! Once I worked out how to convert MapInfo point size  to QGIS symbol size, and MapInfo colour value to RGB it was just a matter of generating a QML with the correct values.

Long story short, after a bit of clean up and writing a user guide I would like release version 0.1 of the MapInfo To QGIS Style Generator for wider testing.

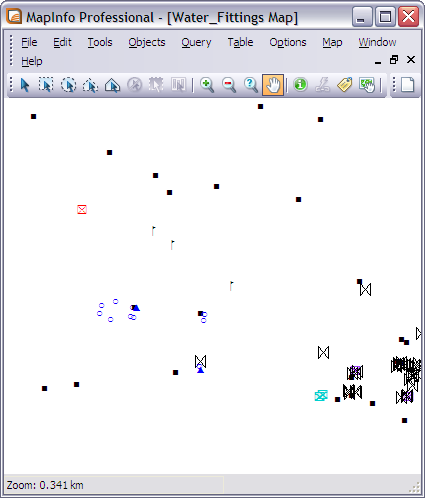
Here is a quick example of the output.

Step 1: Take One MapInfo table.

Step 2: Run it though mapinfoToQgis.py

python mapinfoToQgis.py WaterFittings.Tab WatterFittings.qml -c FittingType --UseMapInfo

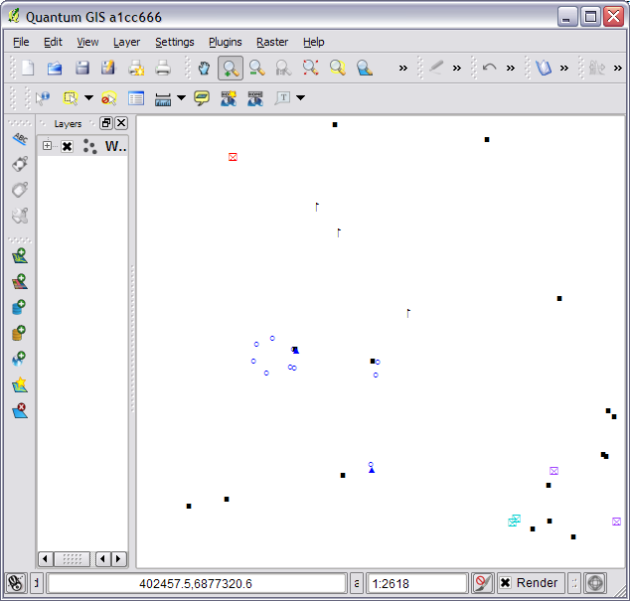
Step 3: Load QML file in QGIS

Result from running mapinfoToQGIS.py

Step 4: Get a beer?

If you are using MapInfo Font symbols or normal MapInfo 3.0 everything should come across almost exactly. mapinfoToQgis.py will use the same fonts in QGIS as you did in MapInfo and select to the correct symbol size. Although if you are using custom MapInfo 3.0 symbols you will get the default QGIS black square symbol,you can just change it to something better after loading the QML.

Currently the program only support converting symbols but I plan on adding line and region support sometime in the future.

The program can be found at https://github.com/NathanW2/MapInfo-to-QGIS-style-generator and more detailed instructions and download link can be found at https://github.com/NathanW2/MapInfo-to-QGIS-style-generator/wiki/Using-MapInfo-to-QGIS-style-generator.

Like I said at the start, hopefully other people will find this tool handy as I know I have.  If you do find it handy let me know, I would love to hear peoples feedback.  Also if you find any bugs let me know in the comments or log a issue on https://github.com/NathanW2/MapInfo-to-QGIS-style-generator/issues

Enjoy :)


Filed under: MapInfo, Open Source, qgis, QGIS for MapInfo Users Tagged: gis, mapinfo, MapInfo Professional, mapping, Open Source, qgis, qgis-vs-mapinfo, Quantum GIS, styling

Slow opening of rasters in QGIS 1.7? Here is a fix.

Note: The following post only applies to QGIS 1.7.  QGIS 1.7.1 (upcoming patch) will not have this issue as the default behavior has changed. 

One thing I noticed when running QGIS 1.7 was my rasters were really slow to open and sometimes froze QGIS.  I thought maybe it was some bad plugin that I had installed, nope; maybe opening the raster of the network drive was causing it to be slow, nope. I tried a bunch of stuff, still nothing.  After a while a few other people posted to the mailing list saying they were having the same issue, turns out the solution was very simple.

In QGIS contrast enhancement for rasters is turned on by default, so each time a raster is opened QGIS had to calculate the stats (max and min for example) for the raster and then scale the contrast.  For a large raster this is pretty heavy and this was the cause of all those problems.

So what’s the solution?

Turns out QGIS will remember the contrast setting for all rasters if you want it to.

To fix the slow opening raster problem:

  1. Open a small raster (just any old picture will do)
  2. Double click the layer in the layer list
  3. Change Contrast Enhancement to No Stretch

    Change Contrast Enhancement to No Stretch

  4. Hit the little Save icon next to the drop down box
  5. Open your big raster.

That setting will now be remembered for each raster that is opened and improve the loading time.

On a similar note.  Tim over at http://linfiniti.com has done some work to improve the raster performance even more with http://linfiniti.com/2011/08/improvements-to-raster-performance-in-qgis-master/ .  The improvements that  Tim has made are available in the nightly build of QGIS via qgis-dev in OSGeo4W, or by building the master line from github.com.


Filed under: Open Source, qgis Tagged: FOSSGIS, gis, Open Source, OSS, QGIS 1.7, Quantum GIS, rasters

QGIS edit tools brainstorming or What edit tools should QGIS have?

One trend that come up a lot in the poll I recently ran (results will be out soon, just writing a summary blog post) is “Needs more powerful edit tools“.  And I agree.

Coming from a MapInfo background nothing much changes when you move to QGIS, MapInfo had the simple Add Point, Add Region, Add Line kind of tools and then you need to use plugins to do anything a bit more advanced (MapCAD).  QGIS has the start of a kind of MapCAD thing happening although not as complete.

Why not just let people write plugins?

However I think in order to make QGIS a more attractive package to a lot of people it needs to get some built in semi-advanced to advanced editing tools;  getting back to those poll results of “Needs more powerful edit tools”.

I thought to myself “What would I like QGIS to be able to do when it came to editing?” although I came up with a small set my editing needs are only relatively small.  I then thought the best way to find out what people need is to just create a blank canvas for people to throw their ideas around on and then go from there.

Why not just create a ticket?

My idea is to get a larger idea of what people need and want rather than just one-off tickets. Although the ideas will be at the edit tool idea level it will be easier to see how they should all fit together if they are all in one place and editable by other people.  You can then start asking questions like: Do we really need that UI there?  Can we merge these tools?  How should the output be handled?

The overall goal is to have a tight, thought out, group of edit tools rather then someone creating a plugin over here for one thing and some else creating something else over there.

So how do we get this going?

Well I have created a Google Document that anyone can edit and view in order to start brainstorming ideas. The link can be found here.

I have already created an example of two ideas that I would like to see.

So go ahead, throw some ideas up.  I’m interested to see where this can head.

Why use Google Docs and not the QGIS wiki?

Mainly because Google Docs makes it very easy to do frictionless editing of a document together.  No need for user names or passwords or overwriting someone else’s changes (Google Docs is all real time).


Filed under: Open Source, qgis Tagged: FOSSGIS, gis, mapping, Open Source, OSS, poll, qgis, qgis-editing, Quantum GIS

Add yourself to the QGIS user map

If your a QGIS user, and you haven’t done so already, how about consider adding yourself to the QGIS user map at http://planet.qgis.org/community-map/. So far there are 604 user mapped

QGIS User Map

although Australia doesn’t look like it has many users…….yet.

QGIS user map Australia

So if you are a QGIS user (full time or part time) it would be good to see your location on the user map esp if you are in Australia :)


Filed under: Open Source, qgis Tagged: gis, Open Source, qgis, Quantum GIS

Changing the QGIS application style on Windows

By default QGIS uses the Qt QPlastiqueStyle for all its windows which makes QGIS render all controls like this:

Default style for QGIS on windows.

However it can be changed in order to make it fit in with system style, as in use Windows style. Running the following commands in the python console:

from PyQt4.QtGui import QApplication
QApplication.setStyle("windowsvista")

will change QGIS to render controls in windows style:

QGIS using windows style.

It’s quite hard to notice many of the differences but just try it you will see them

However there is one limitation. QGIS will not remember that setting as the compiled binary forces QGIS running on Windows into QPlastiqueStyle.

I have started working on a patch to give the user a choice in the options which control rendering style they would like to use. I think choice in these situations is good because I have grown to like the QPlastiqueStyle, mainly because I have used it so much , but other people I know prefer the Windows Vista style controls.


Filed under: Open Source, qgis Tagged: gis, Open Source, qgis, Quantum GIS

Browser Wars: QGIS vs MapInfo 11

Warning: This post contains small rants! You have been warned.

PBBI have recently released MapInfo 11, the new version has brought one change that I think deserves some attention – even if for the wrong reasons.

MapInfo’s browser window was in need of a very good make over; it didn’t follow normal keyboard conventions, eg holding shift to select rather than ctrl; couldn’t sort via the headers; keyboard navigation was poor; and it looked ugly. PBBI then announced that MapInfo 11 would have a new “improved” browser. I thought “Sweet! About time” and then we got a copy. /sigh

So what’s the problem?

First off it’s slow to resize, this would be due to them using .NET WPF for the new browser (I have never seen a good fast .NET WPF datagrid).

Then we have sorting, which is meant to be the cool new feature. This is not the normal just click on the header to sort the column, no because that would be too easy, you have to right click in the browser, click sort and select the options which then opens a new browser window. um what?

Yes this is a pretty handy feature but no it shouldn’t be the only way to sort, you should have a click on the header kind of sort. This seems to be what people wanted.

Next. No visible scroll progress. When you move the little scroll box on the side the browser waits until you have finished to show you the data. I guess the old browser did this too so why change it!

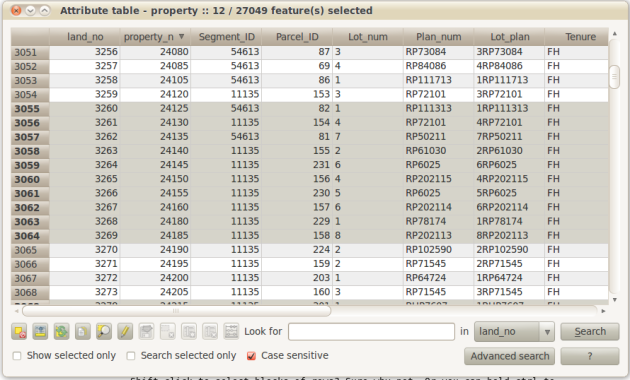
And finally shift click to select a block of rows doesn’t work, I mean come on this is not a hard thing to do.

Surly you can dock it? Nope!

In the end we have a browser that is pretty much the same as the old one but slower……oh and has alternating row colors.

Overall reaction: Disappointed

Enter QGIS

Now if you are reading this blog you are well aware that I am a huge fan of QGIS, I don’t really make that a secret. So I guess the overall point of this post is to compare the QGIS attribute table (browser) and the new MapInfo 11 one.

Lets run though the same list as MapInfo.

Slow to resize? Nope. Even with a large table open the resize speed doesn’t change.

Header based sorting? Yep. Just click the header and it will sort that column. Multi column sorting is on the to-do list.

Live scrolling (results update as you scroll)? Yep + no lag.

Shift click to select blocks of rows? Sure why not. Or you can hold ctrl to select rows all over the grid.

Docking? Yep and floating so you can put it on a different monitor if you need.

Bonus

The QGIS attribute table has a built-in search/filter box, saves having to run a query and have a new window like in MapInfo if you just want to filter the browser.

The QGIS attribute table (browser)

Extra Bonus
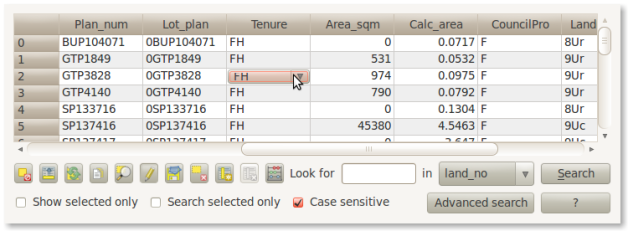
The QGIS browser can even have other UI objects inside the cells. Very bloody handy.

Combo box in browser table.

You can even have a calendar date picker if you want.

Lets review

Feature MapInfo 11 QGIS
Good resize speed. No Yes
Header sorting. No Yes
Multi column sorting. Yes [1] No [2]
Live scrolling. No Yes
Shift click for blocks of rows No Yes
Docking. No[3] Yes

[1] Why does it need to open a new browser window? At least make it an option.
[2] On the to-do list

[3] Yes you can use http://www.pbinsight.com/support/product-downloads/item/windowhelper for this support. It’s a good tool made by a guy at MapInfo go and download it. I just think it should be built in.

Doesn’t look too good for MapInfo at the moment. QGIS is even accessing the TAB data though ogr. Quick tip: if a free program can access and manage your data faster than you, you are failing.

My work place spends a good deal of money on our annual MapInfo “maintenance” licence, money I would happily send to the QGIS project if I had the choice. Or at least part of it,

Data

Both programs opened a 27000 row .TAB file.

Just for the record I’m not anti-MapInfo. It still has some features that I really like. I just wish they would pick up the game.


Filed under: MapInfo, Open Source, qgis, QGIS for MapInfo Users Tagged: .NET, Feature Requests, mapinfo, MapInfo Professional, mapinfo-11, Open Source, qgis, qgis-vs-mapinfo, Quantum GIS

A QGIS user poll

I have just whipped up a small user poll for QGIS users. The poll is just to give me (and indirectly the team) some idea of people’s opinions about QGIS and what it could do better. The poll is only short (9 questions) and one of the main things is “What could QGIS do better?”.

The poll can be found here: https://spreadsheets.google.com/spreadsheet/viewform?formkey=dDA5TW96Z19aNFU1OVpzSzFyRzFybmc6MQ

All the answers are anonymous so feel free to say what you like about anything. In the end if something isn’t working the way you think it should, write it down. It’s not going to hurt anyone’s feelings :)

If you are a partial QGIS users who mostly uses MapInfo or ESRI stuff I would also like to get your opinion.


Filed under: Open Source, qgis Tagged: gis, mapinfo, mapping, Open Source, OSS, poll, qgis, Quantum GIS

Another cool open source project – OSGeo-Live

Another cool open source project that I have become a part of (as a QGIS packager and tester) is the OSGeo-Live project.  The OSGeo-Live project is a live DVD/USB/Virtual Machine built on xUbuntu(striped down Ubuntu linux) that has a lot of cool open source geo spatial programs all set up and ready to use.

The OSGeo-Live project contains:

  • Browser clients
  • A small sample of crisis management software
  • All the popular database engines (PostGIS, SpaitalLite etc)
  • Pretty much all the open source desktop GIS apps (QGIS, uDig etc)
  • Open Source GPS navigation apps and globes.
  • A collection of handy spatial tools
  • A ready to go web services ready to try in your browser or desktop GIS.
  • Some sample data to get started with for each project
  • And quick starts for each program.

The full list of software contained on the OSGeo-Live project can be found at http://live.osgeo.org/en/overview/overview.html

This is a good project if you want to get into the OSGeo tools and experiment but don’t want to install them on main machine until you know what you need.

As it is a live DVD/USB/Virtual Machine some apps will run slower than what they do on a native install but overall the speed is usable and good enough for testing.

Even better is that it was born in Australia :)

The project is also commercial supported by a Australian company http://lisasoft.com

So give it a try if you are interested in the OSGeo movement, which you should be if you are reading my blog :)


Filed under: Open Source, qgis Tagged: gdal, gis, mapping, Open Source, osgeo, osgeo-live, OSS, Quantum GIS

Fresh off the press – QGIS 1.7 is released!

Tonight Tim Sutton officially made the release announcement for QGIS 1.7, so I’m guess I’m free to blog about the newest version now and its cool features.


What are you still doing here? Go and get it! http://www.qgis.org/wiki/Download

I am, as a heavy QGIS user and a guy-who-tries-to-write-features-and-patches-for-the-code, very happy with this release. I know a lot of people have put a lot of hard work and free time into working on features and bug fixes that keep making this free GIS system even better.

Some of the more notable new features in this release are…well there are just way to many for me to list here so go and check out the official list at http://qgis.org/component/content/article/127-qgis-1-7-release.html

The QGIS team has shifted their source control system to using GIT, which I am very happy about as a lot of the guys on the #qgis IRC channel will know :). The bug tracer has also been moved tohttp://hub.qgis.org/projects/quantum-gis.

Since the release of QGIS 1.6 there have been 1199 commits (using git to count: git log –pretty=oneline upstream/release-1_6_0..upstream/release-1_7_0 | wc -l). Not a bad effort if I may so myself.


If you are still reading this, I really hope it’s because you are waiting for QGIS 1.7 to install.


Filed under: Open Source, qgis Tagged: gis, git, mapping, Open Source, OSS, qgis, Quantum GIS

Back to Top

Sustaining Members