Related Plugins and Tags

QGIS Planet

Good news for QGIS MapInfo users

So some good news for QGIS users who also need/want to use MapInfo.  QGIS via GDAL 2.0 can support MapInfo TAB file editing. In all older versions of GDAL there was only support for read and/or write but not both.

MapInfo TAB editing has been supported in GDAL 2 but up until this point QGIS has only be built against GDAL 1.xx.  GDAL 2.x is now the default GDAL release in OSGeo4w.

From Jurgen:

2.0.2 is now the default GDAL in OSGeo4W and the nightlies (qgis-ltr-dev,
qgis-rel-dev and qgis-dev) already picked it up.

With the next release the regular packages (2.14 and 2.8) will also be updated
to use it

Even if you don’t want to make the switch to full QGIS you can now use both bits of software and edit in both.

QGIS will still only support a single geometry type per layer so if you open a mixed tab file you will get the geometry type selector.  You can load the layer 3 times if you need the 3 different geometry types.


Using QGIS in local government

Something that I always find interesting is how people are using different open source tools to get their work done.  This post attempts to outline how I/we are using QGIS at work for different projects.

Kerb mapping, condition, and defect pickup

This project is currently being done by a 67 year old foreman who has worked for the council for a very long time and has great knowledge of the town.   QGIS, with the main working layers stored in PostGIS, was setup so that he can:

  • Digitize kerb lines from aerial photos.
  • Split the existing kerb lines into segments depending on different asset rules.
  • Give each segment an overall condition rating.
  • Add defect points along the each kerb segment e.g. broken, lifted, etc,

Each defect point is snapped to the underlying  kerb line and chainages (distance along line) is generated using a update statement at the end of the project (could be done using a insert trigger if needed) using ST_line_locate_point(line, point).

Defect points coloured by risk captured against the kerb line

Overall QGIS has been great for this project.  The built in data entry forms have been a great help to allow fast and correct data entry. Each form has four drop downs all with present values and descriptions to aid in data entry.

Flood damaged claim maps

We recently suffered, like the rest of Queensland, some really major flooding which caused large amounts of damage to our road infrastructure. We got off pretty light compared to some places, nevertheless we still had a lot of damaged assets.  And so began the process of collecting data that could be used for state government funding claims.

Anyway, onto the QGIS bit.  QGIS was installed on one of the main engineers computers in order for him to make maps for each claim.  Having the ability for him to have one map window but multiple frames in the composer helped him to create multiple  views of the same data with ease.

In total there are 42 QGIS project files with a main project file which served the base layers to the other projects, using the cool Embed Layers and Groups feature.  This means any change in main base project was reflected up(down?) to the other projects next time they are opened.  The main project file has things like, property layer; normal road layers, with labels; road layer with roads for claims.   The other 42 projects have a filtered, and styled, road layer to only show roads in that batch, and its composers (print layouts).

Normally we would use MapInfo for this kind of thing but consider this: There are at least 3 print layouts per claim, each layout could have more then one map frame.  Now with MapInfo only being able to have a 1:1 ratio between the map window and the map frame in the layout you would need at least 3 map windows per claim.  Quick calc:

42 * 3 =  126+n map windows + 126 print layouts (n = extra map frames in layouts)

Each map window has its own copy of every layer, making change once apply every where changes hard.  This of course doesn’t apply to styles as they are stored in the .map (tab) file, but does for labels, style overrides, etc.   I’ll pass.

QGIS is no means perfect for printing or print layouts but the 1:N map window to map frame ratio worked really well for this project.  The styling options in QGIS also helped to change the display of the map depending on what was needed to be shown quickly, one even used the rule-based rendering.

You get the point.
Moving on.

Processing GPS photos with road chainages

This one I am quite proud of.  It’s nothing fancy but still saves a lot of time.  While not really QGIS only but a combination of QGIS+Spatialite it process GPS photos and assigns them a road name and chainage.

The issue: A large influx of GPS photos for the different flood damage projects and the need to process them quickly so that they got assigned to the correct road and chainage.  Now you can map GPS photos easy enough but then you still have to go to each one and assign a road name, chainage, and move it into the correct folder.  To hell with doing that by hand, this is why we invented GIS.

The result is a little (140 line) python script that:

  1. extracts the coordinates from each photos,
  2. finds the closest (within tolerance) road distance node (distance nodes are generated at 5m intervals along the road, around 800,000 in total for the whole shire),
  3. gets the road name, locality, and chainage for that node,
  4. creates a folder with that road name,
  5. renames the photo with {name} @ {chainage},
  6. moves it into the road name folder it is assign to.
  7. inserts a record for that photo into the spatialite database that can be viewed in QGIS.
The Spatialite database has a spatial index on the road distance nodes and with that in place it can process 148 photos in 8 seconds.  Not too bad at all. Now all we have to do to process the photos is stick them into a special folder and run process.bat.

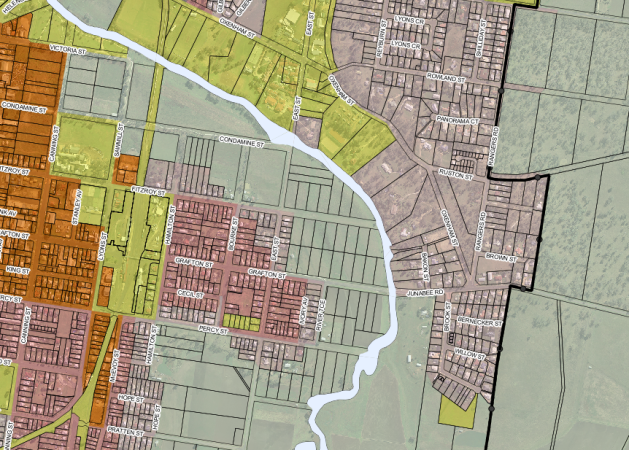
Porting our planning scheme maps

I have been involved in creating, and maintaining, our planning scheme maps for the council.  It’s been a pretty fun project, apart from the constant moving target that is the state planning specifications, but I digress.

Planning scheme in QGIS

This project was done, and still is, in MapInfo. While there is nothing technically wrong with that, it has become a bit more of a pain to maintain then one would hope.  The planning scheme is not just one map but rather a series of different maps all with different scales and requirements.  I’m sure by now you can start to see the issues that can arise:

  1. No dynamic scale bar for layouts (not even a scale bar object rather just text and boxes made to look like a scale bar. With no group items feature moving these around is a pain).
  2. 1:1 map window to map frame means excessive map windows when the data is all the same with just different views.
  3. Legends don’t support ordering, adding items, or groups.
  4. With no embedding base maps feature like in QGIS it’s hard to change one thing and apply it to all the map windows/workspaces.
The specifications also ask for lines with symbols along them to show things like bikeways, footpaths etc, something that can’t be done in MapInfo, well it can by using the line style editor but I would rather stab myself in the eye.
The one thing I haven’t fully worked out how to do in QGIS yet is fully automate the printing process. Currently I open MapInfo using a batch file and pass it a workspace and MBX which prints the layouts and exits. I do this for each map type.    In QGIS I have a few options:
  1. Create a plugin that runs though each project and prints off its composers.
  2. Create a python script that runs from a batch file using qgis.core and qgis.gui QGIS python bindings.
  3. add a –code option to the command line of QGIS so that you could run: qgis.exe –noplugins –code “print.py”, which would open QGIS and run the python code and exit.
I’m yet to explore what option is the best for this project but I’ll get back to you on that.  Once I have the above issue sorted I plan on creating the maps in QGIS to see how it would turn out (time permitting)

Custom asset data collection program

This one would have to be my favourite.  I really love programming (most days), and being able to create our own data collection program using QGIS and MS SQL 2008 has been great.

While it is only very very young I’m already seeing some great potential.  Using an open source base (apart from MS SQL) has given us a lot of power, power to change stuff that we don’t like (which so far has been one minor bug), and the power to get exactly what we need.

I can’t talk about this project a lot as it is only very new and still only in design/testing/prototyping stage.

The main things for me are:

  • Ease of use. If I get asked how to do something over and over I have failed the users. And no 100 page training manuals.
  • Fast
  • No menus, or right-click menus! I’m a power user and even I hate navigating menus on a tablet.
  • Easy to build custom forms
  • Online/Offline syncing
  • Ease of use. Oh did I say this already!? Well it’s important.
  • Easy to configure by admins.
  • Limited use of dialogs. It’s NOT ok for an app to ask users to confirm 100 dialogs to do one thing.

Overall I think using QGIS and PyQt I can hit all the targets listed above quite well. In fact I know I can because I have already hit most of the them in the last couple of weeks.

Summary

So that is my list of QGIS uses in my local government situation, hopefully it wasn’t TL;DR and you found it interesting.  I’m sure there will be plenty more to add at the end of 2012.


Filed under: Open Source, qgis Tagged: case study, FOSSGIS, gis, local gov, Local government, mapinfo, Open Source, osgeo, qgis, Quantum GIS

New Tool: MapInfo to QGIS style converter

Hopefully this tool can be of some use to people, as I know it has been very helpful to me since I made it.

As I’m a pretty heavy QGIS user now, and my work place still stores most, if not all, of our data MapInfo TAB format, one  friction point for me using QGIS was having to restyle all the MapInfo layers.  If we only had a handful of layer this wouldn’t be such a pain but we have a lot of tables and it would take me months to go though each one manually and style them.

I thought “there has to be some way I can automate this…” and so the MapInfo To QGIS Style Generator (or mapinfoToQgis.py) was born. Knowing that QGIS uses QML (a XML file format) to store it style information, and that MapInfo was able to export a style string for each object, I compared what QGIS generated for its QML using the same symbol I picked in QGIS as I had in MapInfo.   Almost a 1 to 1 conversion! Once I worked out how to convert MapInfo point size  to QGIS symbol size, and MapInfo colour value to RGB it was just a matter of generating a QML with the correct values.

Long story short, after a bit of clean up and writing a user guide I would like release version 0.1 of the MapInfo To QGIS Style Generator for wider testing.

Here is a quick example of the output.

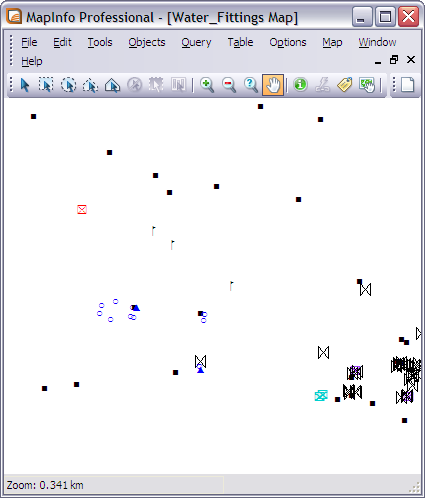
Step 1: Take One MapInfo table.

Step 2: Run it though mapinfoToQgis.py

python mapinfoToQgis.py WaterFittings.Tab WatterFittings.qml -c FittingType --UseMapInfo

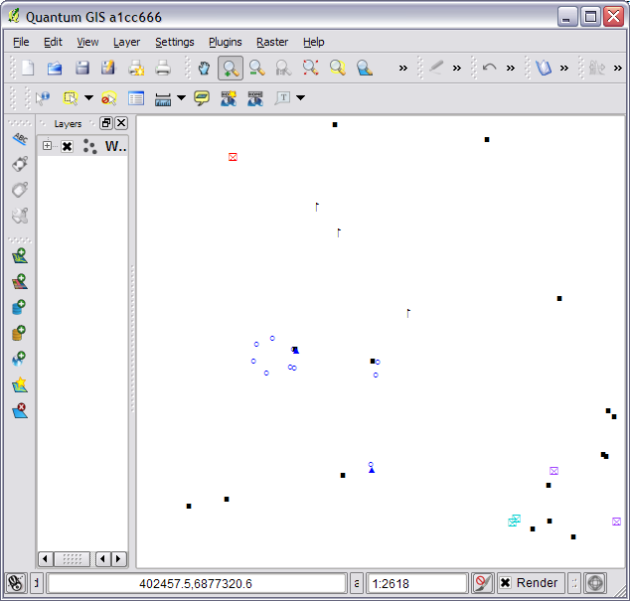
Step 3: Load QML file in QGIS

Result from running mapinfoToQGIS.py

Step 4: Get a beer?

If you are using MapInfo Font symbols or normal MapInfo 3.0 everything should come across almost exactly. mapinfoToQgis.py will use the same fonts in QGIS as you did in MapInfo and select to the correct symbol size. Although if you are using custom MapInfo 3.0 symbols you will get the default QGIS black square symbol,you can just change it to something better after loading the QML.

Currently the program only support converting symbols but I plan on adding line and region support sometime in the future.

The program can be found at https://github.com/NathanW2/MapInfo-to-QGIS-style-generator and more detailed instructions and download link can be found at https://github.com/NathanW2/MapInfo-to-QGIS-style-generator/wiki/Using-MapInfo-to-QGIS-style-generator.

Like I said at the start, hopefully other people will find this tool handy as I know I have.  If you do find it handy let me know, I would love to hear peoples feedback.  Also if you find any bugs let me know in the comments or log a issue on https://github.com/NathanW2/MapInfo-to-QGIS-style-generator/issues

Enjoy :)


Filed under: MapInfo, Open Source, qgis, QGIS for MapInfo Users Tagged: gis, mapinfo, MapInfo Professional, mapping, Open Source, qgis, qgis-vs-mapinfo, Quantum GIS, styling

Browser Wars: QGIS vs MapInfo 11

Warning: This post contains small rants! You have been warned.

PBBI have recently released MapInfo 11, the new version has brought one change that I think deserves some attention – even if for the wrong reasons.

MapInfo’s browser window was in need of a very good make over; it didn’t follow normal keyboard conventions, eg holding shift to select rather than ctrl; couldn’t sort via the headers; keyboard navigation was poor; and it looked ugly. PBBI then announced that MapInfo 11 would have a new “improved” browser. I thought “Sweet! About time” and then we got a copy. /sigh

So what’s the problem?

First off it’s slow to resize, this would be due to them using .NET WPF for the new browser (I have never seen a good fast .NET WPF datagrid).

Then we have sorting, which is meant to be the cool new feature. This is not the normal just click on the header to sort the column, no because that would be too easy, you have to right click in the browser, click sort and select the options which then opens a new browser window. um what?

Yes this is a pretty handy feature but no it shouldn’t be the only way to sort, you should have a click on the header kind of sort. This seems to be what people wanted.

Next. No visible scroll progress. When you move the little scroll box on the side the browser waits until you have finished to show you the data. I guess the old browser did this too so why change it!

And finally shift click to select a block of rows doesn’t work, I mean come on this is not a hard thing to do.

Surly you can dock it? Nope!

In the end we have a browser that is pretty much the same as the old one but slower……oh and has alternating row colors.

Overall reaction: Disappointed

Enter QGIS

Now if you are reading this blog you are well aware that I am a huge fan of QGIS, I don’t really make that a secret. So I guess the overall point of this post is to compare the QGIS attribute table (browser) and the new MapInfo 11 one.

Lets run though the same list as MapInfo.

Slow to resize? Nope. Even with a large table open the resize speed doesn’t change.

Header based sorting? Yep. Just click the header and it will sort that column. Multi column sorting is on the to-do list.

Live scrolling (results update as you scroll)? Yep + no lag.

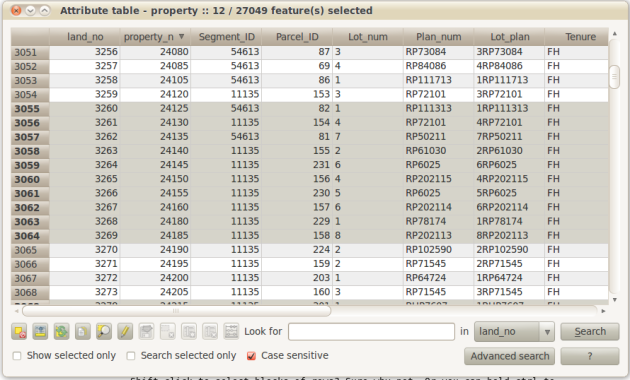
Shift click to select blocks of rows? Sure why not. Or you can hold ctrl to select rows all over the grid.

Docking? Yep and floating so you can put it on a different monitor if you need.

Bonus

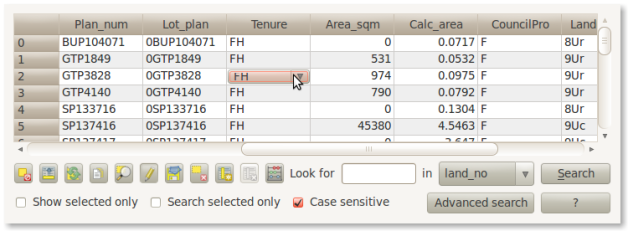
The QGIS attribute table has a built-in search/filter box, saves having to run a query and have a new window like in MapInfo if you just want to filter the browser.

The QGIS attribute table (browser)

Extra Bonus
The QGIS browser can even have other UI objects inside the cells. Very bloody handy.

Combo box in browser table.

You can even have a calendar date picker if you want.

Lets review

Feature MapInfo 11 QGIS
Good resize speed. No Yes
Header sorting. No Yes
Multi column sorting. Yes [1] No [2]
Live scrolling. No Yes
Shift click for blocks of rows No Yes
Docking. No[3] Yes

[1] Why does it need to open a new browser window? At least make it an option.
[2] On the to-do list

[3] Yes you can use http://www.pbinsight.com/support/product-downloads/item/windowhelper for this support. It’s a good tool made by a guy at MapInfo go and download it. I just think it should be built in.

Doesn’t look too good for MapInfo at the moment. QGIS is even accessing the TAB data though ogr. Quick tip: if a free program can access and manage your data faster than you, you are failing.

My work place spends a good deal of money on our annual MapInfo “maintenance” licence, money I would happily send to the QGIS project if I had the choice. Or at least part of it,

Data

Both programs opened a 27000 row .TAB file.

Just for the record I’m not anti-MapInfo. It still has some features that I really like. I just wish they would pick up the game.


Filed under: MapInfo, Open Source, qgis, QGIS for MapInfo Users Tagged: .NET, Feature Requests, mapinfo, MapInfo Professional, mapinfo-11, Open Source, qgis, qgis-vs-mapinfo, Quantum GIS

A QGIS user poll

I have just whipped up a small user poll for QGIS users. The poll is just to give me (and indirectly the team) some idea of people’s opinions about QGIS and what it could do better. The poll is only short (9 questions) and one of the main things is “What could QGIS do better?”.

The poll can be found here: https://spreadsheets.google.com/spreadsheet/viewform?formkey=dDA5TW96Z19aNFU1OVpzSzFyRzFybmc6MQ

All the answers are anonymous so feel free to say what you like about anything. In the end if something isn’t working the way you think it should, write it down. It’s not going to hurt anyone’s feelings :)

If you are a partial QGIS users who mostly uses MapInfo or ESRI stuff I would also like to get your opinion.


Filed under: Open Source, qgis Tagged: gis, mapinfo, mapping, Open Source, OSS, poll, qgis, Quantum GIS

The things I would like to see in QGIS. What are yours?

So if you have not already guessed from my increasing post about QGIS. I really like it as a GIS system but with all systems it comes with its shortcomings. (Nothing that can’t be fixed of course)

Here is my little wishlist of a few things I would love to see in QGIS.

Multipule map canvases. (ArcGIS, MapInfo)

I was thinking more like ArcGIS data frames vs something like what MapInfo has (multiple windows).  I think the multi window system can add confusion for people new to GIS, plus I hate having to window manage.

SQL like interface. (MapInfo)

This is something that I really like from MapInfo.  It adds a lot of power to the application being able to spatially join two tables that don’t share a command link column and get back a new layer.  Adding this to QGIS could be a pretty big task, although a very rewarding one IMO.  

Now there is some credit in saying “well you can just import your data into PostGIS and use that”, however that is not always a option and I think having a layer above that can query any open layer would be very very powerful.

These are just two of the main things that I would like to see, I’ll update the post if I can think of anymore.

Of course being open source I can write the features myself but C++ is still a bit over my head at the moment.

I would love to see what other peoples thoughts, or mini wishlists, are.  So if you are willing, drop a comment and let me know.


Filed under: MapInfo, Open Source, qgis Tagged: Feature Requests, gis, mapinfo, Open Source, OSS, qgis, Quantum GIS

3D DXF from MapInfo Tab or ESRI Shape (or anything) using OGR

Note:The following post requires gdal 1.8

A lot of times we need to send/use 3D dxf files, we used to use FME however FME is not free or cheap. So I went looking for a free solution.

If you have gdal 1.8 it’s just one simple command line run using, what is becoming my favorite GIS tool, ogr2ogr.

All you have to do is run:

ogr2ogr -f "DXF" {outFile} {inFile} -zfield {ColumnWithZValue}

So in my case I ran:

ogr2ogr -f "DXF" C:\Temp\contourswarwick.dxf C:\Temp\Contours.TAB -zfield Height

I haven’t fully tested it but {outfile} can be any file ogr supports.

and the output:

Top view of contours

Top view of contour layer

Contours side view

The side view of the above image.

In the words of, the not so great, Charlie Sheen. WINNING!

Happy mapping :D


Filed under: MapInfo, Open Source Tagged: 3D, ESRI, gdal, gis, mapinfo, mapping, ogr, Open Source, OSS

Using Python and MapInfo with Callbacks

The other day I posted an entry about using MapInfo with Python and Qt (see http://woostuff.wordpress.com/2011/03/05/mapinfo-map-control-into-qt-python-form/), one big thing that I missed was support for callbacks, which if you want to do anything related to integrated mapping is a must for map tool support.

Turns out it is pretty easy, and today I worked out how.

You will need to create a class in python that looks something like this:

class Callback():
    _public_methods_ = ['SetStatusText']
    _reg_progid_ = "MapInfo.PythonCallback"
    _reg_clsid_ = "{14EF8D30-8B00-4B14-8891-36B8EF6D51FD}"
    def SetStatusText(self,status):
        print status

This will be our callback object that we will need to create for MapInfo.

First I will explain what some of the funny stuff is:

  • _public_methods_ is a Python array of all the methods that you would like to expose to COM eg MapInfo in this case. This attribute is a must for creating a COM object.
  • _reg_progid_ is the name of your COM application or object.  This can be anything you would like.
  • _reg_clsid_ is the GUID, or unique id, for the object or app.  Do not use the one I have, call the following in a Python shell to create your own.
             import pythoncom
             pythoncom.CreateGuid()
             
  • SetStatusText is the MapInfo callback method that is called when the status bar changes in MapInfo.

In order to use the class as a COM object we have two more steps to complete, one is registering the COM object and the other is creating it.

First, in oder to register the object we call the following code from our main Python method:

if __name__ == "__main__":
    print "Registering COM server..."
    import win32com.server.register
    win32com.server.register.UseCommandLine(Callback)
    main()

This will register the COM object which will mean it can then be creating for use by MapInfo.

In order to create our callback in Python we call:

callback = win32com.client.Dispatch("MapInfo.PythonCallback")

and set it as our callback object for MapInfo:

mapinfo.SetCallback(callback)

So after all that the final code looks like this:

def main():
    from PyQt4.QtCore import *
    from PyQt4.QtGui import *
    from win32com.client import Dispatch
    import sys

    app = QApplication(sys.argv)
    app.setAttribute(Qt.AA_NativeWindows,True)
    wnd = QMainWindow()
    wnd.resize(400, 400)
    widget = QWidget()
    wnd.setCentralWidget(widget)
    wnd.show()

    handle = int(widget.winId())
    mapinfo = Dispatch("MapInfo.Application")
    callback = win32com.client.Dispatch("MapInfo.PythonCallback")
    mapinfo.SetCallback(callback)
    mapinfo.do('Set Next Document Parent %s Style 1' % handle)
    mapinfo.do('Open Table "D:\GIS\MAPS\Property.TAB"')
    mapinfo.do('Map from Property')

    app.exec_()

class Callback():
    """ Callback class for MapInfo """
    _public_methods_ = ['SetStatusText']
    _reg_progid_ = "MapInfo.PythonCallback"
    _reg_clsid_ = "{14EF8D30-8B00-4B14-8891-36B8EF6D51FD}"
    def SetStatusText(self,status):
        print status

if __name__ == "__main__":
    print "Registering COM server..."
    import win32com.server.register
    win32com.server.register.UseCommandLine(Callback)
    main()

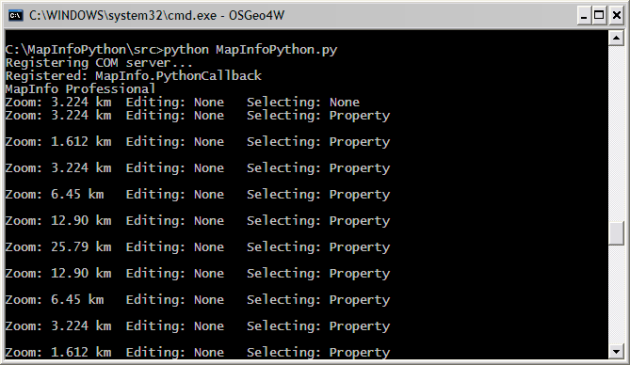
and the result is a map window and information printed to the console.

Information from MapInfo callback

I think Python could be a good language to prototype MapInfo based app, or even build a whole app itself. If you do end up making something of it let me know I am quite interested with what people could come up with.


Filed under: MapInfo, Mapinfo Programming, Open Source Tagged: gis, Mapbasic, mapinfo, mapinfo interop, mapinfo ole, MapInfo Professional, mapping, Open Source, python

MapInfo map control into Qt Python form

Tonight for a bit of fun, or shits and jiggles as we say here, I thought I would try and embed a MapInfo map control into a Qt python widget (although I should be studying, but it’s Saturday night) .

Turns out it is pretty easy!

pls send me teh codez? OK here you go.

from PyQt4.QtCore import *
from PyQt4.QtGui import *
from win32com.client import Dispatch
import sys

app = QApplication(sys.argv)
app.setAttribute(Qt.AA_NativeWindows,True)
wnd = QMainWindow()
wnd.resize(400, 400)
widget = QWidget()
wnd.setCentralWidget(widget)
wnd.show()

handle = int(widget.winId())
mapinfo = Dispatch("MapInfo.Application")
mapinfo.do('Set Next Document Parent %s Style 1' % handle)
mapinfo.do('Open Table "D:\GIS\MAPS\Property.TAB"')
mapinfo.do('Map from Property')

app.exec_()

The above code will load MapInfo and open the property layer into the Qt Widget control, with the result below.

MapInfo map in python Qt based form

So this means you don’t “always” have to write your MapInfo based apps in C# or C++; of course I already knew this as anything that can use OLE and provide a native window handle to MapInfo will work, I just never tried it.


Filed under: MapInfo, Mapinfo Programming, Open Source Tagged: gis, mapinfo, mapinfo interop, mapinfo ole, MapInfo Professional, mapping, Open Source, python

Generating contour lines in QGIS

One of the cool things I love about QGIS is finding stuff that you didn’t know it could do, well not just itself but plugins that you didn’t know about.

Today my discovery was in how to generate contour lines from a point layer.

  1. First install the contour plugin for qgis via the plugin installer.  Just search for “contour”
  2. Once installed open a vector point layer in QGIS.  Make sure the point layer has a field that you can use for elevation.

    One I prepared earlier

  3. Then select from the menu: Plugins->Contour->Contour
  4. Fill in the information

    Details form (The above setting will generate 0.5m contours)

  5. Press OK
  6. Results

    Results from plugin

  7. Profit??

The resulting contours will have a field that contains the label and z value for each contour line, you can then just label or color them how you wish.

Note:  There is a bug with QGIS memory layers where the fields don’t  show up in dropdown or attribute browsers, a simple fix is just to make the layer editable and then non editable then the fields will be there.

The contour layer is a QGIS memory layer so remember to save it to disk eg a shapefile before you close you will loose your new fancy contour layer.

Happy mapping :)


Filed under: MapInfo, Open Source, qgis Tagged: gis, mapping, Open Source, python, qgis, shapely

Picture: MapInfo to QGIS Styling

Just a quick one.

This afternoon I was having a go at getting our work MapInfo layers to look the same in QGIS as they do in MapInfo.  I wanted to do this; 1) So I can print maps from both systems for people and they are a consistent style 2) Would rather use QGIS for every day map work.  3) To see what they compare like.    I think it came out pretty good, apart from few symbols that I didn’t get time to finish.

MapInfo vs QGIS

Note that MapInfo has anti-aliasing and transparency  turned off, as it makes MapInfo very slow and render any output as bitmaps rather than vectors (poor).  Where as QGIS is using both, as it doesn’t suffer from the same problems.

EDIT: To be fair here is both with the best settings turned on.  They are pretty much the same, which is a good thing.


Filed under: MapInfo, Open Source, qgis Tagged: mapinfo, mapping, Open Source, qgis, Quantum GIS

MapInfo and QGIS – An overview

Disclaimer: Like all my blog posts, this post is a reflection of my opinions and my opinions only. They do not reflect the opinions of my employer.

Recently I have got more into the open source movement, with my coding and my choice of software.  I tend to try to pick open source software for a couple of reasons, one of the main things is being free but apart from that I try to pick software that I can use to improve my development skills.  Being able to view the code is a big plus for me, being able to change and improve the software myself is an even bigger plus.

My most recent pick has been rediscovering QGIS (Quantum GIS), a free and open source GIS system written [mostly] in C++ using the Qt framework, and extensible by both Python and C++. I first discovered QGIS a couple of years ago, I was impressed but not impressed enough to really get into it. Maybe it was that I was so used to MapInfo I didn’t give it a proper look; or I didn’t really have the data in the right format, as I mainly used MapInfo, and if it couldn’t open and edit MapInfo TAB files I didn’t want to use it; or just lack of time; or whatever the reason. I used it for a day thought “Yep cool” and went back to using MapInfo.

Recently, however, they released QGIS 1.5 [and now QGIS 1.6] which changed the way I looked at the software.

The first thing I noticed was it was a lot faster in regards to map rendering then it used to be, not as fast as MapInfo but still very usable and efforts are being made to improve it even more so.

Styling of the layers has also improved a lot since I first tried it, it now has stack styling for points, lines and regions. Stack styles is something that was introduced in MapInfo 10.5, but unlike MapInfo, QGIS allows you to create a stacked style for each feature class rather than a style override like in MapInfo.  So you have a lot more control with styling in QGIS then you do in MapInfo.

QGIS styling dialogs for lines

and styles applied:

Ok not that pretty but it's a demo image.

Styling in QGIS is also only based on the underlying data of the object, think thematic maps in MapInfo.  I kind of like this, rather than just being able to just style an object you need to think about the data that is stored with an object.  This also stops the style and data getting out of sync.  At times I have seen maps made in MapInfo with no information on the object but  just styled to show different classes.

QGIS supports a large number of formats. It can open and write tab files but just not at the same time, no big deal as you can always use shape or a postgis database then just convert back if needed.

QGIS also has an interesting plugin system, while being able to use C++ and Python, the main app has a plugin installer [a plugin itself] which lets you install plugins from “hosted repositories”.  This makes finding new tools with work with very easy.

Plugin installer. Very very handy.

Composers are basically MapInfo layout windows, they allow you to add maps, legends, text labels, dynamic scale bar. attribute tables.  Composers can be exported to svg, pdf or printed just like layouts and you can have as many composers as you need.
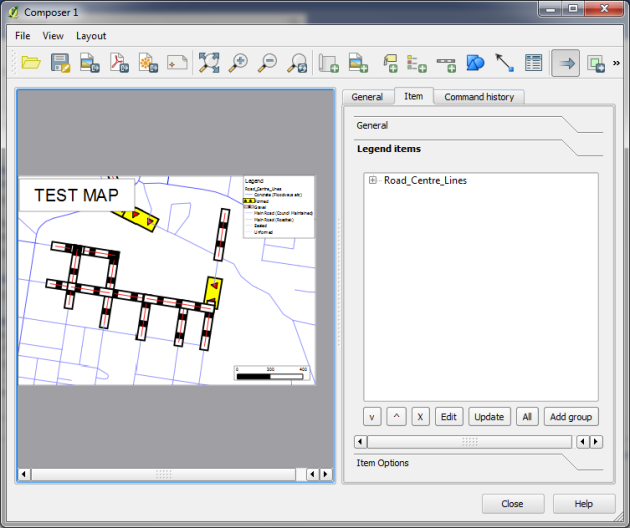
A composer window for QGIS

Labeling options in QGIS are pretty much the same as MapInfo, if not more. You have the ability to use columns from a table that defines information about labels eg colour, X and Y etc if needed.

But one big feature that I really like about QGIS is the info tool. Unlike MapInfos info tool, you can define per table how and what information is displayed for each column and there is no stupid Ctrl+C copy bug.  It’s a bit hard to explain so a picture saves a thousand words:
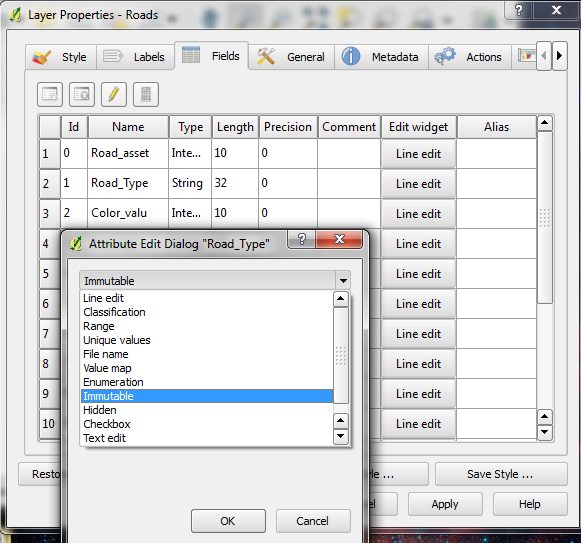
Defining each how each column should be displayed.

and editing or adding a new feature:

When editing or adding features this dialog is shown.

For me as a developer the one thing that I find great with QGIS is it has a very kind and active developer community, though both IRC and email, and the code is relatively well organized .   I was able to pull down the source code for the latest trunk and have a build running in Ubuntu in under a hour [this mainly being due to my lack of Linux experience].   Being able to see something you don’t like, change it and submit it back to the project is a very good feeling.

Some downsides:

While QGIS is very good, and is always improving, it doesn’t always win over MapInfo in everything.  One major thing that MapInfo has going is its SQL, being able to run the same SQL syntax over any kind of table in MapInfo is a great feature.   QGIS, in this regard, tends to leave those things up to the underlying provider.  You are able to run simple [or complex] queries on an open table but being able to do something like “Select Col1, Col2, Col3 From Table Where Col1 = “SomeCondition” Group By Col2″  isn’t really there, although if you are running PostGIS it is quite easy.
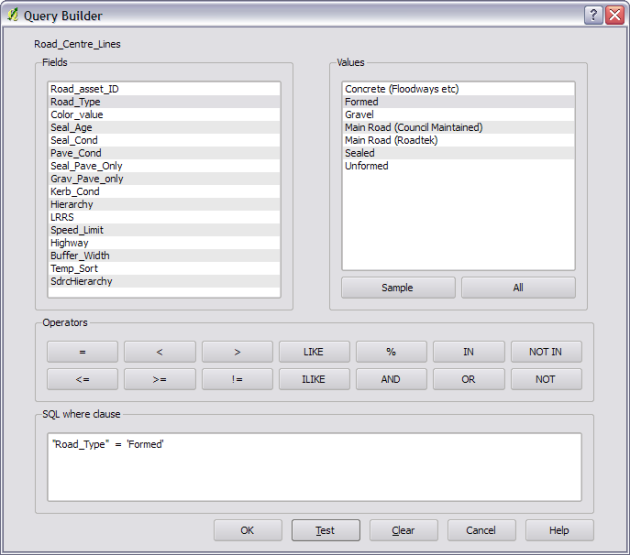
Query

QGIS Query builder.

The next big thing MapInfo has, is MAPBASIC.  While QGIS has a built-in Python shell and has a relatively good API, MAPBASIC is very easy language to get up to speed with especially for beginners.

MapInfo also has multiple map windows, this is something that isn’t currently implemented in QGIS.  However I did bring it up on the #qgis IRC channel and the developers seemed happy with the idea but just needed time and someone to implement it.

Summary:

I could talk all day about all the cool things that QGIS can do but to save boring you I’ll leave it at this for now, more posts to come in the future I’m sure.

At the moment for my current day-to-day map work, I have gone from using MapInfo to using QGIS almost full time.  Like mentioned above, there are still some things that MapInfo does well and I tend to use MapInfo for those kind of jobs.  Also as my employer uses MapInfo and runs pretty much a full MapInfo system, I still use it for maintaining things like Exponare.  Using and developing for QGIS also means I have fallen behind on my MapInfo .Net tools, I still have a couple on the go and plan to get them out just before Christmas [or maybe a little bit after]

So my overall impressions with QGIS, if you couldn’t tell already, are: very very impressed with a very strong feeling it’s only going to get better.

So if you’re interested in trying something new, give QGIS a go.

Some handy links:


Filed under: Open Source, qgis Tagged: mapinfo, Open Source, qgis

Back to Top

Sustaining Members