Related Plugins and Tags

QGIS Planet

Delete all branches on a github repo

I forked the QGIS repo on GitHub a little while ago although one thing that bothered me was that it gave me copies of all the branches that the main QGIS git repo had.  This is understandable as it’s the way it works however I don’t really need all these branches in my forked copy of the repo as I don’t care about them.   I only care the ones I am working on, and I don’t want to see a big list of branches in my git fork that have nothing to do with me.

So the next question was how do I delete all the branches on the remote repo at GitHub. Well you would normally do:

git push origin :branch_name

although doing that by hand for each branch is, well, a pain in the butt! After a chat with a guy (strk) on the #qgis IRC channel who is more skilled at bash then me (I’m still a Linux noob) he came up with this:

git branch -r | grep origin/ | grep -v master | grep -v HEAD| cut -d/ -f2 | while read line; do git push origin :$line; done;

Very handy.


Filed under: Open Source, qgis Tagged: git, Open Source, OSS, qgis, Quantum GIS

The things I would like to see in QGIS. What are yours?

So if you have not already guessed from my increasing post about QGIS. I really like it as a GIS system but with all systems it comes with its shortcomings. (Nothing that can’t be fixed of course)

Here is my little wishlist of a few things I would love to see in QGIS.

Multipule map canvases. (ArcGIS, MapInfo)

I was thinking more like ArcGIS data frames vs something like what MapInfo has (multiple windows).  I think the multi window system can add confusion for people new to GIS, plus I hate having to window manage.

SQL like interface. (MapInfo)

This is something that I really like from MapInfo.  It adds a lot of power to the application being able to spatially join two tables that don’t share a command link column and get back a new layer.  Adding this to QGIS could be a pretty big task, although a very rewarding one IMO.  

Now there is some credit in saying “well you can just import your data into PostGIS and use that”, however that is not always a option and I think having a layer above that can query any open layer would be very very powerful.

These are just two of the main things that I would like to see, I’ll update the post if I can think of anymore.

Of course being open source I can write the features myself but C++ is still a bit over my head at the moment.

I would love to see what other peoples thoughts, or mini wishlists, are.  So if you are willing, drop a comment and let me know.


Filed under: MapInfo, Open Source, qgis Tagged: Feature Requests, gis, mapinfo, Open Source, OSS, qgis, Quantum GIS

Opening MS SQL Server 2008 Spatial tables in QGIS

EDIT:  If you are having trouble opening MS SQL 2008 in QGIS I will have a blog post coming explaining how to correct it. Or you can read the comments between TheGeoist and I below which will have the answer.

Just a quick tip.

Thanks to GDAL/OGR 1.8 QGIS can now open MS SQL Server 2008 spatial tables via the OGR MSSQLSpatial driver.

First you must be running a version of QGIS that is using GDAL/OGR 1.8.  Opening the QGIS about page will tell you if it is supported.

Need version 1.8 or higher

As I am writing this on my Ubuntu install I only have version 1.6.3 but the latest dev version of QGIS (upcoming 1.7 release) for Windows in the OSGeo4W installer is complied with version 1.8.

Now open the python console in QGIS and type the following:

uri = "MSSQL:server={serverName};database={databaseName};tables={tableName};trusted_connection=yes"
qgis.utils.iface.addVectorLayer(uri,'{yourLayerNameHere}','ogr')

Replacing {serverName} with your server name, if installed on your local machine you can use localhost; {databaseName} with the name of the database with the tables;{tableName} with the table to open; {yourLayerNameHere} with the name you would like the layer to have in the map legend.

After that you should see your MS SQL Spatial table displayed in QGIS, with editing support.

At the moment there is no nice interface in QGIS to open MS SQL tables like there is for PostGIS, although that might be a good plugin project for someone to work on.


Filed under: Open Source, qgis Tagged: gis, mapping, MS SQL Server 2008, MS SQL Spatial, Open Source, OSS, python, qgis, Quantum GIS

Getting ECW and MrSID support working in QGIS dev OSGeo4W install

Note:  This post is about getting ecw and mrsid support working in the trunk (qgis-dev) version of QGIS which is installed with the OSGeo4W installer.  Non-dev versions seem to work fine following this method: http://www.qgis.org/wiki/OSGeo4wSetup#Installing_support_for_raster__.2A.ECW_.28ERMapper.29_and_.2A.sid_.28MrSid.29_formats

Getting ECW and MrSID support into QGIS can be a real pain in the butt when you first try; but once you know how it’s easy.

If you try to open a ecw file in QGIS you will get this nice little error message:

What?  I thought QGIS supported ECW files!

Turns out it does, but the team are not able to ship the required libs with the program due to licensing restrictions by ERDAS.   Luckily adding support is not “too” hard.

  1. First head over to http://www.erdas.com/products/ERDASECWJPEG2000SDK/Downloads.aspx
  2. Click Download Now for the ERDAS ECW/JP2 SDK Desktop Read-Only, Version 4.1 libs,
  3. Fill out a bit of registration details and click though all the pages (this is the most painful process I have ever had to go though to get some libs for a program, ERDAS should be ashamed that it is such an effort.)
  4. Once you have download ECWJP2SDKSetup_RO_20100920.exe; install it.
  5. Copy all the files from C:\Program Files\ERDAS\ERDAS ECW JPEG2000 Read SDK\bin\vc90\win32 into the bin folder of your OSGeo4W install (default is C:\OSGeo4W\bin)
    You can open the OSgeo4W shell and run: copy “C:\Program Files\ERDAS\ERDAS ECW JPEG2000 Read SDK\bin\vc90\win32\*.dll” %OSGEO4W_ROOT%\bin to do the same thing.
  6. Launch osgeo4w-setup.exe, the installer that you used to install qgis-dev,  and select  gdal-ecw, gdal17-ecw and gdal-mrsid, gdal17-sid under the libs section. Let it install the needed libs and any dependencies.
  7. Open %OSGEO4W_ROOT%\bin and search for qgis-dev.bat; open it with a text editor and add the following line:
    set GDAL_DRIVER_PATH=”%OSGEO4W_ROOT%”\bin\gdalplugins\1.8
    I always insert it just after  SET OSGEO4W_ROOT=
  8. Launch qgis-dev.bat
  9. Open a ecw

ECW file opened in QGIS

I have tested this on a couple of machines now but as always

with no guarantee that it will work on yours :)  (Although it should)


Filed under: Open Source, qgis Tagged: ecw, gis, mapping, mrsid, Open Source, qgis, Quantum GIS, raster

Getting total length of selected lines in QGIS via python

The other day I was trying to get the total length of the some selected lines in QGIS. In MapInfo I would just do

Select Sum(ObjectLen(obj,”m”)) from Selection

however QGIS doesn’t have the ability (yet..) to run SQL queries like this, but you can do it via python.

The following is a little python snippet that will get the total length of the selected objects. (You will need to have shapely installed to use)

from shapely.wkb import loads
def getLength():
    layer = qgis.utils.iface.mapCanvas().currentLayer()
    total = 0
    for feature in layer.selectedFeatures():
        geom = feature.geometry()
        wkb = geom.asWkb()
        line = loads(wkb)
        total = total + line.length
    return total

print getLength()

EDIT:Or as Peter asked in the comments, yes you can just call length on the geometry:

def getLength():
    layer = qgis.utils.iface.mapCanvas().currentLayer()
    total = 0
    for feature in layer.selectedFeatures():
        geom = feature.geometry()
        total = total + geom.length()
    return total

print getLength()

Just copy and past that into your QGIS python console and call getLength() when ever you need the total length.

Note: I have found the QgsGeometry .legnth() function to be unstable in the past and it has crashed my QGIS instance. Just test it first, if not you can always use the shapely method.


Filed under: Open Source, qgis Tagged: gis, mapping, Open Source, python, qgis, Quantum GIS, shapely

Picture: MapInfo to QGIS Styling

Just a quick one.

This afternoon I was having a go at getting our work MapInfo layers to look the same in QGIS as they do in MapInfo.  I wanted to do this; 1) So I can print maps from both systems for people and they are a consistent style 2) Would rather use QGIS for every day map work.  3) To see what they compare like.    I think it came out pretty good, apart from few symbols that I didn’t get time to finish.

MapInfo vs QGIS

Note that MapInfo has anti-aliasing and transparency  turned off, as it makes MapInfo very slow and render any output as bitmaps rather than vectors (poor).  Where as QGIS is using both, as it doesn’t suffer from the same problems.

EDIT: To be fair here is both with the best settings turned on.  They are pretty much the same, which is a good thing.


Filed under: MapInfo, Open Source, qgis Tagged: mapinfo, mapping, Open Source, qgis, Quantum GIS

QGIS and GRASS in Local Government Bushfire Hazard Mapping – A Case Study

QGIS and GRASS in Local Government Bushfire Hazard MappingIntroduction

The Southern Downs Regional Council (SDRC) is a small-to-medium sized local government in south east Queensland, Australia. The council region, mainly the southern part, suffers from major bushfires.  Bushfire is a real and present concern for the residents and landowners in the Southern Downs Region, and has resulted in the loss of life and property.

This project will allow the council and the people of the region to be more aware of the risk and to allow for better decision making in the future.

The Project
As bushfire is not only a problem for SDRC but also for the whole of Queensland, the state government requires that each local government identifies the bushfire hazard in their area via the State Planning Policy 1/03 Mitigating the Adverse Impacts of Flood, Bushfire and Landslide [1].  This kind of job would normally be done using consultants but was instead done by the council itself using a combination of QGIS and GRASS.

The GIS side of the project project was broken down into 6 main steps

  1. Slope assessment and mapping
  2. Aspect assessment and mapping
  3. Vegetation assessment and mapping
  4. Combining scores to identify the severity of bushfire hazard
  5. Field verification and qualitative assessment
  6. Final Maps

The use of QGIS and GRASS
QGIS, using the GRASS plugin, was selected as it provided the tools needed to complete the job and the interaction between QGIS and GRASS made it easy to process the raster maps and present them in a meaningful way to users.  SDRC uses MapInfo for its main GIS system, however MapInfo’s addons were not as powerful as GRASS GIS for raster processing.

The QGIS GRASS plugin was used to import 5 meter contours of the whole region into GRASS which were then converted into a contour raster map using r.surf.contour.  A slope and aspect map were then generated using r.slope.aspect from the raster contour map.  Categories groups were assigned to different slope and aspect ranges and given a risk sore.  Vegetation areas were also given different risk scores.  All the resulting raster maps were then combined using mapcalc and given a final risk hazard score.  The risk scores are then divided into three main categories: high; medium; and low.  

The final part of the process was field verification via the rural fire service. After the review process, QGIS was used to print the final maps for presentation.

As all GRASS commands can be run from the command line, all the commands that were needed to generate the bushfire hazard maps were recorded, for documentation purposes and for if the maps needed to be regenerated some time in the future.

Conclusion.
Overall QGIS, together with the GRASS plugin, provided a great experience and a great final outcome for the council doing their own bushfire hazard mapping.  The GRASS plugin provides a very easy to use interface to GRASS through QGIS.  As QGIS is able to open the GRASS raster format natively, integration is very seamless and maps can be made with ease.

The project won an encouragement award at the Queensland Planning Institute of Australia state planning awards in 2010 [2]

References
[1] http://www.emergency.qld.gov.au/publications/spp/
[2]http://digital.crowtherblayne.com.au/default.aspx?xml=crowther_pia.xml


Filed under: Open Source, qgis Tagged: bushfire, case study, GRASS GIS, Open Source, qgis, Quantum GIS

Generating a Gource source commit history visualization for QGIS (Quantum GIS)

A couple of days I found a pretty cool open source project for visualizing the history of version controlled code.  The project is called Gource and can be found here: http://code.google.com/p/gource/ On the videos wiki page there are a few videos of other projects that have used gource to generate cool videos of their commit history so I thought I should make one for QGIS.

After downloading and building the latest source for Gource and fetching the current trunk of QGIS following these instructions: http://spatialgalaxy.net/2010/12/27/contributing-to-qgis-using-git/ I ran the following in my terminal on my Ubuntu machine, with my current directory being the download git repo from the above instructions:

  gource --title "Quantum GIS" --logo images\icons\qgis-icon.png \
  --hide filenames --date-format "%d, %B %Y" --seconds-per-day 0.15 \
  --highlight-all-users --auto-skip-seconds 0.5 --file-idle-time 0 --max-files 999999999 \
  --multi-sampling --stop-at-end --elasticity 0.1 -b 000000 \
  --disable-progress --user-friction .2 --output-ppm-stream - | \
  ffmpeg -an -threads 4 -y -b 3000K -vb 8000000 -r 60 -f image2pipe \
  -vcodec ppm -i - -vcodec libx264 -vpre libx264-medium qgis.mp4

Don’t worry I know it looks crazy but it’s really not that bad.  I’ll break it down.

  • –title “Quantum GIS” Well, yeah, adds a title to the project.
  • –logo images/icons/qgis-icon.png Adds a icon watermark
  • –hide filenames This hides the filenames of the files being committed . I hide these because it makes it pretty hard to see.
  • –date-format “%d, %B %Y” Formats the date at the top of the video.
  • –seconds-per-day 0.15 How many seconds represent a day. The lower this is the fast a day goes by, meaning me commits in less time.
  • –highlight-all-users Highlights all the users all the time.
  • –auto-skip-seconds 0.5 If there are no commits for this time it will skip to the next commit.
  • –file-idle-time 0 How long before the file disappears from the video, 0 means never good for seeing the full file tree.
  • –stop-at-end Stops the video at the end of all the commits.
  • -b 000000 The background colour, in this case black.
  • –output-ppm-stream – Tells gource to output the result ppm stream to STDOUT, which is then piped ( | ) into the ffmpeg

That is a quick overview of some of the gource arguments, running grouce -H in your terminal will print out the full list.  I’m not going to go into the ffmpeg arguments because frankly I don’t understand them very well and video isn’t really my thing.  I’m sure there are ffmpeg experts that would be able to do it better then what I have.

After running the above commands in my terminal window and letting it do its thing, I had a resulting mp4 file which I then uploaded to YouTube.

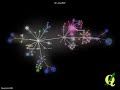
Below is the video that I uploaded to YouTube, which took about 5 hours due to my very very slow (read 138kb/s) upload speed.  The video is about 8 years of QGIS development in just over 9 minutes.

As it’s a bit hard to see in the video due to the quality, each cluster of files is a directory and the branches show the folder hierarchy.

Direct link to video: http://www.youtube.com/watch?v=-NILKRiMtcU

Happy new year and happy coding :)


Filed under: Open Source, qgis Tagged: git, Gource, mapping, Open Source, qgis, Quantum GIS

Back to Top

Sustaining Members