Related Plugins and Tags

QGIS Planet

Implementing an in-house “New Project Wizard” for QGIS

Recently, we were required to implement a custom “New Project Wizard” for use in a client’s internal QGIS installation. The goal here was that users would be required to fill out certain metadata fields whenever they created a new QGIS project.

Fortunately, the PyQGIS (and underlying Qt) libraries makes this possibly, and relatively straightforward to do. Qt has a powerful API for creating multi-page “wizard” type dialogs, via the QWizard and QWizardPage classes. Let’s have a quick look at writing a custom wizard using these classes, and finally we’ll hook it into the QGIS interface using some PyQGIS magic.

We’ll start super simple, creating a single page wizard with no settings. To do this we first create a Page1 subclass of QWizardPage, a ProjectWizard subclass of QWizard, and a simple runNewProjectWizard function which launches the wizard. (The code below is designed for QGIS 3.0, but will run with only small modifications on QGIS 2.x):


class Page1(QWizardPage):

    def __init__(self, parent=None):
        super().__init__(parent)
        self.setTitle('General Properties')
        self.setSubTitle('Enter general properties for this project.')


class ProjectWizard(QWizard):
    
    def __init__(self, parent=None):
        super().__init__(parent)
        
        self.addPage(Page1(self))
        self.setWindowTitle("New Project")


def runNewProjectWizard():
    d=ProjectWizard()
    d.exec()

If this code is executed in the QGIS Python console, you’ll see something like this:

Not too fancy (or functional) yet, but still not bad for 20 lines of code! We can instantly make this a bit nicer by inserting a custom logo into the widget. This is done by calling setPixmap inside the ProjectWizard constructor.


class ProjectWizard(QWizard):
    
    def __init__(self, parent=None):
        super().__init__(parent)
        
        self.addPage(Page1(self))
        self.setWindowTitle("New Project")

        logo_image = QImage('path_to_logo.png')
        self.setPixmap(QWizard.LogoPixmap, QPixmap.fromImage(logo_image))

That’s a bit nicer. QWizard has HEAPS of options for tweaking the wizards — best to read about those over at the Qt documentation. Our next step is to start adding some settings to this wizard. We’ll keep things easy for now and just insert a number of text input boxes (QLineEdits) into Page1:


class Page1(QWizardPage):

    def __init__(self, parent=None):
        super().__init__(parent)
        self.setTitle('General Properties')
        self.setSubTitle('Enter general properties for this project.')

        # create some widgets
        self.project_number_line_edit = QLineEdit()
        self.project_title_line_edit = QLineEdit()
        self.author_line_edit = QLineEdit()        
        
        # set the page layout
        layout = QGridLayout()
        layout.addWidget(QLabel('Project Number'),0,0)
        layout.addWidget(self.project_number_line_edit,0,1)
        layout.addWidget(QLabel('Title'),1,0)
        layout.addWidget(self.project_title_line_edit,1,1)
        layout.addWidget(QLabel('Author'),2,0)
        layout.addWidget(self.author_line_edit,2,1)
        self.setLayout(layout)

There’s nothing particularly new here, especially if you’ve used Qt widgets before. We make a number of QLineEdit widgets, and then create a grid layout containing these widgets and accompanying labels (QLabels). Here’s the result if we run our wizard now:

So now there’s the option to enter a project number, title and author. The next step is to force users to populate these fields before they can complete the wizard. Fortunately, QWizardPage has us covered here and we can use the registerField() function to do this. By calling registerField, we make the wizard aware of the settings we’ve added on this page, allowing us to retrieve their values when the wizard completes. We can also use registerField to automatically force their population by appending a * to the end of the field names. Just like this…

class Page1(QWizardPage):
    def __init__(self, parent=None):
        super().__init__(parent)
        ...
        self.registerField('number*',self.project_number_line_edit)
        self.registerField('title*',self.project_title_line_edit)
        self.registerField('author*',self.author_line_edit)

If we ran the wizard now, we’d be forced to enter something for project number, title and author before the Finish button becomes enabled. Neat! By registering the fields, we’ve also allowed their values to be retrieved after the wizard completes. Let’s alter runNewProjectWizard to retrieve these values and do something with them:

def runNewProjectWizard():
   d=ProjectWizard()
   d.exec()

   # Set the project title
   title=d.field('title')
   QgsProject.instance().setTitle(d.field('title'))

   # Create expression variables for the author and project number
   number=d.field('number')
   QgsExpressionContextUtils.setProjectVariable(QgsProject.instance(),'project_number', number)
   author=d.field('author')
   QgsExpressionContextUtils.setProjectVariable(QgsProject.instance(),'project_author', author)
 

Here, we set the project title directly and create expression variables for the project number and author. This allows their use within QGIS expressions via the @project_number and @project_author variables. Accordingly, they can be embedded into print layout templates so that layout elements are automatically populated with the corresponding author and project number. Nifty!

Ok, let’s beef up our wizard by adding a second page, asking the user to select a sensible projection (coordinate reference system) for their project. Thanks to improvements in QGIS 3.0, it’s super-easy to embed a powerful pre-made projection selector widget into your scripts, which even includes a handy preview of the area of the world that the projection is valid for.


class Page2(QWizardPage):

    def __init__(self, parent=None):
        super().__init__(parent)
        self.setTitle('Project Coordinate System')
        self.setSubTitle('Choosing an appropriate projection is important to ensure accurate distance and area measurements.')
        
        self.proj_selector = QgsProjectionSelectionTreeWidget()
        layout = QVBoxLayout()
        layout.addWidget(self.proj_selector)
        self.setLayout(layout)
        
        self.registerField('crs',self.proj_selector)
        self.proj_selector.crsSelected.connect(self.crs_selected)
        
    def crs_selected(self):
        self.setField('crs',self.proj_selector.crs())
        self.completeChanged.emit()
        
    def isComplete(self):
        return self.proj_selector.crs().isValid()

There’s a lot happening here. First, we subclass QWizardPage to create a second page in our widget. Then, just like before, we add some widgets to this page and set the page’s layout. In this case we are using the standard QgsProjectionSelectionTreeWidget to give users a projection choice. Again, we let the wizard know about our new setting by a call to registerField. However, since QWizard has no knowledge about how to handle a QgsProjectionSelectionTreeWidget, there’s a bit more to do here. So we make a connection to the projection selector’s crsSelected signal, hooking it up to a function which sets the wizard’s “crs” field value to the widget’s selected CRS. Here, we also emit the completeChanged signal, which indicates that the wizard page should re-validate the current settings. Lastly, we override QWizardPage’s isComplete method, checking that there’s a valid CRS selection in the selector widget. If we run the wizard now we’ll be forced to choose a valid CRS from the widget before the wizard allows us to proceed:

Lastly, we need to adapt runNewProjectWizard to also handle the projection setting:


def runNewProjectWizard():
    d=ProjectWizard()
    d.exec()

    # Set the project crs
    crs=d.field('crs')
    QgsProject.instance().setCrs(crs)

    # Set the project title
    title=d.field('title')
    ...

Great! A fully functional New Project wizard. The final piece of the puzzle is triggering this wizard when a user creates a new project within QGIS. To do this, we hook into the iface.newProjectCreated signal. By connecting to this signal, our code will be called whenever the user creates a new project (after all the logic for saving and closing the current project has been performed). It’s as simple as this:


iface.newProjectCreated.connect(runNewProjectWizard)

Now, whenever a new project is made, our wizard is triggered – forcing users to populate the required fields and setting up the project accordingly!

There’s one last little bit to do – we also need to prevent users cancelling or closing the wizard before completing it. That’s done by changing a couple of settings in the ProjectWizard constructor, and by overriding the default reject method (which prevents closing the dialog by pressing escape).


class ProjectWizard(QWizard):
    
    def __init__(self, parent=None):
        super().__init__(parent)
        ...
        self.setOption(QWizard.NoCancelButton, True)
        self.setWindowFlags(self.windowFlags() | QtCore.Qt.CustomizeWindowHint)
        self.setWindowFlags(self.windowFlags() & ~QtCore.Qt.WindowCloseButtonHint)

    def reject(self):
        pass

Here’s the full version of our code, ready for copying and pasting into the QGIS Python console:


icon_path = '/home/nyall/nr_logo.png'

class ProjectWizard(QWizard):
    
    def __init__(self, parent=None):
        super().__init__(parent)
        
        self.addPage(Page1(self))
        self.addPage(Page2(self))
        self.setWindowTitle("New Project")
        
        logo_image=QImage('path_to_logo.png')
        self.setPixmap(QWizard.LogoPixmap, QPixmap.fromImage(logo_image))
        
        self.setOption(QWizard.NoCancelButton, True)
        self.setWindowFlags(self.windowFlags() | QtCore.Qt.CustomizeWindowHint)
        self.setWindowFlags(self.windowFlags() & ~QtCore.Qt.WindowCloseButtonHint)
    def reject(self):
        pass
class Page1(QWizardPage):
    
    def __init__(self, parent=None):
        super().__init__(parent)
        self.setTitle('General Properties')
        self.setSubTitle('Enter general properties for this project.')

        # create some widgets
        self.project_number_line_edit = QLineEdit()
        self.project_title_line_edit = QLineEdit()
        self.author_line_edit = QLineEdit()        
        
        # set the page layout
        layout = QGridLayout()
        layout.addWidget(QLabel('Project Number'),0,0)
        layout.addWidget(self.project_number_line_edit,0,1)
        layout.addWidget(QLabel('Title'),1,0)
        layout.addWidget(self.project_title_line_edit,1,1)
        layout.addWidget(QLabel('Author'),2,0)
        layout.addWidget(self.author_line_edit,2,1)
        self.setLayout(layout)
        
        self.registerField('number*',self.project_number_line_edit)
        self.registerField('title*',self.project_title_line_edit)
        self.registerField('author*',self.author_line_edit)
 
 
class Page2(QWizardPage):
    
    def __init__(self, parent=None):
        super().__init__(parent)
        self.setTitle('Project Coordinate System')
        self.setSubTitle('Choosing an appropriate projection is important to ensure accurate distance and area measurements.')
        
        self.proj_selector = QgsProjectionSelectionTreeWidget()
        layout = QVBoxLayout()
        layout.addWidget(self.proj_selector)
        self.setLayout(layout)
        
        self.registerField('crs',self.proj_selector)
        self.proj_selector.crsSelected.connect(self.crs_selected)
        
    def crs_selected(self):
        self.setField('crs',self.proj_selector.crs())
        self.completeChanged.emit()
        
    def isComplete(self):
        return self.proj_selector.crs().isValid()
 
        
def runNewProjectWizard():
    d=ProjectWizard()
    d.exec()
    
    # Set the project crs
    crs=d.field('crs')
    QgsProject.instance().setCrs(crs)
    
    # Set the project title
    title=d.field('title')
    QgsProject.instance().setTitle(d.field('title'))

    # Create expression variables for the author and project number
    number=d.field('number')
    QgsExpressionContextUtils.setProjectVariable(QgsProject.instance(),'project_number', number)
    author=d.field('author')
    QgsExpressionContextUtils.setProjectVariable(QgsProject.instance(),'project_author', author)
    
    
iface.newProjectCreated.connect(runNewProjectWizard)

Exploring Reports in QGIS 3.0 – the Ultimate Guide!

In 2017 North Road ran a crowd funding campaign for extending QGIS’ Print Composer and adding a brand new reporting framework to QGIS. Thanks to numerous generous backers, this campaign was a success. With the final QGIS 3.0 release just around the corner, we thought this was a great time to explore the new reporting engine and what it offers.

We’ll start with a relatively simple project, containing some administrative boundaries, populated places, ports and airports.

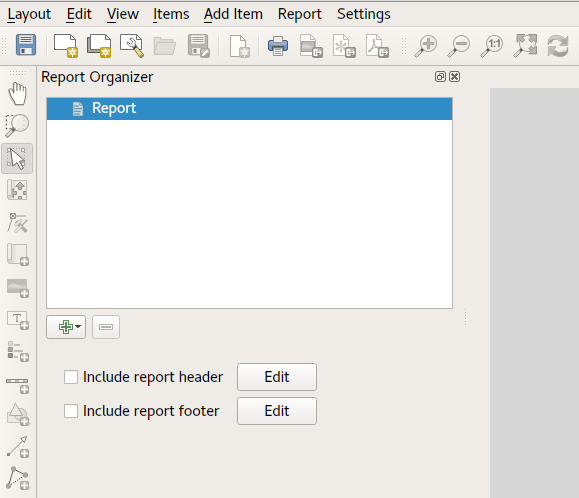
Using the “Project” – “New Report” command, we then create a new blank report. Initially, there’s not much to look at – the dialog which is displayed looks much like the QGIS 3.0 Layout Designer, except for the new “Report Organizer” panel shown on the left:

QGIS reports can consist of multiple, nested sections. In our new blank report we initially have only the main report section. The only options present for this report section is to include an optional header and footer for the report. If we enable these, the header will be included as the very first page (or pages… individual parts of reports can be multi-page if desired) in the report, and the footer would be the last page. Let’s go ahead and enable the header, and hit the “Edit” button next to it:

A few things happen as a result. Firstly, an edit pencil is now shown next to the “Report” section in the Report Organizer, indicating that the report section is currently being edited in the designer. We also see a new blank page shown in the designer itself, with the small “Report Header” title. In QGIS reports, every component of the report is made up of individual layouts. They can be created and modified using the exact same tools as are available for standard print layouts – so you can use any desired combination of labels, pictures, maps, tables, etc. Let’s add some items to our report header to demonstrate:

We’ll also create a simple footer for the report, by checking the “Include report footer” option and hitting “Edit“.

Before proceeding further, let’s export this report and see what we get. Exporting is done from the Report menu – in this case we select “Export Report as PDF” to render the whole report to a PDF file. Here’s the not-very-impressive result – a two page PDF consisting of our header and footer:

Let’s make things more interesting. By hitting the green “+” button in the Report Organizer, we’re given a choice of new sections to add to our report.

Currently there’s two options – a “Single section” and a “Field group“. Expect this list to grow in future QGIS releases, but for now we’ll add a Field Group to our report. At its most basic level, you can think of a Field Group as the equivalent of a print atlas. You select a layer to iterate over, and the report will insert a section for each feature found. Selecting the new Field Group section reveals a number of new related settings:

In this case we’ve setup our Field Group so that we iterate over all the states from the “Admin Level 1” layer, using the values from the “adm1name” field. The same options for header and footer are present, together with a new option to include a “body” for this section. We’ll do that, and edit the body:

We’ve setup this body with a map (set to follow the current report feature – just like how a map item in an atlas can follow the current atlas feature), and a label showing the state’s name. If we went ahead and exported our report now, we’d get something like this:

First, the report header, than a page for each state, and finally the report footer. So more or less an atlas, but with a header and footer page. Let’s make things more interesting by adding a subsection to our state group. We do this by first selecting the state field group in the organizer, then hitting the + button and adding a new Field Group:

When a field group is iterating over its features, it will automatically filter these features to match the feature attributes from its parent groups. In this case, the subsection we added will iterate over a “Populated Places” layer, including a body section for each place encountered. The magic here is that the Populated Places layer has an attribute named “adm1name“, tagging each place with the state it’s contained within (if you’re lucky your data will already be structured like this – if not, run the Processing “Join by Location” algorithm and create your own field). When we export this report, QGIS will grab the first state from the Admin Level 1 layer, and then iterate over all the Populated Places with a matching “adm1name” value. Here’s what we get:

(Here we created a basic body for the Populated Places group, including a map of the place and a table of some place attributes). So our report is now a report header, a page for each state followed by a page for every populated place within that state, and finally the report footer. If we were to add a header for the Populated Places group, it would be included just before listing the populated places for each state:

Similarly, a footer for the Populated Places group would be inserted after the final place for each state is included.

In addition to nested subsections, subsections in a report can also be included consecutively. If we add a second subsection to the Admin Level 1 group for Airports, then our report will first list ALL the populated places for each state, followed by all the airports within that state, before proceeding to the next state. In this case our report would be structured like this:

(The key point here is that our Airports group is a subsection of the Admin Level 1 group – not the Populated Places group). Here’s what our report could look like now:

Combining nested and consecutive sections, together with section headers and footers allows for tons of flexibility. For instance, in the below report we add another field group as a child of the main report for the Ports layer. Now, after listing the states together with their populated places and airports, we’ll get a summary list of all the ports in the region:

This results in the last part of our report exporting as:

As you can start to imagine, reports in QGIS are extremely powerful and flexible! We’re extremely thankful for all the backers of our crowd funding campaign, without whom this work would not have been possible.

Stay tuned for more reporting and layouts work we have planned for QGIS 3.2!


24 Days of QGIS 3.0 Features

If you’re not following @northroadgeo on Twitter, you’ve probably missed our recent “24 Days of QGIS” countdown. Over December, we’ve been highlighting 24 different features which are coming with the QGIS 3.0 release. We’ve collected all of these below so you can catch up:

We hope you enjoyed the series! In it we’ve only highlighted just a few of the hundreds of new features coming in QGIS 3.0. There’s also a lot of behind-the-scenes changes which we haven’t touched, e.g. a switch to Python 3 and Qt 5 libraries, a brand new, rewritten QGIS server, new QGIS web client, enhanced metadata integration, GeoNode integration, a cleaner, stabler, easier PyQGIS API, 1000s more unit tests, and so much more.

You can download a 3.0 beta from the QGIS webpage, and report feedback at https://issues.qgis.org. A huge thanks to the mammoth effort of all the QGIS contributors, this is going to be a great release!

QGIS layouts rewrite – progress report #1

Following our recent successful QGIS Layout and Reporting Engine crowdfunding campaign, we’ve been hard at working ripping up the internals of the QGIS 2.x print composer and rebuilding a brand new, shiny QGIS layouts engine. This is exciting work – it’s very satisfying to be able to cleanup a lot of the old composer code in QGIS and take opportunities along the way to fix long standing bugs and add new features.

While it’s not ready for daily use yet, there’s already been a lot of interesting changes which have landed in the layouts work as a result of this campaign. Let’s take a look at what’s been implemented so far…

  • We’ve added support for different measurements units all throughout layouts. While this means it’s now possible to set page sizes using centimeters, inches, pixels, points, etc, it goes much deeper than just that. In layouts, everything which has a size or position can take advantage of this unit support. So you can have page sizes in centimeters, but a map item with a size set in points, and positioned in millimeters! Having pixels as a unit type makes creation of screen-based layouts much easier – even right down to pixel perfect positioning and sizing of items…
  • Page handling has been totally reworked. Instead of the single “number of pages” control available in QGIS 2.x, layouts have complete flexibility in page setup. It’s now possible to have a layout with mixed page sizes and orientations (including data defined page size for different pages in the layout!). 
  • A revised status bar, with improved layout interaction widgets. We’ve also taken the opportunity to add some new features like a zoom level slider and option to zoom to layout width:
  • Layout interaction tools (such as pan/zoom/insert item/etc) have been reworked. There’s now a much more flexible framework for creation of layout tools (based off the main QGIS map canvas approach), which even allows for plugins to implement their own layout interaction tools! As part of this we’ve addressed a long standing annoyance which meant that creating new items always drew the “preview” shape of the new item as a rectangle – even for non-rectangular items. Now you get a real shape showing exactly how the created item will be sized and positioned:
  • On the topic of plugins – the layout branch has full support for plugin-provided item types. This means that QGIS plugins can create new classes of items which can be added to a layout. This opens the door for plugins allowing charts and visualisations which take advantage of all the mature Python and JS charting libraries! This is a really exciting change – in 2.x there was no way for plugins to extend or interact with composer, so we’re really keen to see where the community takes this when 3.0 is released.
  • We’ve ported another feature commonly found in illustration/DTP applications. Now, when you’re creating a new item and just click in your layout (instead of click-and-drag), you get a handy dialog allowing you to specify the exact position and dimensions for the created item. You can again see in this dialog how layouts have full support for units for both the position and size:
  • Another oft-requested feature which we’ve finally been able to add (thanks to the refactored and cleaned code) is a context menu for layouts! It’s currently quite empty, but will be expanded as this work progresses…
  • Snapping to guides and grids has been reworked. We’ve added a new snapping marker to show exactly were items will be snapped to:
  • Snapping to guides now occurs when creating new layout items (this didn’t happen in Composer in 2.x – only snapping to grids occurred when drawing new items).
  • The snapped cursor position is shown in status bar whenever a snapped point will be used, instead of the unsnapped position.
  • Unlike in Composers in QGIS 2.x, Layouts in 3.0 adopt the standard UX of dragging out rulers to create guide lines (instead of clicking on a ruler position to create a new guide). Creation of a horizontal guide is now done by grabbing the top ruler and dragging it down, and a vertical guide is created by grabbing the left ruler and dragging it out to the layout.
  • Better feedback is given in the ruler when a guide can be dragged. We now show guide positions in the rulers, and give an indication (via mouse cursor change) when these guides can be repositioned by click-and-drag.
  • Another very exciting change is the addition of a new “Guide Manager”. The guide manager allows numeric modification of existing guides and creation of new guides. Finally it’s possible to position guides at exact locations! Again, you can see the full support for layout units in place here – guides can be positioned using any available unit.
  • There’s also a handy new shortcut in the Guide Manager to allow applying the guides from the current page to all other pages in your layout.
  • We’ve refined the snapping logic. In Composer in QGIS 2.x,  grids would always take precedence whenever both a grid and guide were within tolerance of a point. Now, guides will always take precedence – since they have been manually set by users we make the assumption that they have been explicitly placed at highly desirable snapping locations, and should be selected over the general background grid. Additionally, grid snapping was previously only done if BOTH the x and y of the point could be snapped to the grid. We now snap to the nearest grid line for x/y separately. This means if a point is close to a vertical grid line but not a horizontal one it will still snap to that nearby vertical grid line.
  • Lastly, we’ve added a handy context menu to the rulers:

This is just a taster of the great new functionality coming in QGIS 3.0. This is all a direct result of the forward-thinking investments and generosity of the backers in our QGIS Layout and Reporting Engine crowdfunding campaign. Without their contributions, none of this would be possible – so our thanks go out to those organisations and individuals once again!

Stay tuned for more updates as the work continues…


QGIS Layout and Reporting Engine Campaign – a success!

Thanks to the tireless efforts and incredible generosity of the QGIS user community, our crowdfunded QGIS Layout and Reporting Engine campaign was a tremendous success! We’ve reached the funding goal for this project, and as a result QGIS 3.0 will include a more powerful print composer with a reworked code base. You can read more about what we have planned at the campaign page.

We’d like to take this opportunity to extend our heartfelt thanks to all the backers who have pledged to support this project:

We’ve also received numerous anonymous contributions in addition to these – please know that the QGIS community extends their gratitude for your contributions too! This campaign was also successful thanks to The Agency for Data Supply and Efficiency, Denmark, who stepped up and have funded an initial component of this project directly.

We’d also like to thank every member of the QGIS community who assisted with promoting this campaign and bringing it to the attention of these backers. Without your efforts we would not have been able to reach these backers and the campaign would not have been successful.

We’ll be posting more updates as this work progresses. Stay tuned…


Point cluster renderer crowdfunding – successful!

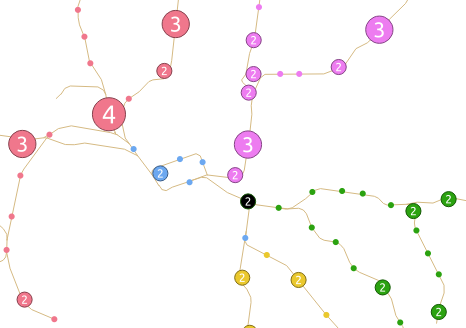
Great news! Thanks in part to some generous last minute pledges, our QGIS Point Cluster Renderer campaign has successfully reached its target. This means that QGIS 3.0 will now include a full feature and flexible cluster renderer.

In the meantime, we’d like to extend our warmest thanks to the following generous contributors, whose pledges have made this work possible:

  • Andreas Neumann
  • Qtibia Engineering (Tudor Barascu)
  • Karl-Magnus Jönsson
  • Geonesia (Nicolas Ponzo)

Plus numerous additional anonymous backers whose generous contributions are also highly valued. If you run into any of these funders at a QGIS user group or conference, make sure you treat them like the GIS rock-stars they are!

Keep an eye out on our social media accounts as we’ll be posting more video demonstrations of this work as it lands in the QGIS codebase.

BOTH

The road to QGIS 3.0 – part 1

qgis_icon.svgAs we discussed in QGIS 3 is under way, the QGIS project is working toward the next major version of the application and these developments have major impact on any custom scripts or plugins you’ve developed for QGIS.

We’re now just over a week into this work, and already there’s been tons of API breaking changes landing the code base. In this post we’ll explore some of these changes, what’s motivated them, and what they mean for your scripts.

The best source for keeping track of these breaking changes is to watch the API break documentation on GitHub. This file is updated whenever a change lands which potentially breaks plugins/scripts, and will eventually become a low-level guide to porting plugins to QGIS 3.0.

API clean-ups

So far, lots of the changes which have landed have related to cleaning up the existing API. These include:

Removal of deprecated API calls

The API has been frozen since QGIS 2.0 was released in 2013, and in the years since then many things have changed. As a result, different parts of the API were deprecated along the way as newer, better ways of doing things were introduced. The deprecated code was left intact so that QGIS 2.x plugins would still all function correctly. By removing these older, deprecated code paths it enables the QGIS developers to streamline the code, remove hacky workarounds, untested methods, and just generally “clean things up”. As an example, the older labelling system which pre-dates QGIS 2.0 (it had no collision detection, no curved labels, no fancy data defined properties or rule based labelling!) was still floating around just in case someone tried to open a QGIS 1.8 project. That’s all gone now, culling over 5000 lines of outdated, unmaintained code. Chances are this won’t affect your plugins in the slightest. Other removals, like the removal of QgsMapRenderer (the renderer used before multi-threaded rendering was introduced) likely have a much larger impact, as many scripts and plugins were still using QgsMapRenderer classes and calls. These all need to be migrated to the new QgsMapRendererJob and QgsMapSettings classes.

Renaming things for consistency

Consistent naming helps keep the API predictable and more user friendly. Lots of changes have landed so far to make the naming of classes and methods more consistent. These include things like:

  • Making sure names use consistent capitalization. Eg, there was previously methods named “writeXML” and “writeXml”. These have all been renamed to consistently use camel case, including for acronyms. (In case you’re wondering – this convention is used to follow the Qt library conventions).
  • Consistent use of terms. The API previously used a mix of “CRS” and “SRS” for similar purposes – it now consistently uses “CRS” for a coordinate reference system.
  • Removal of abbreviations. Lots of abbreviated words have been removed from the names, eg “destCrs” has become “destinationCrs”. The API wasn’t consistently using the same abbreviations (ie “dest”/”dst”/”destination”), so it was decided to remove all use of abbreviated words and replace them with the full word. This helps keep things predictable, and is also a bit friendlier for non-native English speakers.

The naming changes all need to be addressed to make existing scripts and plugins compatible with QGIS 3.0. It’s potentially quite a lot of work for plugin developers, but in the long term it will make the API easier to use.

Changes to return and argument types

There’s also been lots of changes relating to the types of objects returned by functions, or the types of objects used as function arguments. Most of these involve changing the c++ types from pointers to references, or from references to copies. These changes are being made to strengthen the API and avoid potential crashes. In most cases they don’t have any affect on PyQGIS code, with some exceptions:

  • Don’t pass Python “None” objects as QgsCoordinateReferenceSystems or as QgsCoordinateTransforms. In QGIS 3.0 you must pass invalid QgsCoordinateReferenceSystem objects (“QgsCoordinateReferenceSystem()”) or invalid QgsCoordinateTransform (“QgsCoordinateTransform()”) objects instead.

Transparent caching of CRS creation

The existing QgsCRSCache class has been removed. This class was used to cache the expensive results of initializing a QgsCoordinateReferenceSystem object, so that creating the same CRS could be done instantly and avoid slow databases lookups. In QGIS 3.0 this caching is now handled transparently, so there is no longer a need for the separate QgsCRSCache and it has been removed. If you were using QgsCRSCache in your PyQGIS code, it will need to be removed and replaced with the standard QgsCoordinateReferenceSystem constructors.

This change has the benefit that many existing plugins which were not explicitly using QgsCRSCache will now gain the benefits of the faster caching mechanism – potentially this could dramatically speed up existing plugin algorithms.

In summary

The QGIS developers have been busy fixing, improving and cleaning up the PyQGIS API. We recognise that these changes result in significant work for plugin and script developers, so we’re committed to providing quality documentation for how to adapt your code for these changes, and we will also investigate the use of automated tools to help ease your code transition to QGIS 3.0. We aren’t making changes lightly, but instead are carefully refining the API to make it more predictable, streamlined and stable.

If you’d like assistance with (or to outsource) the transition of your existing QGIS scripts and plugins to QGIS 3.0, just contact us at North Road to discuss. Every day we’re directly involved in the changes moving to QGIS 3.0, so we’re ideally placed to make this transition painless for you!

QGIS 3 is underway – what does it mean for your plugins and scripts?

With the imminent release of QGIS 2.16, the development attention has now shifted to the next scheduled release – QGIS 3.0! If you haven’t been following the discussion surrounding this I’m going to try and summarise what exactly 3.0 means and how it will impact any scripts or plugins you’ve developed for QGIS.

qgis_icon.svgQGIS 3.0 is the first major QGIS release since 2.0 was released way back in September 2013. Since that release so much has changed in QGIS… a quick glance over the release notes for 2.14 shows that even for this single point release there’s been hundreds of changes. Despite this, for all 2.x releases the PyQGIS API has remained stable, and a plugin or script which was developed for use in QGIS 2.0 will still work in QGIS 2.16.

Version 3.0 will introduce the first PyQGIS API break since 2013. An API break like this is required to move QGIS to newer libraries such as Qt 5 and Python 3, and allows the development team the flexibility to tackle long-standing issues and limitations which cannot be fixed using the 2.x API. Unfortunately, the side effect of this API break is that the scripts and plugins which you use in QGIS 2.x will no longer work when QGIS 3.0 is released!

Numerous API breaking changes have already started to flow into QGIS, and 2.16 isn’t even yet publicly available. The best way to track these changes is to keep an eye on the “API changes” documentation.  This document describes all the changes which are flowing in which affect PyQGIS code, and describe how best they should be addressed by plugin and script maintainers. Some changes are quite trivial and easy to update code for, others are more extreme (such as changes surrounding moving to PyQt5 and Python 3) and may require significant time to adapt for.

I’d encourage all plugin and script developers to keep watching the API break documentation, and subscribe to the developers list for additional information about required changes as they are introduced.

If you’re looking for assistance or to outsource adaptation of your plugins and scripts to QGIS 3.0 – the team at North Road are ideally placed to assist! Our team includes some of the most experienced QGIS developers who are directly involved with the development of QGIS 3.0, so you can be confident knowing that your code is in good hands. Just contact us to discuss your QGIS development requirements.

You can read more about QGIS 3.0 API changes in The road to QGIS 3.0 – part 1.

Back to Top

Sustaining Members