No último artigo, tentei mostrar como usei o QGIS 2.6 para criar séries de mapas cuja orientação da folha se adaptasse à forma do elemento do atlas. Esse método é útil quando a escala final dos mapas não é relevante, ou quando os elementos usados no atlas têm uma dimensão muito semelhante, permitindo a adopção de uma escala única. No entanto, quando é necessário manter a mesma escala de impressão dos mapas e os elementos do atlas apresentam diferenças de extensão, é necessário alterar o tamanho da folha. Nesta segunda parte do artigo, tentarei mostrar como cheguei a uma solução para isso.
In my last post, I have tried to show how I used QGIS 2.6 to create a map series where the page’s orientation adapted to the shape of the atlas features. This method is useful when the final scale of the maps is irrelevant, or when the size of the atlas elements is similar, allowing one to use a fixed scale. On the other hand, when using a fixed scale is mandatory and the features size are too different, it is needed to change the size of the paper. In this second part ot the post, I will try to show how I came to a solution for that.
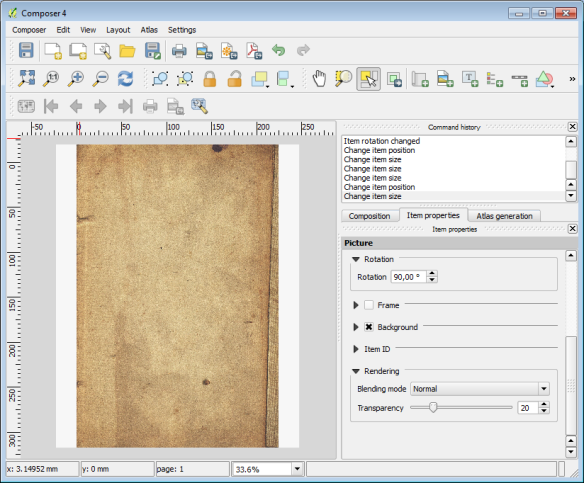
Como base usei o mapa criado na 1ª parte do artigo, do qual fiz um duplicado. Para exemplificar o método procurei criar uma série de mapas à escala 1:2.000.000. Uma vez que iria adaptar tanto a altura como a largura da folha aos elementos do atlas, não me precisava de preocupar com a orientação da folha em si e por isso comecei por desactivar as propriedades definidas por dados na opção orientação.
As a base, I used the map created in the previous post, from which I did a duplicate. To exemplify the method I tried to create a map series at 1:2.000.000 scale. Since I was going to change both width and height of the paper, I did not need to set an orientation, and therefore I deactivated the data defined properties of the orientation option:
Fiz algumas contas usando a escala, as dimensões do elemento do atlas e as margens definidas anteriormente e e cheguei às seguintes expressões a usar na largura e altura da folha, respectivamente:
With some maths with the map scale, the size of the atlas feature and the already defined margins, I came up with the following expressions to use, respectively, in width and height:
((bounds_width( $atlasgeometry ) / 2000000.0) * 1000.0) * 1.1 + 10
((bounds_height( $atlasgeometry ) / 2000000.0) * 1000.0) * 1.1 + 30
Passo a explicar. (bounds_width( $atlasgeometry ) / 2000000.0) é a largura do elemento do atlas representado à escala 1:2.000.000 em unidades do projecto (neste caso metros). Este resultado é multiplicado por 1000 para o converter em milímetros (unidade usada nas definições do compositor). Para que o elemento de atlas não ficasse resvés aos limites do mapa decidi dar 10% de margem em torno do mesmo, o que justifica a multiplicação por 1.1. E por fim adicionei a dimensão das margens do mapa que tinham sido definidas na 1ª parte do artigo (i.e., 20 mm, 5 mm, 10 mm, 5 mm).
Allow me to clarify. (bounds_width( $atlasgeometry ) / 2000000.0) is the atlas feature’s width in meters when represented at 1:2.000.000. This is multiplied by 1000 to convert it to millimeters (the composer’s settings units). In order to keep the atlas feature not to close to the margin, I have decided to add 10% of margin around it, hence the multiplication by 1.1. To finish I add the map margins value,that where already set in the previous post (i.e.,20 mm, 5 mm, 10 mm, 5 mm)
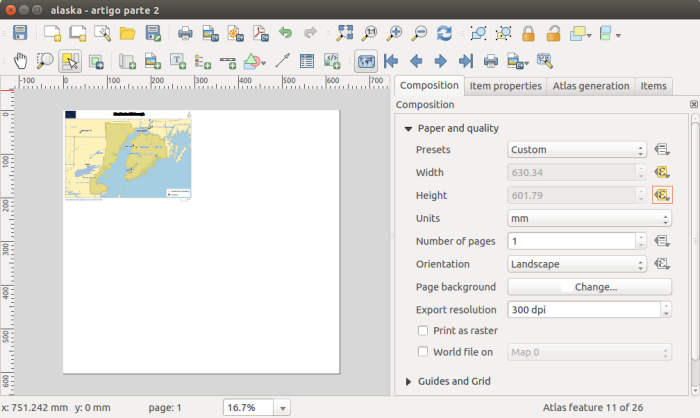
Como se pode ver pela imagem anterior, após a introdução das expressões nas opções de largura e altura da folha, a sua dimensão já se alterava em função do tamanho do elemento de atlas. No entanto, como seria de esperar, os itens do mapa mantiveram-se teimosamente na mesma posição. Foi por isso necessário alterar as expressões definidas para a dimensão e posição de cada um deles.
As one can see from the previous image, after setting the expressions in the paper width and height options, it’s size already changed according to the size of the atlas features. But, as expected, all the itens stubbornly kept their positions.For that reason, it has been necessary to change the size and position expressions for each of then.
Começado pelo tamanho do item de mapa, as expressões a usar na altura e largura não foram difíceis de perceber uma vez que seriam as dimensões da folha menos as margens:
Starting by the map item size, the expressions to use in width and height were not difficult to understand since they would be the paper size without the margins size:
((bounds_width( $atlasgeometry ) / 2000000.0) * 1000.0) * 1.1
((bounds_height( $atlasgeometry ) / 2000000.0) * 1000.0) * 1.1

Para posicionar correctamente os elementos, bastou substituir nas expressões das opções X e Y os “CASE WHEN … THEN … END” que determinavam o tamanho da largura ou altura da folha, pelas expressões descritas anteriormente. Por exemplo, as expressões usadas para a posição da legenda em X e Y:
To position the items correctly, all was needed was to replace the “CASE WHEN … THEN … END” statement by the expressions defined before. For instance, the expressions used in the X and Y options for the legend position:
(CASE WHEN bounds_width( $atlasgeometry ) >= bounds_height( $atlasgeometry) THEN 297 ELSE 210 END) - 7
(CASE WHEN bounds_width( $atlasgeometry ) >= bounds_height( $atlasgeometry) THEN 210 ELSE 297 END) - 12
Passaram a ser, respectivamente:
Became, respectively:
(((bounds_width( $atlasgeometry ) / 2000000.0) * 1000.0) * 1.1 + 10) - 7
(((bounds_height( $atlasgeometry ) / 2000000.0) * 1000.0) * 1.1 + 30) - 12

Alterando as expressões de posicionamento X e Y dos restantes itens do compositor cheguei à estrutura final.
Changing the expressions of the X and Y position options for the remaining composer’s items I have reached the final layout.
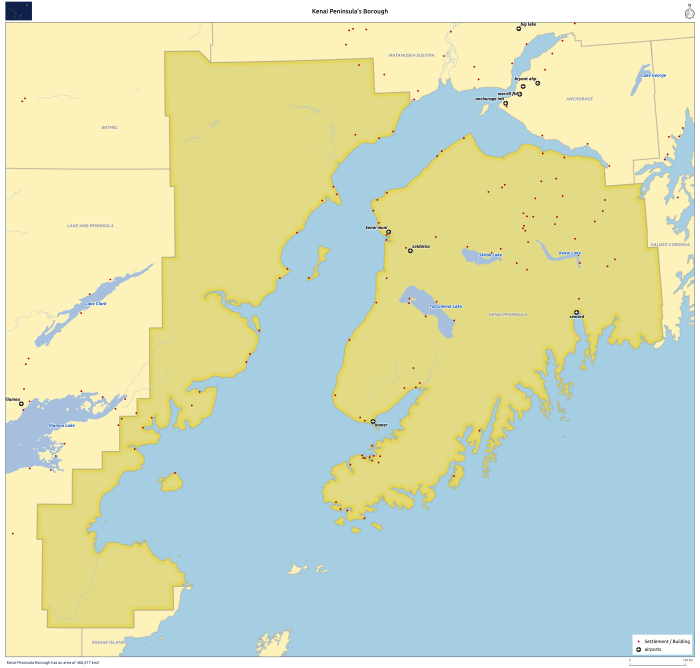
Depois disso, a impressão/exportação de todos os (25) mapas ficou, mais uma vez, à distância de um só clique.
Once again, printing/exporting all (25) maps was only one click away.

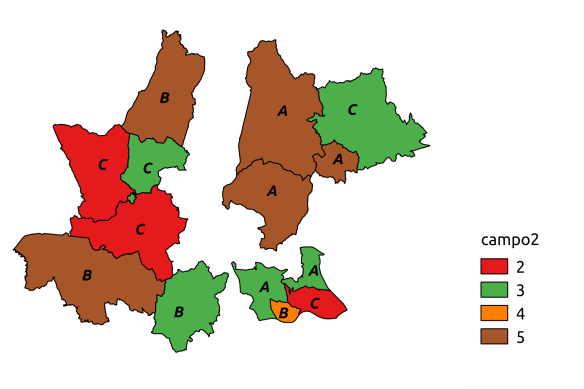
Uma vez que o QGIS permite exportar imagens do compositor georreferenciadas, adicionando-as ao QGIS obtive este resultado interessante.
Since QGIS allows exporting the composer as georeferenced images, opening all maps in QGIS I got this interesting result.

Como se pode ver pelos resultados, através deste método, podemos obter mapas com formatos bastante estranhos. Por essa razão, na 3ª e última parte deste artigo, procurarei mostrar como criar uma série de mapas com escala fixa, mas usando formatos de folhas standard (A4, A3, A2, A1 e A0).
As one can see by the results, using this method, we can get some quite strange formats. That is why in the 3rd and last post of this article, I will try to show how to create a fixed scale map series using standard paper formats (A4, A3, A2, A1 e A0).
Disclaimer: I’m not an English native speaker, therefor I apologize for any errors, and I will thanks any advice on how to improve the text.


 The last symbol layer is just a tin line of a green even darker than the other two.