A few months ago I changed my laptop for a Dell M3800 with an amazing 3840×2160 15,6″ display, that means a crazy 282 dpi resolution. I won’t discuss the problems I had to face and resolve to make this thing usable with Kubuntu 14.04 because they are yet some useful resource on the net: https://wiki.archlinux.org/index.php/HiDPI. The executive summary is that KDE and QT/GTK applications work pretty well and without serious usability problems: Firefox, Chrome, Thunderbird have no problems at all if we exclude some really minor glitches like pixelated or too big icons in a few occasions (see the example below).
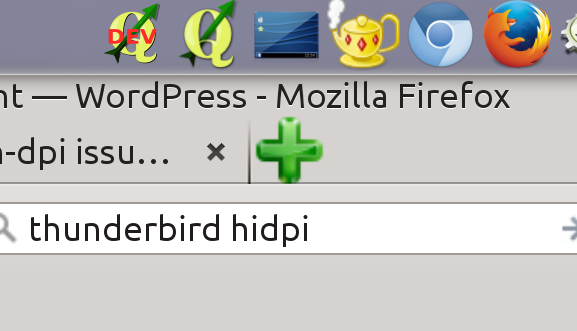
Small problem with a big icon in Firefox @ 282 dpi
QGIS on HiDPI
Unfortunately, QGIS has some serious usability problems on such an high resolution screen and I spent a few hours try to understand how is it possible to fix them and what should be done to avoid them in the first place.
The reason behind is that HiDPI screens usage is increasing and we can expect they’ll gain more and more market share expecially among professional users and GIS users are mostly professional users!
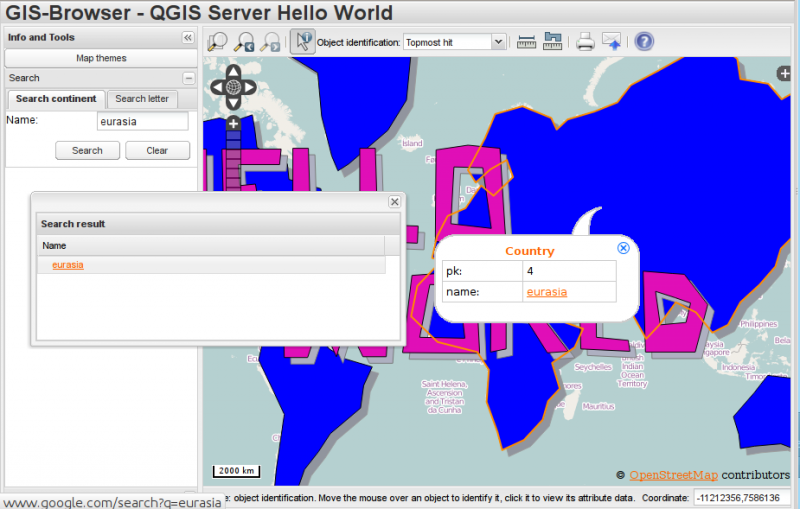
To give you a quick taste of the kind of problems that have to be addressed, take a look at the pictures below.

QGIS statusbar: unreadable on HiDPI
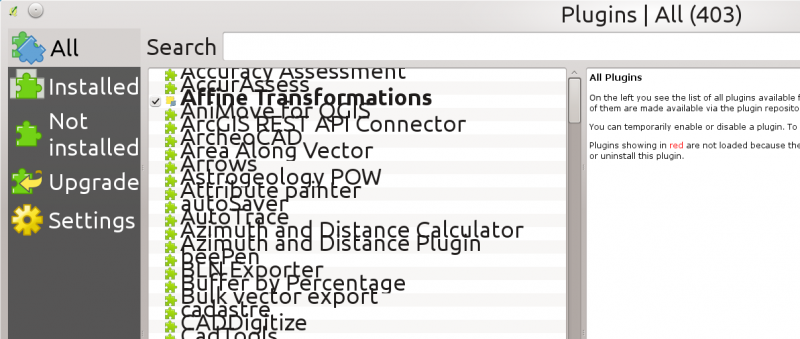
Plugin manager rows are too low and left tab column has a 200 px max width
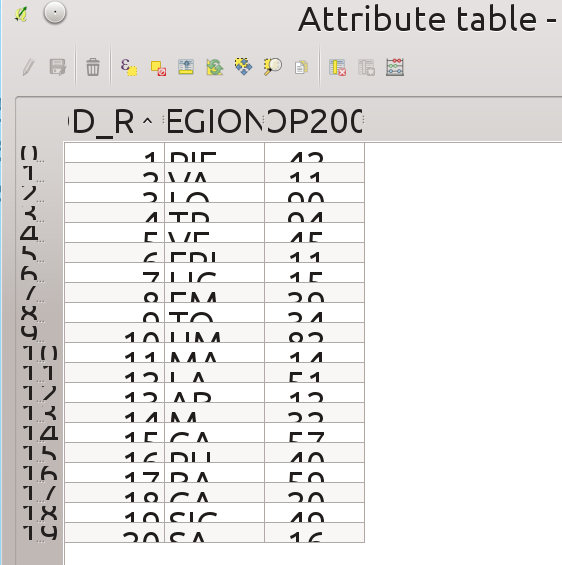
Attribute table rows are too low and icons are too small
I tried to fix some of the issues shown above and this is the resulting commit: https://github.com/qgis/QGIS/pull/2014/commits, QGIS run on different platforms and I wasn’t able to test it on all of them, I hope the fixes will not cause problems on platforms and screen sizes other than I could test myself.
But the purpose of this notes it to list some humble tips that could be useful to avoid or fix these kind of problem.
Tip #1: Avoid hardcoded pixel values!
Web developers started the fight with HiDPI screens a few years ago, (buzz)words like responsive design and the move towards mobile platforms forced the developers to consider what a pixel really is in a web context, and the obvious conclusion was that a pixel is not a pixel! Please see the following resources if you’re curious and not familiar with these concepts:
The most obvious and efficient solution for the web browser was to change the concept of pixel from a physical to a logical unit.
Unfortunately, at least in QT the pixel is still a physical pixel, this means the we must avoid to specify the size of GUI elements in pixel units.
Qt documentation has a page about Developing Scalable UIs.
This blog page also has some useful tips: HighDPI in KDE Applications.
A collection of useful tips for QT developers can be found in the HiDPI KDE wiki page:
- Do not use QFont setPixelSize but use setPointSize, and better, avoid setting a custom size at all.
- Try to stick with the possibilities from KGlobalSettings (KGlobalSettings::generalFont(), KGlobalSettings::largeFont() etc.)
- Do not use a fixed QSize with images (QPixmap, QIcon…)
- Do not use KIconLoader::StdSizes. Even though it would sound like a good idea to use it, it suffers from the same issue: Hardcoded pixel sizes.
- To get a user’s configured icon size, include and use the IconSize function (note: this is not a member function): IconSize(KIconLoader::Small). However, be aware that the user might be able to mess up your apps look by setting some insane values here.
- If you use svg images for icons (for example in plasma) get the standard sizes from some theme elements (e.g. buttons, fonts) and scale your images accordingly. (Don’t do this when using pixel based images)
Some of the tips above are clearly related to KDE, but I’ve found them still useful to get the overall picture.
Coming to QGIS specific problems, there are still many that have to be resolved, but the overall application is somewhat already useable. The issues I have addressed were easy picks and most of the times it was enough to remove the hardcoded values and rely to QT default sizing mechanisms to get a good result, such as in this case (from src/app/qgisapp.cpp):
//mCoordsLabel->setMaximumHeight( 20 );
Things were harder with plugin manager, the MVC delegate that draws the plugins rows contained a lot of hardcoded metrics for icon and text placement, the solution was to change the values to be relative to the configured font height, see all details in my PR to solve plugin manager HiDPI issues
This is generally a good idea: we must not make any assumption about the size of the fonts the user will be using.
Tip #2: force resize of dialogs
This is something that you should be aware of if you are using an HiDPI screen to build your GUI.
I first encountered this problem when developing my IPyConsole QGIS python plugin: I designed the GUI with designer-qt4 on my HiDPI screen and forget about testing it on “normal” screens, the result is that the window size of the settings dialog (a relatively small dialog) was set by designer at a crazy value of 1115×710. It was impossible from QT Designer to set a small size by dragging the window corner with the mouse: the application automatically reset the dialog size to the calculated minimum size (which on an HiDPI screen was that huge 1115×710).
The solution in that case was to manually alter the Ui_SettingsDialog.ui file to set a small size (say 300×200) and call adjustSize()
self.settingsDlg.show()
# This will adjust the size according to font/dpi:
self.settingsDlg.adjustSize()
result = self.settingsDlg.exec_()
Tip #3: Icons
I haven’t yet come to a solution for the right size for icons (suggestions welcome!). Of course the first point is to move all icons to SVG, the process has already started but many icons have still to be converted.
But having scalable icons is not enough: we must make sure that the icon size is not hardcoded in the GUI, there are some settings for icon size in QGIS options dialog and that might be the right point to start but we probably need more than one size:
- size of toolbar icons
- size of plugin icons
- size for smaller toolbars (attribute table, python console vertical sidebar to cite a few)
Maybe a 3-sizes approach would be fine (big, medium, small), for an easy configuration, some pre-defined values for HiDPI / 96dpi and HD screens would be useful.
To get an idea of what the attribute table looks like right now on an HiDPI screen, look at the picture below, scaled to 96dpi:
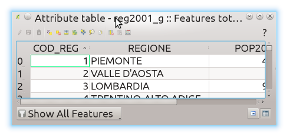
Icons are too small on an HiDPI screen
Conclusions
There is still much work to do in order to have an usable interface on HiDPI screens, some issues can be easily solved by avoiding hardcoded sizes and leaving to QT the heavy job of calculating GUI widget sizes.
It’s important that developers (not only core developers but plugin developers too) are aware of this kind of issues and how to avoid them in the first place.
HiDPI screens are just around the corner and it’s better to be prepared.
A final note about QT5, it’s not clear to me if and when the move to QT5 will be done and moreover if that move will automatically solve HiDPI issues due to a better HiDPI support, but I’m afraid it won’t.


