Related Plugins and Tags

QGIS Planet

QGIS Mobile GSoC has started

Yesterday, we had our first meeting with Marco Bernasocchi, who just started his Google Summer of Code project. The project goals are: porting QGIS to the Android platform adapt the QGIS GUI for tablet computers write a driver for the built-in GPS create a QGIS “mini” application for mobile phones Marco Hugentobler is mentoring the project and updated information will be available on a QGIS Wiki page. We wish Marco good luck and are looking forward to a portable QGIS this year!

QGIS Enterprise - Open Source GIS mit LTS Support

Das benutzerfreundliche und funktionsreiche Quantum GIS (QGIS) bewährt sich seit mehreren Jahren im professionellen Einsatz. Die Firma Sourcepole aus Zürich füllt jetzt eine letzte Lücke, die Organisationen davon abgehalten hat QGIS in Unternehmens-Infrastrukturen einzusetzen – der professionelle Support direkt von den Kernentwicklern. Mit dem QGIS Enterprise Long Term Support- und Wartungsvertrag erhält der Kunde die Sicherheit, eine professionell unterstützte und betriebsbereite GIS Infrastruktur auf der Basis von QGIS zu betreiben.

FOSSGIS 2017 in Passau

In zwei Wochen beginnt die alljährliche deutschsprachige FOSSGIS Konferenz zum Theme Open Source GIS und OpenStreetMap in Passau.

QGIS - the FOSSGIS week

Tuesday, 2012-03-20 11:00: FOSSGIS in Dessau, Germany starts with a workshop for programming QGIS plugins A great conference begins, with about 400 people attending presentations and workshops over three days. Tuesday, 2012-03-20 14:42: Changeset c27c89045c: “Add WFS support for QGIS server. Provided by René-Luc D’Hont” Wow. Tuesday, 2012-03-20 14.48: QGIS 1.7.4 uploaded to DebianGIS Ok, QGIS 1.7.4 is already a few weeks old. But current version on Debian is 1.

QGIS Anwendertag, 6.5., HSR Rapperswil

Am Freitag dem 6. Mai, findet an der Hochschule für Technik Rapperswil das 2. deutschsprachige QGIS Anwendertreffen statt. Quantum GIS (oder kurz QGIS) ist ein benutzerfreundliches Open Source Desktop- und Server-GIS welches sich einer stark wachsenden Anwendergruppe erfreut. Sie finden Infos zu QGIS unter www.qgis.org Nach dem erfolgreichen ersten deutschsprachigen QGIS Anwendertreffen am 21.4.2010 in Bern findet das zweite deutschsprachige QGIS-Anwendertreffen an der HSR in Rapperswil statt. Alle aktuellen Infos zur Veranstaltung, wie auch zur Anmeldung, finden Sie auf der QGIS Seite.

QGIS Instant Print Plugin

As a side product of a customer project, we’re publishing a QGIS plugin for printing maps to a file with just two mouse clicks.

OpenLayers plugin visits code sprint

A short visit and 7 hours train ride to the OpenLayers code sprint mainly for a presentation at the Swiss MapFish user group meeting in Lausanne, resulted in a new release of the QGIS OpenLayers plugin. The OpenLayers plugin adds WebKit based layers to QGIS and ships with OpenStreetMap-, Google- and Yahoo-Layers. Changes in this release: Update to OpenLayers trunk Google Layers using API V3 (no API key necessary) Code refactoring for adding new layer types with one line of code (and some HTML…) The next planned step is integrating this plugin with the very nice Openlayers Overview plugin from Luiz Motta.

NTv2 transformations with QGIS

Datum transformations with grid shift files are used in several countries to convert coordinates between different datums. In Switzerland, datum transformation using the NTv2 method is important because of the upcoming conversion between the LV03 system and the new LV95 system. Up to now, doing coordinate transformations with grid shift files was possible in QGIS, but unconvenient. To use an NTv2 transformation in QGIS, the grid shift file needs to be placed in a directory where proj4 can find it (usually /usr/share/proj on Linux and OSGeo4W\share\proj on Windows).

Verarbeitung von Interlis-Daten mit QGIS

In der Schweiz werden amtliche Geodatenmodelle vorwiegend mit Interlis erstellt und häufig wird das Interlis-Transferformat für den offiziellen Datenaustausch vorgegeben. Das Interlis-Plugin für QGIS ermöglicht die einfache Verarbeitung von Interlis-Daten und bindet externe Java-Applikationen in die Processing-Toolbox ein.

FOSS4G 2018 Dar es Salaam

This year’s FOSS4G edition took place in Dar es Salaam, Tanzania. As every year, Sourcepole was supporting this major event as a sponsor. We would like to thank for all the interesting discussions and feedback to our presentations!

image

QGIS Web Client 2 Update

Styling and publication of vector tiles

Using GeoPackage as work and exchange format

Thanks to the LOC for organizing another great FOSS4G!

Pirmin Kalberer (@implgeo)

Slides FOSS4G 2017

Reporting back from FOSS4G 2017 in Boston, which started with the usual QGIS plugin programming workshop, this time at the Harvard University campus.

image

QGIS Web Client 2

t-rex, a vector tile server for your own data

Sharing and Migrating GIS Projects with OGC GeoPackage

Thanks to the LOC for organizing another great FOSS4G!

Pirmin Kalberer (@implgeo)

FOSSGIS 2017 in Passau

In zwei Wochen beginnt die alljährliche deutschsprachige FOSSGIS Konferenz zum Theme Open Source GIS und OpenStreetMap in Passau. Vom 22.-25. März 2017 wird die FOSSGIS-Konferenz mit Untersützung der Universität Passau in der Dreiflüssestadt Passau stattfinden. Die FOSSGIS-Konferenz ist die im D-A-CH-Raum führende Konferenz für Freie und Open Source Software für Geoinformationssysteme sowie für die Themen OpenStreetMap und Open Data. An vier Tagen werden in Vorträgen für Einsteiger und Experten, Hands-On Workshops und Anwendertreffen Einblicke in neuste Entwicklungen und Anwendungsmöglichkeiten von Softwareprojekten gegeben.

Photo: Tobias Hobmeier (CC-BY-SA)

Sourcepole ist wieder mit einem Stand vertreten und lädt zu interessanten Workshops und Vorträgen ein:

  • Mittwoch 17:00 - Workshop Entwicklung von QGIS Plugins
  • Donnerstag 14:30 (HS 9) - QGIS Server Projektstatus
  • Donnerstag 14:30 (HS 11) - Von WMS zu WMTS zu Vektor-Tiles
  • Donnerstag 15:00 (HS 9) - QGIS Web Client 2

Das gesamte Programm ist auch als praktische Android App erhältlich und die Online-Anmeldung ist noch bis am 19.3. offen.

Wir freuen uns auf eine interessante Konferenz!

AutoForm Plugin for QGIS

The AutoForm plugin for QGIS automatically sets the edit widget type for the fields of a selected layer based on their data types and foreign keys. This is in order to save the user time they may need to spend on manually editing these widgets. In order for this to work correctly, the layer information must be stored in a PostgreSQL database. Furthermore, foreign keys must have a constraint rule for this to work. The plugin does NOT allow you to set relations. It merely checks for any and takes advantage of them accordingly.

Motivation

When you have a database with a lot of tables, there should be a way for quickly entering data whithout having to configure the input form for each table first. In Switzerland this a common use case when you import Interlis data with ili2pg based on an official data model. ili2pg automatically adds reference constraints based on the Interlis model, which is a prerequisite to detect relations in a generic way.

There is already a plugin with a very similar goal: DataDrivenInputMask written by Bernhard Ströbl. Maybe it was bad luck, but we had always troubles when using it. Once we eventually found out the PostgreSQL driver for the QtSql library was missing and another time we failed to use the plugin because we had a socket based connection to PostgreSQL. In both cases we were stuck in the login dialog without a hint why the connection had failed. Another problem is in some cases that the DataDrivenInputMask plugin writes additional metadata into the original database.

So we decided to make our own proof of concept, hopefully avoiding these problems and having the Swiss “ili2pg” use case in mind. A major conceptual difference is, that AutoForm uses the built-in input form functionality of QGIS instead of creating custom dialogs like DataDrivenInputMask does.

Running the plugin

After you have installed the AutoForm plugin (flagged “experimental”) via the QGIS Plugin repository you should see a new option in the Plugins menu called AutoForm. Clicking on it will give you the option Generate Form. Running this with the layer selected will generate your form. If everything is correctly configured, this next step should be easy.

  • Select a PostGIS layer from the Layers Panel
  • Click on Generate Form

And thats it! Now if you toggle editing you should see the changes which were made. In my case, this was the result:

form_before_run

form_after_run

If your layer had a foreign key reference to one or multiple other tables, then they too were added automatically to the Layers Panel and their values should be selectable in their according fields.

Behind the Scenes

In order to perhaps help a bit with understanding how this Plugin works, I am adding this section for anyone who is curious. The Plugin follows this process:

  • Check if a layer is selected
  • If a layer is selected search for any key relationships to other tables
  • If a foreign key relationship to another table was found the load that table into the project and set the corresponding fields to a Value Relation WidgetType
  • Proceed normally and set the remaining Widgets where applicable

The script checks first if the field has already been changed, so as to prevent user made edits or the previously set Value Relations from being overwritten. Then it takes a look at the typeName() of the field in order to determine which widgettype to assign. For example if the field has the Date Type, it would use the calender widget. It does this for each field in the layer. Should the user wish to make additional changes (or correct any mistakes which might have been made), they can do so in the ‘Fields’ tab of the layer properties.

Outlook

This plugin is in an early stage and serves as a proof of concept. There is much left to be done, especially in supporting embedded forms for related tables. We also don’t analyze additional metadata written by ili2pg, which would allow to recognize whether related tables are only lookup tables without the need to embed them as entry forms.

The source code is available on Github. If you are interested in collaborating or maybe sponsoring improvements to this plugin, please contact us!

Mobile data collection with GeoPaparazzi and QGIS

Geopaparazzi 5.1.2 is a mobile app for Android which allows the user to quickly collect information on his or her surrounding area. This is done with the help of geometries, pictures and notes. Additionally to the notes which are available by default, a person skilled with .json forms may write their own forms for collecting data. In this blog I will cover:

  • How do I create custom notes?
  • How do I export my projects to QGIS?

This process is remarkably simple!

Create a new form type for Geopaparazzi:

As the first step we need to create our new Geopaparazzi form.

  • Create a new .json file
  • Build your form referring to this guide here
  • Each form consists of following sections:
  • A section
  • Various forms belonging to the section
  • Save your new form file when you are done.

You may wish to test your .json file with a JSONLint validator before proceeding.

Adding your form to the app.

Now that you have your form dialog written, we now need to add it to the Geopaparazzi app in order to use it.

  • Hook up your Android device to your computer
  • Navigate to your geopaparazzi folder (usually saved in your internal storage)
  • Find the tags.json file

tags_json_file

The tags.json file contains all of the forms which the app can use. Simply copy your code into the bottom of the tags.json file. Don’t forget to seperate the previous form section (in my case it was examples) from the new one with a ‘,’.

Now your Geopaparazzi app should feature your new custom form. You might have to restart the app for it to display.

added_custom_note

Moving your project to QGIS.

Once you have collected all the information you want, it is time to export your data to QGIS for further examination and use.

export_kmz_file

  • Export your project as a KMZ file
  • Hook up your Android device to your computer
  • Start a new QGIS Project
  • Select Layer/Add Layer/Add Vector Layer
  • When promted for a datasource select your freshly exported KMZ file (You may have to make sure that your browser is searching for all filetypes)
  • Make sure your projection matches EPSG:4326

import_kmz_file

Once this is done you should have a vector layer which displays all of the notes and bookmarks you made on the project. From here you can further style them (e.g. adding labels to your points).

import_completed_with_label

Geopaparazzi filetypes

Following filetypes are used by the Geopaparazzi app:

  • .gpap
  • .mbtiles
  • .sqlite

The Geopaparazzi project file (.gpap), is the main project file and contains all the important information which is recorded during your work. This is the file which is handled in the Export dialog and can be exported by Geopaparazzi into following formats:

  • .KMZ
  • .GPX
  • a STAGE compatible format
  • export all pictures taken as .png
  • export all bookmarks for another .gpap file

An important addendum would be that the .KMZ files which are generated during the export appear to actually be .KML files, as they are not compressed into binary.

The .mbtiles files are found in the geopaparazzi/defaulttiles directory and are seen as the background map in the Mapview.

The .sqlite files can be generated via the Import/Default Database menu. They contain three columns: polygon, points and lines. These columns then save the information of the geometry which the user creates in the Mapview.

For more information on the datasets from Geopaparazzi or how one goes about creating a GeoPaparazzi friendly spatialite database please refer to this documentation

Verarbeitung von Interlis-Daten mit QGIS

In der Schweiz werden amtliche Geodatenmodelle vorwiegend mit Interlis erstellt und häufig wird das Interlis-Transferformat für den offiziellen Datenaustausch vorgegeben. Das Interlis-Plugin für QGIS ermöglicht die einfache Verarbeitung von Interlis-Daten und bindet externe Java-Applikationen in die Processing-Toolbox ein. Interlis ist primär ein Austauschformat und müss für die Verarbeitung in einem GIS konvertiert werden. Die Unterstützung von Interlis in der Open Source Bibliothek GDAL/OGR wurde ursprünglich von den Kantonen Thurgau und Solothurn finanziert und später vom KOGIS und der QGIS Usergruppe Schweiz finanziell gefördert. Der Interlis-Treiber war die treibende Kraft zur Unterstützung von mehreren Geometrien in einem Layer und zur Aufnahme von Kreisbögen in das Geometriemodell in Version 2.0 von GDAL/OGR.

Das Interlis-Plugin für QGIS nutzt die Funktionen von GDAL/OGR zur einfachen Verarbeitung von Interlis-Daten. Mit der Version 0.9 im März 2016 wurde die Einrschränkung auf eine Geometrie pro Layer für OGR-Datenquellen behoben, sowie die Ansicht von Interlis-Daten markant vereinfacht. Erreicht wird das durch die Auslagerung von Funktionen als Processing-Algorithmen, welche auf Java-Bibliotheken beruhen. Zur vereinfachten Installation und Konfigurationen werden die benötigten JAR-Dateien mit dem Plugin mitgeliefert.

Mit der im März veröffenlichten Version 2.14 von QGIS wurde in der OSGeo4W-Distribution der Umstieg auf OGR 2.0 vollzogen. Damit kann das im QGIS-Repository verfügbare Interlis-Plugin ohne weiteres verwendet werden. Noch einfacher geht es mit der “QGIS Portable Swiss Edition”, die ohne Installation direkt verwendet werden kann und damit keine Administratoren-Rechte benötigt. Das Interlis-Plugin ist darin bereits enthalten und QGIS ist für den Einsatz in der Schweiz mit den entsprechenden Referenzsystemen vorkonfigiert. Auch die NTv2-basierte Umrechnung von LV03 und LV95 ist bereits enthalten. Das ZIP-File kann hier heruntergeladen werden und an beliebiger Stelle (auch auf einem USB-Stick) entpackt werden. Mit dem Aufruf von “qgis.bat” wird das vorkonfigurierte QGIS gestartet ist sofort einsatzbereit.

Transferdaten im Interlis 1 (itf) oder im Interlis 2 (xtf) Format können über den Plugin-Dialog direkt in einen Layer importiert werden. Das dient in erster Linie der einfachen Visualisierung von Interlis-Daten, über die Speicherfunktionen der QGIS-Layer kann die temporäre Ansicht jedoch auch in eines der untestützen OGR-Formate wie Shapefiles konvertiert werden.

image image image

Das Interlis-Modell wird über einen Webdienst in den offiziellen Repositories gesucht und im IlisMeta XML-Format zurückgeliefert. Dieses Modell-Format kann von OGR direkt gelesen werden. Falls das Modell nicht gefunden wird, kann es mit dem Processing-Tool “Ili Model -> IlisMeta” erzeugt werden.

image

Zur Ausführung wird ein Java-Interpreter benötigt. Falls dieser nicht automatisch gefunden wird, muss der Pfad unter Verarbeitung->Optionen entpsprechend konfiguriert werden.

image

Ein solches IlisMeta-Modell kann im Import-Dialog unter “Lokales Modell” ausgewählt werden. Damit können z.B. kantonale AV-Daten importiert werden:

image image image

Für Anwender, welche die Grundlagen zur Verarbeitung von Interlis an einem Workshop erlernen wollen, veranstaltet Sourcepole am 13.4.16 einen eintägigen Kurs in Zürich. Darin werden zuerst Interlis-Grundlagen und die Abbildungsmöglichkeiten auf releationale Datenbanken vermittelt. Ausgehend von QGIS wird auch auf weitere Open Source Tools wie ili2pg und ili2gpkg eingegangen. Anmeldung und weitere Informationen: sourcepole.ch/kurse/

Publish Image Tooltips with QGIS Cloud

A lot of people are using QGIS Cloud as a service with ready to use QGIS webclient. It’s very easy to publish data and share maps in this way. Publishing of georeferenced images can be done with QGIS Cloud in a few steps as well. But the main problems are:

  • how to upload the images into the cloud database?
  • how to manage them?
  • how to display the results?

QGIS and QGIS Cloud are offering all tools for this task.

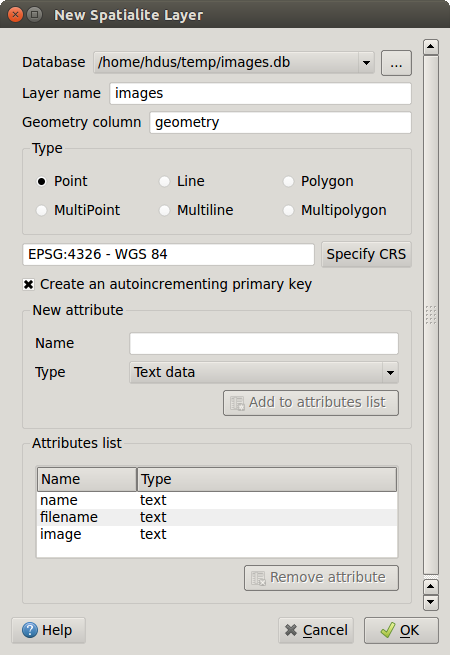
Create a new spatialite layer with QGIS:

As the first step we need to create a point layer with some mandatory columns.

  • Open the New Spatialite Layer dialog with Layer -> Create Layer -> New Spatialite Layer
  • Create in minimum three columns :
    • name text
    • filename text
    • image text
  • name the new layer images

Create_Spatial_lite_Layer

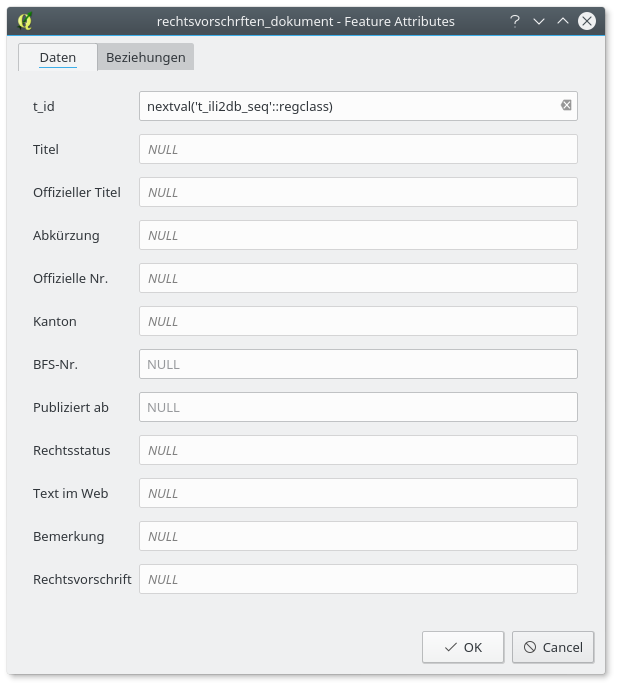
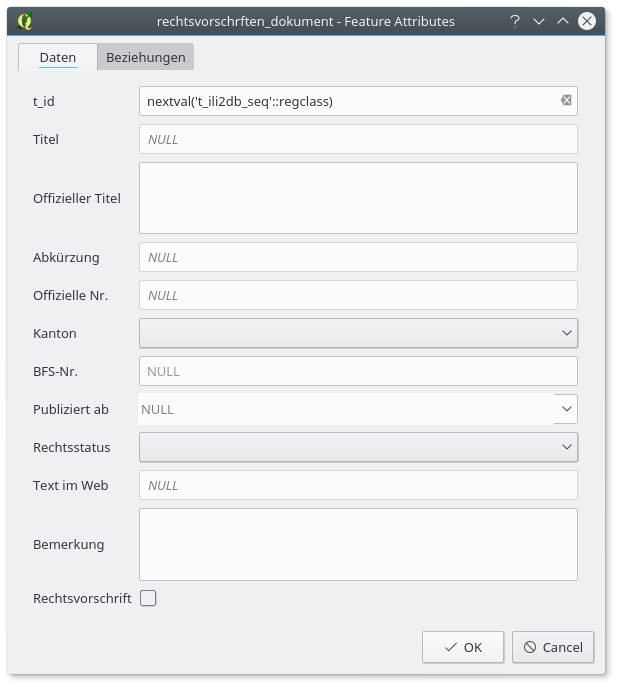
Create a new dialog with QtDesigner which looks like in the image below.

For adding and managing the images a customized input GUI is needed.

  • add two QLineEdit Widgets and name them with the corret objectName
  • add two QTextEdit Widgets and name them with the corret objectName
  • add a QToolButton Widget with the corret objectName

  • or download the file attribute.ui

QtDesigner

  • Open the layer properties of layer images and open the section fields.
  • Select from “Attribute editor layout”: Provide ui-file
  • To get the custom UI select the path to attribute.ui in “Edit UI” and open the gui.
  • Click OK

Create a Python init function for handling the image data.

When you add a new feature to the layer images, the dialog opens but the tool button is not working. To get it working we need some Python code.

The idea behind that is to run some functionality to convert the binary image to text based base64 encoding. Let’s Python doing that job for us. QGIS offers the ability to define an init function when a custom dialog is opened. This offers a wide range of options.

  • create a new text file and call it encodeimage.py
  • add the following Python code (or download the Python script encodeimage.py):

Import all nesseccary Modules and Classes from PyQt4 and QGIS

from PyQt4.QtCore import *
from PyQt4.QtGui import *
from qgis.core import QgsFeature,  QgsMapLayerRegistry
import base64

Define some global variables

filePathField = None
imageField = None
imagePreview = None
toolButton = None
fileName = None

This is the main function which will be connected with the QGIS layer dialog

def formOpen( dialog, layer, featureid ):

    global filePathField
    global imageField
    global imagePreview
    global toolButton
    
    filePathField = dialog.findChild(QLineEdit, "filename")
    imageField = dialog.findChild( QTextEdit, "image" )
    imagePreview = dialog.findChild( QTextEdit, "imagePreview" )

Find the QToolButton Object to connect the conversion function.

    toolButton = dialog.findChild( QToolButton, "toolButton" )

When the ToolButton is clicked run the method getFileName()

    toolButton.clicked.connect(getFileName)

set the imageField Widget invisible for a nicer GUI. It is not nesseccary to see the data

    imageField.setVisible(False)
    imagePreview.setText('<img width="300" src="data:image/jpg;base64,'+imageField.toPlainText()+'"/>')

Open FileDialog and convert the binary image to base64

def getFileName():
    filePath = QFileDialog.getOpenFileName(None,  'Open Image File',  '',  '(Images *.jpg *.png)')

    if len(filePath) > 0:
        filePathField.setText(filePath)
        encodedImage = ''

Read the image file and proceed the encoding

        encodedImage = base64.b64encode(open(filePath, 'rt').read())

Set the appropriate fields for storing in the QGIS layer

        imageField.setPlainText(encodedImage)

Set HTML img tag around the base64 image

        imagePreview.setText('<img width="300" src="data:image/jpg;base64,'+encodedImage+'"/>')

If you have finished editing, save this file in the same directory where your QGIS project file is stored. As the final step to connect the layer images with the Python module you have to define the Python init function in the layer properties of the layer images. Add encodeimage.formOpen to the Python init function definition. The Fields definition of the layer properties of layer “images” should look like

layer_properties

Now you are able to add images and photos to your spatialite database table. But be careful because the main disadvantage of this approach is the size of the image. The conversion of a 5Mb image produces a huge base64 string. As the result it will be very wise to reduce the size of the images you want to add to the layer. If you like, you can add a check of image size to the Python module.

A nice tool of the QGIS map canvas is the option to add maptips to a layer. When maptips are activated images should be visible when the mouse moves over a feature of the layer images in the map.

Create a maptip with image as content

  • open the layer properties of the layer images and jump to the Display section.
  • tick the HTML radio button.
  • add the HTML code to the Text field as you can see in the figure below:
  • close the dialog with OK
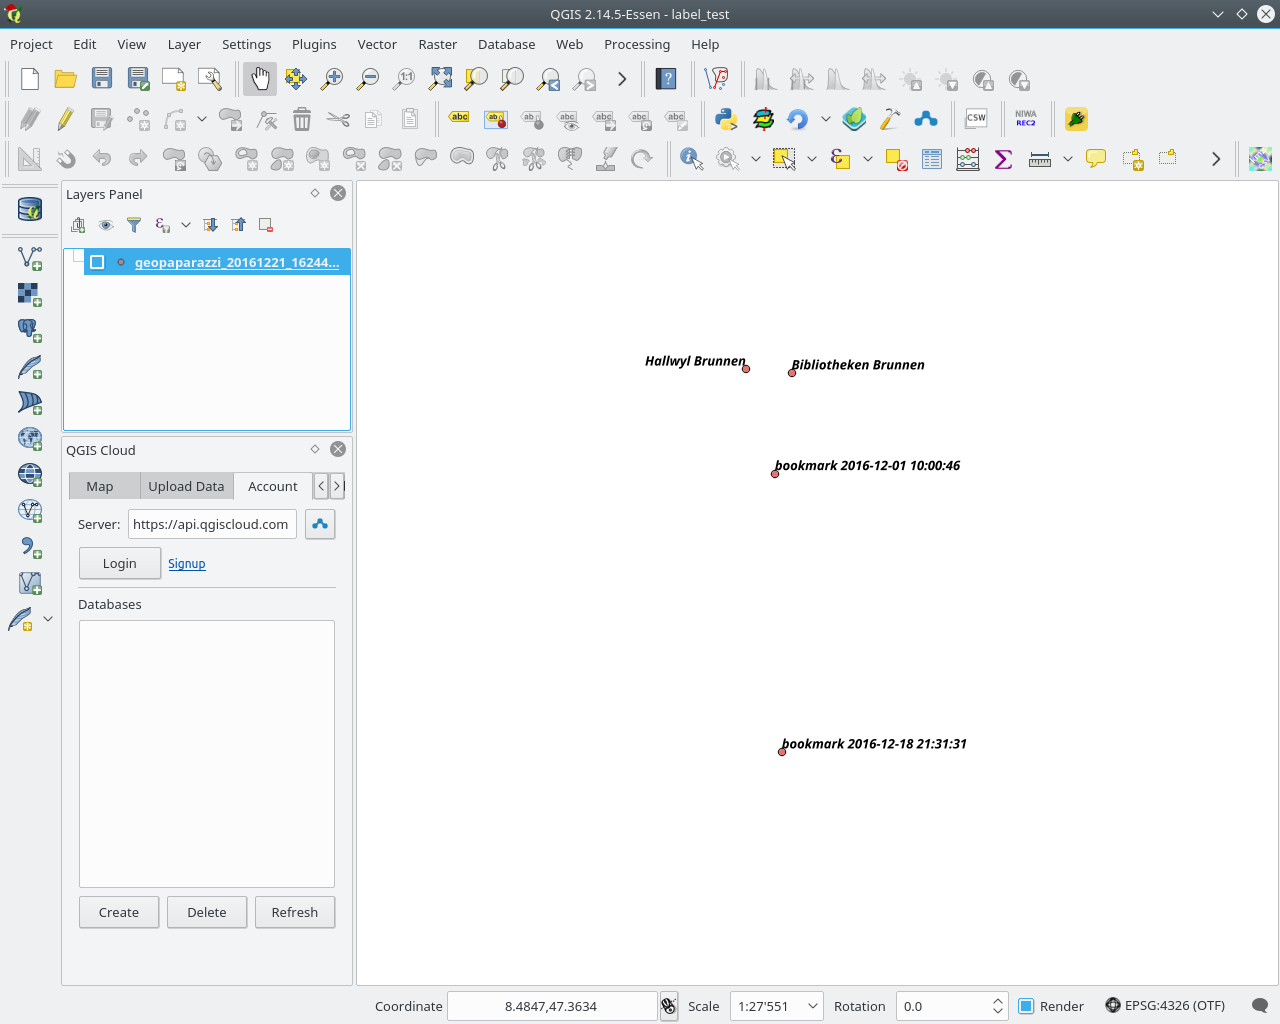
  • activate the maptip tool in QGIS and move over a feature of the layer images. The ame and the image are popped up.

layer_properties

Share your images with QGIS Cloud

What’s about to share the pictures and the geolocation of the pictures with others over the web. For this task QGIS Cloud is the right choice. QGIS Cloud is your personal spatial data infrastructure and offers OGC Web Services and ready preconfigured Web GIS clients.

  • save the project.
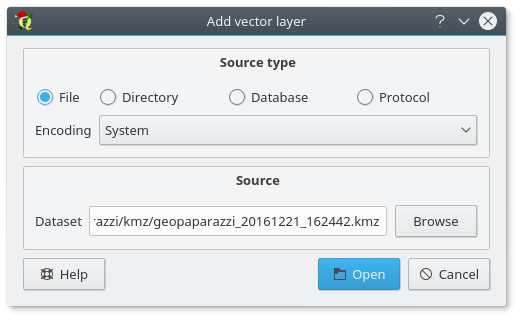
  • open the QGIS Cloud plugin (If you don’t have the QGIS Cloud plugin installed, than install it from the official QGIS Plugin Repository)
  • log in your QGIS Cloud account. (If you don’t have a QGIS Cloud account, sign up a new account).
  • upload the local data to your QGIS Cloud database (if you don’t have a QGIS Cloud database, create one from the QGIS Cloud plugin).
  • publish the project via QGIS Cloud plugin.
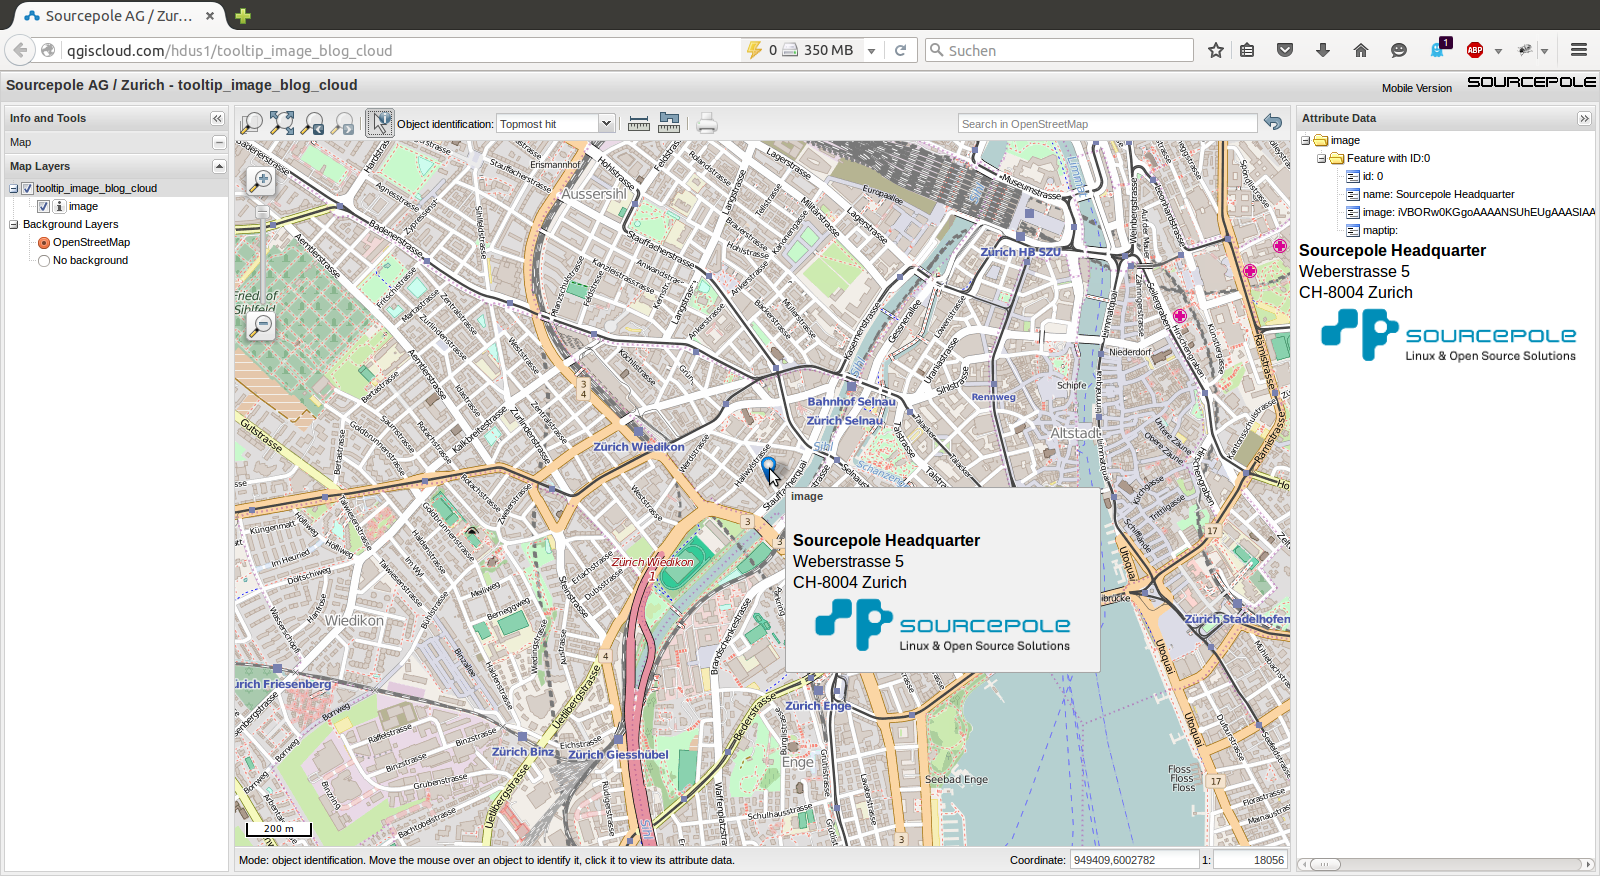
  • open the map in QGIS Cloud Web Client
  • activate the identify tool and move over a point with image
  • here you are, it works

result

Presentations at FOSS4G 2015 in Seoul

Slides from our presentations at FOSS4G 2015 in Seoul:

  • Keynote: The QGIS project and its evolution from a desktop GIS to a GIS platform - Slides
  • New QGIS functions for power users - Slides
  • QGIS Plugins - From Must-Haves to insider tips - Slides
  • Building an OpenLayers 3 map viewer with React - Slides

Thanks to the organizers of this great conference! It was a pleasure to get in contact with so many users from around the world.

foss4g2015

FOSSGIS 2015

Sourcepole war an der FOSSGIS 2015 in Münster unter anderem mit zwei QGIS-Vorträgen präsent:

QGIS Instant Print Plugin

As a side product of a customer project, we’re publishing a QGIS plugin for printing maps to a file with just two mouse clicks.

To use the instant print tool, a composer needs to be created first. The only requirement is that it contains exactly one map item.

The instant print tool can then be activated from the plugin toolbar by clicking on the plugin icon icon.

In the dialog window which appears, one can pick the composer to use as page layout. A selection rectangle is displayed in the map canvas, sized according to the size of the map item in the composer and the scale chosen in the instant print dialog. The selection rectangle can be freely dragged around to choose the region one wishes to print. When dragging the selection rectangle, the previous rectangle is shown shaded and can be used as a snap reference when setting the new region. While the instant print tool is active, the canvas can be panned with the middle mouse button.

screenshot

To instant print tool can be installed with the QGIS plugin manager and the sources are available on Github.

QGIS Cloud - Speed up the loading time of the web client

QGIS Cloud is your personal geo-data infrastructure in the internet. Publish maps and data. Share geo-information with others. And all of this very easily, without server, infrastructure and expert knowledge. If you know QGIS Desktop, then you know QGIS cloud just as well. Just install the QGIS cloud plugin from the official QGIS plugin repository and you’re good to go. You can publish as many maps as you want.

But the default settings of QGIS projects you like to publish via QGIS Cloud are not the best with respect to the performance of the QGIS Webclient / WMS. This point is noticeable when the published project contains many layers. Than the default settings are leading to bad performance. The size of the WMS GetCapabilities request is not negligible. Have a look at the first request:

QGIS Cloud slow response

The second request has a much faster response time than the first one:

QGIS Cloud fast response

What’s the difference between this two requests? First of all the slow request has to download and parse 3.1MB of XML data. The fast request has to download and parse 22KB only. However that work’s much faster. What makes the difference? If you have a look at the first request result, you can see, that tons of coordinate reference systems (CRS) are defined for every layer. These are all CRS supported by QGIS. In fact most of them will never be used. As the result the solution is to reduce the number of CRS in the QGIS Cloud WMS and WFS services. To achieve that you have to restrict the CRS in the QGIS project settings. Open the OWS Server tab and activate the CRS restrictions option and add all CRS of interest.

QGIS Cloud Webclient slow initialisation with none restricted CRS

QGIS Cloud Webclient fast initialisation with restricted CRS

Back to Top

Sustaining Members